June 2011
Plasma Science and Fusion Center
Massachusetts Institute of Technology
Cambridge MA 02139 USA
This work was supported in part by the U.S. Department of Energy (Grant No. DE-FG03-03SF22691), LLE (subcontract Grant No. 412160-001G), LLNL (subcontract Grant No. B504974).
Reproduction, translation, publication, use and disposal, in whole or in part, by
or for the United States government is permitted.
PSFC/JA-11-11
The Coincidence Counting Technique for orders of
magnitude background reduction in data obtained
with the Magnetic Recoil Spectrometer at OMEGA
and the NIF
D. T. Casey, J. A. Frenje, F. H. Séguin, C. K. Li, M. J. Rosenberg, H. Rinderknecht, M. J.-E. Manuel, M. Gatu Johnson, J. C. Schaeffer, R.
Frankel, N. Sinenian, R. A. Childs, and R. D. Petrasso Plasma Science and Fusion Center, MIT
V. Yu. Glebov, T. C. Sangster, M. Burke and S. Roberts Laboratory for Laser Energetics, UR
The Coincidence Counting Technique for orders of magnitude background reduction in data obtained with the Magnetic Recoil Spectrometer at OMEGA and the NIF
D. T. Casey, J. A. Frenje, F. H. Séguin, C. K. Li, M. J. Rosenberg, H. Rinderknecht, M. J.-E. Manuel, M. Gatu Johnson, J. C. Schaeffer, R. Frankel, N. Sinenian, R. A. Childs, and R. D. Petrasso a)
Plasma Science and Fusion Center, MIT, Cambridge, Massachusetts, 02139
V. Yu. Glebov, T. C. Sangster, M. Burke and S. Roberts
Laboratory for Laser Energetics, UR, Rochester, New York, 14623
A Magnetic Recoil Spectrometer (MRS) has been built and successfully used at OMEGA for measurements of down-scattered neutrons (DS-n), from which areal density (ρR) in both warm-capsule and cryogenic-DT implosions have been inferred. Another MRS is currently being commissioned on the National Ignition Facility (NIF) for diagnosing low-yield tritium-hydrogen-deuterium (THD) implosions and high-yield DT implosions. As CR-39 detectors are used in the MRS, the principal sources of background are neutron-induced tracks and intrinsic tracks (defects in the CR-39). The Coincidence Counting Technique (CCT) was developed to reduce these types of background tracks to the required level for the DS-n measurements at OMEGA and the NIF. Using this technique, it has been demonstrated that the number background tracks is reduced by a couple of orders of magnitude, which exceeds the requirement for the DS-n measurements at both facilities.
a)
Also Visiting Senior Scientist at the Laboratory for Laser Energetics, University of Rochester.
I. Introduction
CR-39 is an optical quality, clear plastic, often used as a particle track detector. CR-39 based nuclear diagnostics1 play an important role in diagnosing Inertial Confinement Fusion (ICF) implosions conducted at OMEGA2 and the National Ignition Facility (NIF).3 One important reason for this is that CR-39 can be effectively used in these harsh environments, as it is insensitive to x-rays, γ-rays, and EMP. CR-39 is, however, somewhat sensitive to neutrons (εCR-39 ~ 5×10
-5
at En=14 MeV), 4
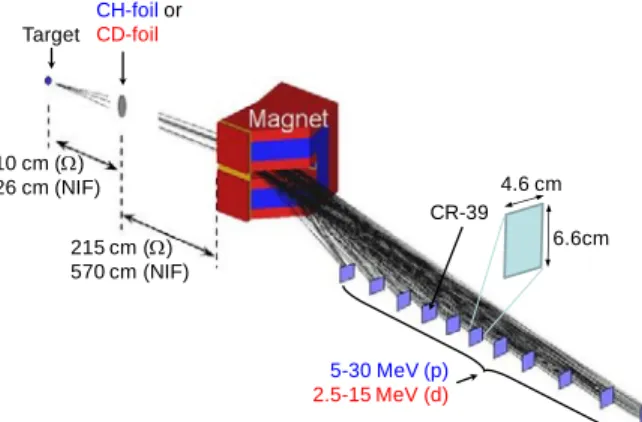
which often constitute the main background in CR-39 based charged-particle measurements.1, 5 Intrinsic tracks (defects in the CR-39) are another type of background that is also present in the CR-39 data. These sources of background must be reduced significantly in low-signal applications, in which a charged-particle signal is measured in the presence of a relatively strong neutron and intrinsic background. One such application is the measurement of the down-scattered neutron (DS-n) spectrum, from which an areal density (ρR) of an ICF implosion can be inferred. The diagnostic used for this measurement is a neutron spectrometer, called the Magnetic Recoil Spectrometer (MRS), recently built and successfully used on OMEGA.5-7 A second MRS is currently being commissioned on the NIF. Both systems consist of three main components as schematically shown in Figure 1; a CH2 (or CD2) foil positioned close to the implosion, for
production of recoil protons (or deuterons) from incident neutrons; a focusing magnet, positioned outside the target chamber on both OMEGA and the NIF, which disperses and focuses forward-scattered recoil particles onto the focal plane of the spectrometer; and an array of CR-39 detectors, positioned at the focal plane, which records the position of each recoil particle with a detection efficiency of 100%.1, 4
Figure 1: A schematic drawing of the MRS,5, 6 which depicts a CH2 or CD2 foil placed near the implosion, a magnet outside the target chamber, and an array of CR-39 detectors positioned at the focal plane of the spectrometer. The principle of the MRS is the following: a small fraction of the emitted neutrons hit the foil and produce recoil protons or recoil deuterons, depending on the foil type used. Forward scattered protons or deuterons are selected by an aperture in front of the magnet, momentum analyzed, and focused by the magnet onto CR-39 detectors positioned at the focal plane of the spectrometer. By measuring the spectrum of the recoil particles, the spectrum of the emitted neutrons is indirectly measured. Eleven and nine pieces of CR-39 are positioned at various locations (different energies) along the focal plane in the MRS at OMEGA and the NIF, respectively. Al and Ta filters are used in front of the CR-39 detectors to slow down the incoming recoil protons (or deuterons) to energies that are optimal for
detection.1 Some parameters for the MRS at OMEGA (Ω) and the NIF are indicated. Reprinted with permission from Rev. Sci.
Instrum. 79 (10), 10E502 (2008). Copyright 2008 American Institute of Physics.
The spectrum of the recoil protons (or deuterons), determined by the position at the detector plane, is used to infer the absolute neutron spectrum, as discussed in refs. [5-7]. Although the CR-39 efficiency for detecting background neutrons is small, measures are required to significantly reduce the neutron background for successful measurements of DS-n from cryogenic-DT8 and plastic-capsules implosions at OMEGA,9 and from low-yield tritium-hydrogen-deuterium (THD) implosions at the NIF.3 This is achieved by surrounding the MRS with polyethylene shielding, as a first step.10 Additional reduction of the background is accomplished by analyzing the MRS data using the Coincidence Counting Technique (CCT), which takes advantage of the fact that incident signal particles (protons or deuterons) penetrate deep inside the CR-39, producing correlated tracks on two surfaces. Using the CCT, these correlated signal tracks are searched for and distinguished from most of the background tracks, as the latter are generated anywhere in the CR-39 volume and are most likely to show up only on one surface or the other. More specifically, the CCT is implemented in a staged etch process, in which the CR-39 is etched in three steps; a sodium-hydroxide track etch, an ethanol-sodium-hydroxide based bulk etch, and a second track etch. The CCT has been applied to CR-39 in previous work11-14 but to our knowledge this is the first staged-etch implementation of the CCT. The paper is structured as follows: Sec. II describes the principle of the CCT, Sec. III discusses the application of the CCT to proton data obtained using our small linear accelerator,15 Sec. IV discusses the CCT application to MRS data obtained at OMEGA and the NIF, and in Sec. V concluding remarks are made.
II. The Coincidence counting technique (CCT) A. CR-39 as a charged-particle detector
When charged particles pass through the CR-39 material they leave trails of molecular damage, related to their stopping power (dE/dx), where x is the distance along the trail. These trails of damage are revealed as tracks by a chemical-etching process.1 As the CR-39 is a clear plastic with high optical quality, these tracks are readily observed and recorded with an optical microscope system. In the measurements described in this paper, 1-mm thick TASTRAK CR-39 made by Track Analysis Systems Ltd16 was used.
B. The principle of the CCT
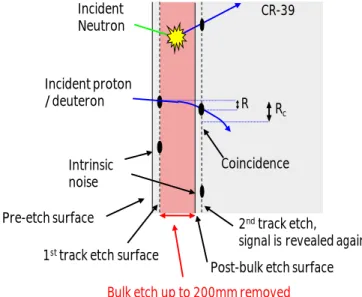
The CCT uses a three-step CR-39 etch process, which involves a sodium-hydroxide track etch, an ethanol-sodium-hydroxide bulk etch, and a second track etch (Figure 2).
CR-39 Target CH-foilor CD-foil 5-30 MeV (p) 2.5-15 MeV (d) 215 cm (Ω) 570 cm (NIF) 10 cm (Ω) 26 cm (NIF) 6.6cm 4.6 cm
When processed in this series of staged etches, the charged particles, which pass through the CR-39, leave microscopically visible tracks on each of the track-etched surfaces, resulting in coincident tracks. In contrast, most of the background tracks (both neutron-induced and intrinsic tracks) are generated randomly on each surface, as schematically shown in Figure 2.
Figure 2: Schematic illustration of the three staged-etch process of the CR-39 used in the CCT (i.e. a track etch, an ethanol bulk etch, and a second track etch). When charged particles pass through the CR-39 they leave trails of molecular damage related to their stopping power (dE/dx). These trails of damage are revealed by a chemical-etching process that uses NaOH at 80°C. In this first step, the CR-39 is track etched and subsequently scanned using an optical microscope. The location, diameter, contrast, and eccentricity of each track are recorded. In the second step, an ethanol based bulk etch is used to remove significant amounts of CR-39 material and thus remove all tracks. This is done by tailoring the chemical etchant, etch temperature, and etch depth, as discussed in detail in the text. A second track etch is then conducted, which reveals the tracks again. Another scan is conducted, and tracks recorded in the first and second scans are then searched for within a correlation radius (Rc) that is chosen to be greater
than Rl (caused by mainly lateral straggling, non-normal incidence and scan misalignment). Any tracks on the two surfaces within
Rc are considered to be coincidence tracks. In contrast, the background is mainly distributed randomly on one surface or the other
and can effectively be removed using the CCT.
C. First processing step – The sodium-hydroxide track-etch and scan
For the track-etch, the chemical etchant, concentration, and temperature is carefully chosen to maximize the ratio of the track-to-bulk etch rate. Typically, the CR-39 is etched for 6 hours in 6N NaOH at a temperature of 80 °C. This allows for more material to be removed in the damaged trails than around them (i.e., the CR-39 bulk material), resulting in particle-track growth. After the signal tracks have been revealed in the first track etch, the CR-39 is scanned and the location, diameter, contrast, and eccentricity of each track are recorded. The location of pin-mark fiducials are recorded and stored so that the coordinate system can be related in the following steps. More detailed information about this process can be found in the papers by Hicks17 and Seguin.1
D. Second processing step – The ethanol-sodium-hydroxide bulk etch
After this first track etch and scan, a second etch or the “ethanol bulk etch” is conducted to remove a significant amount of CR-39 material (see Figure 2). The objective of the ethanol bulk etch is to, first, erase the tracks that were made visible in the first track etch, and secondly, remove significant amount of CR-39 material to ensure that intrinsic and neutron-induced tracks do not reappear within the correlation radius Rc (or the search
radius). The chemical etchant, concentration, and temperature are chosen for this etch process, in such way that the track etch and ethanol bulk etch rates are nearly equal.18, 19 As a result, all visible tracks are removed if the ethanol bulk etch depth is significantly greater than the diameter of the tracks. For this etch process, a mixture of 2N NaOH/ethanol/water (made from 1 part of 10N NaOH/water and 4 parts pure ethanol) is used at a temperature in the range of 50-65 °C, resulting in a track-bulk-etch ratio of about one. Under these conditions, the ethanol bulk-etch rate (BER) is a strong function of temperature (
Figure 3
) but more importantly high enough to provideCR-39
1sttrack etch surface
Incident Neutron Incident proton / deuteron Rl Intrinsic noise Coincidence 2ndtrack etch,
signal is revealed again
Bulk etch up to 200mm removed
Pre-etch surface
Post-bulk etch surface Rc
sufficiently deep etches with reasonable processing time and without destroying the CR-39 surface quality. It was concluded that a BER value faster than about 40µm/hr (~60°C) generated unacceptable deterioration of the surface quality when the etch times are longer than ~1hr.
Figure 3: Ethanol bulk-etch rate (BER) as a function of etch temperature, when using a 2N NaOH/ethanol/water mixture made by diluting 1 part 10N NaOH/water in 4 parts ethanol. The blue triangles are for CR-39 that underwent a track etch (6 hours at 6N NaOH/water at 80 °C) prior to the bulk etch, as is typical for CCT data. The red circles are for CR-39 pieces that were placed directly in the bulk etch without a prior track etch. The difference between the curves show that CR-39, which undergoes a prior track etch, exhibits a 35-50% faster bulk etch rate during the ethanol bulk etch. In these experiments, 5.5-MeV alpha particles were used to estimate the track-etch rate while the BER was measured by comparing the CR-39 thickness before and after the etch process. As shown by the resulting data, the BER is a strong function of the etch temperature, which is a convenient control of the etch rate for a fixed etchant concentration.
A lower limit of the BER of ~10µm/hr (~50°C) was chosen on the basis of practical processing times for the CCT. The BER depends also on the CR-39 sensitivity. Differences in manufacturing and batch-to-batch differences in sensitivity will cause overall shifts in the BER curve. It is therefore necessary to check the consistency of new batches of CR-39. Typical ethanol bulk etch depths and times for the OMEGA and NIF MRS are illustrated in Table 1 of the Appendix.
During the ethanol bulk etch, the solution turns orange and then brown as salts and etch products build up in the solution. Significant etch-product build up on the CR-39 surface occurs as well, requiring frequent removal to prevent the insulation of the CR-39 from the etchant. Magnetic stirring units are therefore used to ensure that the build up on the CR-39 surface is continuously removed (see Figure 4).
Figure 4: Magnetic stirring unit (ThermoScientific Micro20 submersible stirrer with Telemodul control) and beaker used in the CR-39 bulk-etch process. During the ethanol bulk etch, significant etch products are produced on the CR-39 surface, which must be removed. This is done by using a magnetic-stirring bar operated at ~410 RPM at the bottom of the beaker. A Teflon holder shown to the right is used to lift up CR-39 above the stirring bar in the beaker. Normally the beaker is put into a hot water bath, but for illustration purposes the beaker has been lifted out from the bath.
E. Third processing step – The second track etch and scan
If the ethanol bulk etch is correctly executed, the amount of CR-39 material removed is smaller than the range of the incident charged particles (protons or deuterons). As a result, the particles’ damage trails can be revealed
0
10
20
30
40
50
60
45
50
55
60
65
70
B
u
lt
E
tc
h
R
a
te
[
u
m
/h
r]
Temperature [°C]
Without
track etch
With prior
track etch
Stir unit Stir bar CR-39 CR-39 holderagain by a second track etch. A subsequent scan of this surface is conducted. The location of the pin-mark fiducials, that were located in the previous scan, are located are recorded once again and used to correct the coordinate systems of the pre and post-bulk etch scans.20 By comparing the scans of the first and second track etched surfaces, correlated signal tracks can be searched for within some specified correlation radius Rc that must
be larger than the lateral displacement (Rl) of tracks (due to angle straggling in the CR-39, non-normal incidence, and possible scan shifts and scan misalignments). As neutron-induced and intrinsic tracks will reappear in new random locations on the second track-etched surface, the signal tracks can be distinguished from these background tracks using the CCT. Although some random-background coincidences (BCCT) will be counted, this
type of background can be characterized by misaligning the scans relative to each other by a distance significantly larger than Rc (see discussion in the next section).
Figure 5a and 5b
show the radial distribution ofsignal-coincident tracks and random-background-coincidences, respectively.
Figure 5: Distribution of signal deuteron coincidences (a) and random background coincidences (b) within the correlation radius
Rc, obtained on OMEGA shot 50515 with the MRS. In this particular case, an Rc of 35 µm was used. The calculated straggling
radius in the CR-39 is ~10µm when neglecting lateral straggling the filter and angular distribution of the incident deuterons. For
the determination of the random background coincidences in b), the post-bulk-etch scan was misaligned 200 µm relative to the
pre-bulk-etch scan, resulting in a random background coincidence level of ~35% of the total signal.
In this particular case, the scans were misaligned by ~200 µm to characterize the random-background coincidences. The net coincidence signal can then be determined by subtracting the random background data from the coincidence data. This background characterization and subtraction technique is a powerful feature of the CCT, as it allows the entire signal-scan area to be used for the background determination.
F. Random-Background Coincidences (BCCT)
The number of BCCT within the correlation radius Rc can be expressed analytically as:
2 c 2 1 CCT/A n n R B =
π
. (1) -40 -20 0 20 40 -40 -20 0 20 40 0 5 10 15 ∆x -40 -20 0 20 40 -40 -20 0 20 40 0 5 10 15 Aligned Misaligned 200µm ∆x = xfront- xback[µm] C o u n ts / P ix e l Rc Rc -40 -20 0 20 40 -40 -20 0 20 40 0 5 10 15 Aligned Misaligned 200µm ∆x = xfront- xback[µm] ∆ y [µ m ] ∆x [µm] Rc a) b)1sttrack etch surface
Post-bulk etch surface
Rc Rc
Random coincidence background Misaligned
200µm 200µm
Here, n1 is the total track density on the first track-etched surface (both signal and background), n2 is the
total track density on the second track-etched surface, and A is the total CR-39 signal area. The probability of finding a random track on the second track-etched surface within the correlation search area (π Rc
2
) is then given by n2π Rc
2
. The number of random coincidences per unit area then follows by multiplying by the track density on the first track-etched surface.
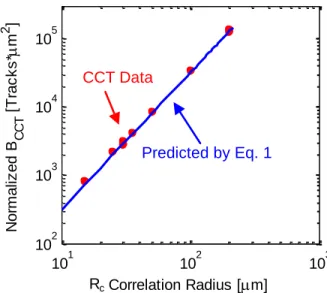
Figure 6: Normalized random background coincidences as a function of correlation radius Rc. A normalized number of CCT background counts (B/n1n2A) is plotted to allow for a comparison of different data with widely varying track densities. As shown by the data points, the observed number of random background coincidences is well described by Equation 1.
As shown by Equation 1, the number of random coincidences is proportional to the product of the total track densities and Rc
2
. As a consequence, minimizing Rc is essential for the CCT to be effective. For instance, reducing
Rc from 500 µm to 50 µm reduces the number of random coincidences with a factor of 100. As significant
background reduction is required for the MRS, i.e. a factor of ~50,5, 10 the relative alignment of the two scans, as well as CR-39 movement during scan, must be better than 15µm (which is comparable to the effect of angle straggling in the CR-39).
a. Neutron induced background coincidences
Although very unlikely, a background neutron can produce tracks on both the first and second track-etched surfaces within Rc, resulting in a real coincidence that cannot be eliminated by random background subtraction
described in the previous section. These tracks are produced primarily through two processes: np-elastic scattering and carbon break up, which are both volumetric processes, producing a elastically-scattered proton and three alpha particles,4 respectively. The minimum ethanol bulk-etch depth required to completely eliminate the carbon-breakup-alpha tracks is ~50 µm (the range of these particles in the CR-39 is ~45 µm). The tracks from the elastically-scattered protons, with a maximum energy of 14 MeV, cannot be removed completely by the ethanol bulk etch, as their maximum range is almost a factor of two larger than the thickness of the CR-39 (1 mm). However, most of these protons, if not all, are not detected as their scattering angles are larger than the solid angle
ΩC defined by RC and the bulk etch depth (lb) (see Figure 7
)
.101 102 103 102 103 104 105 Correlation Radius [µm] N or m al iz ed B C C T [ T ra c k s * µ m 2 ] CCT Data Predicted by Eq. 1 Rc
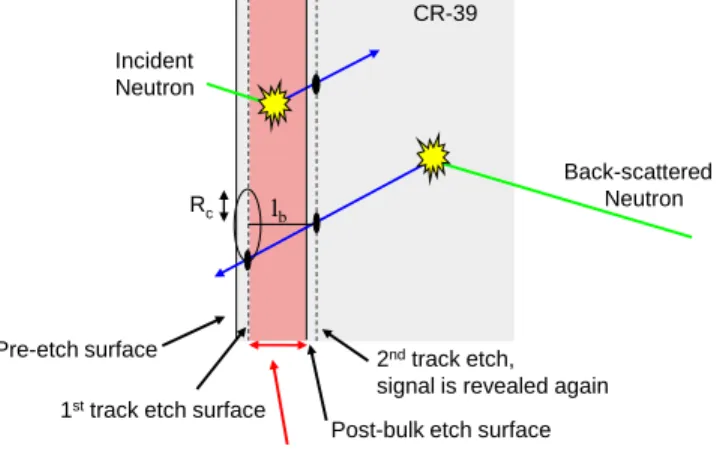
Figure 7: Illustration of two types of neutron interaction in the CR-39. Neutron scattered protons in between the pre and post-bulk-etch surfaces will only produce a recoil track on the one of the post-bulk-etched surfaces, while neutrons coming from behind and interacting in the bulk CR-39 volume can scatter protons into a narrow solid angle which could produce a neutron induced
coincidence. The probability of this event is relatively small as it scales with ~Rc2/ lb2. Neutrons can also break up carbon nuclei,
creating three alpha particles4 with a range of <50 µm. As bulk etches are >50µm, the number of neutron-alpha coincidences is
practically zero.
In addition, many protons elastically scattered within this solid angle are not detected, as their energies are too high for CR-39 detection (under typical conditions protons with energies > 10 MeV are not detected). Using these constraints, the number of neutron-induced coincidences (NCCT) can be expressed as:
∫
∫ ∫
+− + −≈
Ω
Ω
≈
Ω )) ( ( )) ( ( 2 2 ) ( ) ( 2))
(
(
)
,
(
E E E E b c n E E n CCT c c c c cdE
dE
E
d
nx
l
R
F
d
dE
dE
d
d
E
F
nx
A
N
θ θ θ θθ
σ
σ
θ
, (2)where Fn is the neutron fluence, n is the hydrogen-number density in the CR-39, x is the average path length of
the neutrons in the CR-39, and the integral evaluates the probability for producing a scattered proton that will generate a detectable track on the first and second track-etched surfaces within ΩC. The neutron cutoff energies in
the integral (
θ
) ( 1 )cos 2θ
0 − + − + − = +
∫
x x p p c dx dx dE EE are the neutron energies which can produce recoil protons
within the limited energy range capable of producing a track (Ep -~0 and Ep+~10MeV) accounting also for dEp/dx
energy loss from the interaction point to the etch surface and the kinematic scattering angle θ. As Equation 2 is extraordinarily difficult to evaluate analytically or numerically, the number of neutron-induced coincidences was instead experimentally determined as a function RC and lb, using high neutron fluence data obtained with the MRS
on OMEGA. Applying this approach to the problem, Equation 2 can be rewritten as:
2 2 b c n CCT
l
R
F
A
N
ε
≈
, (3)where ε was determined experimentally. From high-yield DT-implosion data obtained at OMEGA, ε was determined to be 2 ± 1×10⁻⁶ as shown in
Figure 8
.CR-39
1sttrack etch surface Incident Neutron
2ndtrack etch, signal is revealed again
Bulk etch up to 200µm removed
Pre-etch surface
Post-bulk etch surface
lb
Back-scattered Neutron Rc
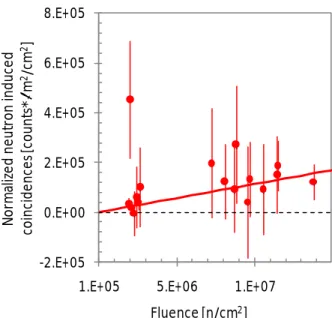
Figure 8: Number of neutron-induced coincidences (NCCT/A) per unit area, normalized by the bulk etch depth (lb) squared (NCCT*lb2/A), as a function of neutron fluence for the OMEGA MRS. This data was obtained in a background region on the CR-39 detectors where signal particles from the MRS cannot reach to CR-39 detector. Bulk etch depths between 100 - 200 μm were used to process the data. The solid
line represent the best fit to the data with Eq. 3 using a ε value of 2 ± 1×10⁻⁶. It is also noteworthy that this type of background is
insignificant for OMEGA cryogenic DT implosions, typically producing a neutron yield of ~2×10¹², because the neutron fluence is ~105
n/cm2 at the CR-39 detectors and thus two orders of magnitude below observable.
Given this scaling, the combination of a small solid angle and limited detectability of the scattered protons makes the CCT very effective at eliminating backscattered neutron-induced tracks. To quantify the potential impact of this background in MRS measurements at OMEGA and the NIF, the MCNP code was used to simulate the background neutron fluence at the MRS CR-39 detector array at both facilities. At OMEGA and the NIF, the scattered neutron fluence is strongly peaked near 14 MeV and was determined to be ~5×10⁻⁸·Yn neutrons/cm2 and
~2×10⁻⁹·Yn neutrons/cm2, respectively.10 When assuming a correlation radius of ~50 µm, an ethanol bulk-etch
depth of 200 µm, and a detector area of ~30cm2
, the number of neutron-induced background coincidences per cm2 for a given yield is NCCT /A ~6×10
-15
·Yn at OMEGA and NCCT /A ~ 3×10
-16
·Yn at the NIF. As cryogenic DT
implosions on OMEGA typically produce neutron yields less than 1013, this type of background is not an issue for the MRS at OMEGA. At the NIF, this type of background can, on the other hand, be significant when neutron yields exceed >1016. However, this will not be a problem as the CCT will not be applied to this type of data due to the high track densities, resulting in a large number of random coincidences as described by Equation 1. In this scenario, the standard counting technique (SCT),1 which is insensitive to this type of neutron induced background, will be applied because of strong signal levels.
b. Intrinsic background coincidences
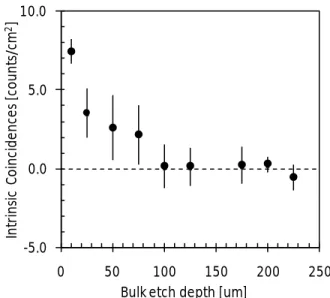
The intrinsic background tracks are primarily due to surface and bulk defects in the CR-39, which after the first track-etch typically look like small faint tracks that can be mistaken as real signal tracks. Given this, it is essential that the ethanol bulk etch is deep enough to effectively remove these tracks, i.e., to reveal an entirely new layer of defects and thereby remove intrinsic background coincidences. To determine the impact of the intrinsic background coincidences for different ethanol bulk-etch depths, a series of experiments were conducted in which the ethanol bulk-etch depth was varied from 10 – 230 µm. The results from these experiments, which are shown in Figure 9, illustrate that a small number of intrinsic background tracks persist for about 100 µm of the ethanol bulk etch.
-2.E+05 0.E+00 2.E+05 4.E+05 6.E+05 8.E+05
1.E+05 5.E+06 1.E+07
No rm al ize d ne ut ro n in du ce d co in ci de nc es [c ou nt s* µm 2/c m 2] Fluence [n/cm2]
Figure 9: Number of intrinsic background coincidence tracks as a function of ethanol bulk-etch depth. Each point represents an average of multiple measurements and the error bar represents the standard deviation for those measurements. This data set shows that the ethanol bulk-etch depth has to be at least or larger than ~100 µm to effectively remove most of the intrinsic background tracks.
Beyond 100 µm, all these tracks are completely removed and new randomly distributed ones have appeared. However, these randomly distributed tracks are effectively removed by the CCT (seeFigure 5).
III. Application of the CCT to D3He-proton data obtained at the MIT linear accelerator
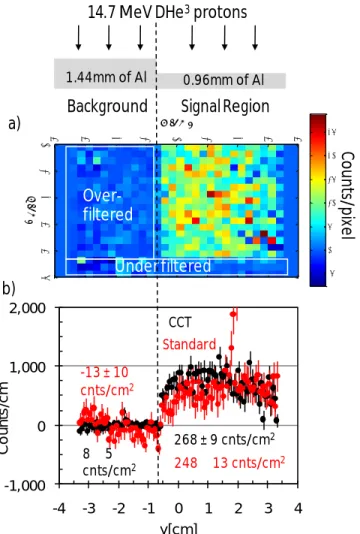
The CCT was validated by using D3He-proton data obtained in well controlled experiments on the MIT linear accelerator.15 In these experiments, a piece of CR-39 was exposed to ~5000 protons. The right-hand side of the piece was covered by a 960 µm thick aluminum filter to range the ~14.7 MeV protons to energies that are detectable on the first track-etched surface (5.7 MeV) and second track-etched surface (3.7 MeV). The left-hand side of the CR-39 was blocked by a 1440 µm thick aluminum filter to completely stop the D3He protons. An under-filtered region (bottom part of the image in Figure 10a) used 480 µm of aluminum where the proton energy is too high (~11MeV) to be detected on the first track-etched surface of the CR-39. A 200 µm deep ethanol bulk-etch was used to process the data. The SCT, described in the paper by Séguin et al.1 was applied to the data as well for comparison. This could be done, as the signal-to-background ratio was high in this experiment. An image of the scanned data is shown in Figure 10a, and the projected data on the y-axis is shown in Figure 10b. The CCT data is shown in black and the SCT data is shown in red. The over-filtered region shows no net counts, indicating that the CCT method properly subtracts the random background coincidences. Also, as expected the under-filtered region shows no net counts because the proton energy is too high. The signal distribution displays a parabolic shape, which is due to 1/R2 effect across the 7 cm high CR-39 that is positioned 7 cm from the target (the D3 He-proton source). -5.0 0.0 5.0 10.0 0 50 100 150 200 250 In tr in sic C oi nc id en ce s [ co un ts /c m 2]
Figure 10: a) D3He-proton data obtained on a piece of CR-39 fielded on the MIT linear accelerator on shot A2010012002. In this
experiment, 14.7-MeV protons from D3He reactions were used to expose the piece of CR-39 that had various types of filters in
front. In front of the signal region, a 960 µm Al filter was used to range down the D3
He protons to energies detectable on the first and second track-etched surfaces. Two background regions were established as well by placing 1440 µm Al in front of one area
(the over-filtered area in which the protons are ranged out) and 480 µm of Al in front of another area (the under-filtered area in
which the protons have too high energy to be detected on the first track-etched surface). b) Signal and background distributions projected onto the y-axis, where the black data points were obtained from the CCT analysis and the red data points were obtained from an analysis involving the standard counting technique. Both counting techniques could be applied to this data, as the signal-to-background level was high. Good agreement between the analysis techniques is shown, indicating that the CCT properly subtracts the background in the over-filtered background region, and thus provides high-fidelity data. Notice the spike at 2cm in the standard analysis, which is due to intrinsic noise, is removed by the CCT.
Considering the statistical uncertainties, the resulting data obtained with the two data-analysis techniques are in good agreement for both the signal and the background, indicating that the CCT is providing high-fidelity data. It is worth nothing that during this experiment, both SCT and CCT counted 37% lower D3He protons than an independent measurement using a surface-barrier-detector (SBD). Subsequent experiments have confirmed that this was due to an error in the assumed geometry of the source. When using corrected dimensions, the SCT and the SBD agree within statistical error.
IV. The application of the CCT to MRS data obtained at OMEGA and the NIF
As briefly discussed in the introduction, the background must be significantly reduced to meet the requirements for the MRS DS-n measurements at OMEGA and for MRS DS-n measurements in low-yield scenarios at the NIF.5 According to neutron-background measurements and simulations,10 a background reduction of ~50 times is required in addition to what the polyethylene shielding can provide.5 To meet this requirement, the CCT is applied to the MRS DS-n data.
The effectiveness of the CCT in reducing the background in the MRS data has been analytically evaluated by using Equation 1 as a starting point. Using this equation, the CCT background-reduction factor (fCCT) can be
expressed as the ratio between the SCT-background level and CCT-background level, i.e.,
-1,000 0 1,000 2,000 -4 -3 -2 -1 0 1 2 3 4 C o unt s /c m y[cm] 8± 5 cnts/cm2 248± 13 cnts/cm2 x [c m ] y [cm] 0 1 2 3 4 5 -4 -3 -2 -1 0 1 2 3 4 -5 0 5 10 15 x [cm]20 25 y [c m ] 0 1 2 3 4 5 -4 -3 -2 -1 0 1 2 3 4 -5 0 5 10 15 20 25 Signal Region Background Co unt s/pi xe l 268 ± 9 cnts/cm2 CCT Standard -13 ± 10 cnts/cm2 a) b) Under filtered Over-filtered
14.7 MeV DHe3protons
0.96mm of Al 1.44mm of Al
(
)
2(
39)
1 c 2 c 2 39 39 CCT SCT I R 1 R B B − − − − = + + + ≈ = n CR CR n CR n CCT F π π I F A IA A F fε
ε
ε
.
(4)Here, εCR-39 is the CR-39 efficiency for detecting neutrons, I is the intrinsic noise level per square centimeter.
Typically, the intrinsic noise level is ~100 tracks/cm2 but it can vary from piece to piece between 50-200 tracks/cm2. As stated before, the neutron fluence is Fn ~5×10
-8
·Yn neutrons/cm
2
and ~2×10⁻⁹·Yn neutrons/cm
2
at the OMEGA-MRS detector and the NIF-MRS detector, respectively. With an Rc of 50 µm, often used in the CCT
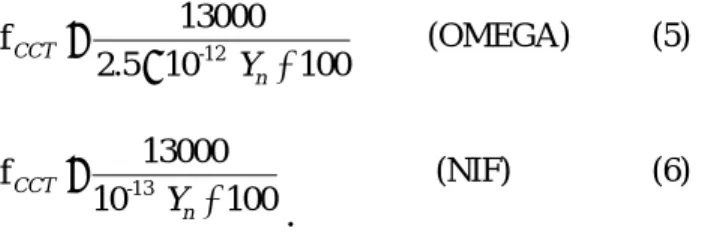
analysis, fCCT can be rewritten as:
00 1 10 2.5 13000 f -12 + × ≈ n CCT Y (OMEGA) (5) 00 1 10 13000 f -13 + ≈ n CCT Y
.
(NIF) (6)These expressions have been plotted in Figure 11 as a function of Yn (solid lines). The dotted lines indicate
the upper and lower limits for fCCT when considering the intrinsic-background variation. Also shown, are
measured data (red points) from OMEGA that are in good agreement with predictions, giving confidence in the predictions for the NIF. As shown by Equations 5 and 6, the CCT becomes less effective as Yn increases.
Figure 11: a) Background reduction factor (fCCT) as a function of neutron yield (Yn) when the CCT is applied to the MRS data at
OMEGA (red) and the NIF (blue). In these calculations, the intrinsic background is assumed to be ~100 tracks/cm2. The dotted
lines represent the effect of typical intrinsic-background variations (a factor of two higher and lower).1 The neutron background
was determined using refs. [4 and 10]. For comparison, experimental data are shown as well. b) Statistical uncertainty for the
DS-n yield, wheDS-n applyiDS-ng the CCT, as a fuDS-nctioDS-n of DT-primary-DS-neutroDS-n yield (Yn) for the OMEGA (assuming a typical
cryogenic-DT areal density of ~0.19 g/cm2 and the low resolution foil)5, 8 and NIF MRS (assuming an areal density of ~1.0g/cm2 during the
THD and ignition campaigns and using the medium-resolution foil).5 The red data points illustrate the observed DS-n statistical
uncertainty averaged over several MRS spectra obtained from different cryogenic-DT implosions at OMEGA (the inferred average
areal density in these implosions is 190mg/cm2). Good agreement between measured data and predictions indicate that the CCT
background (a) and resultant DS-n uncertainty (b) is well understood for the OMEGA MRS. As a consequence, the modeling of these parameters can be used with high confidence for the MRS at the NIF.
Using the fCCT dependence on Yn and the established DS-n signal dependence on Yn and ρR from
Frenje et al. 2008,6 it is straightforward to determine the statistical accuracy for the DS-n signal. The DS-n signal scales with Yn and ρR as 1.5×10
-10
Yn ρR(g/cm
2
) when using a low-resolution foil for the OMEGA-MRS, and 2×10-12 Yn ρR(g/cm
2
) when using a medium-resolution foil for the NIF-MRS. Figure 11b illustrates the predicted statistical uncertainty for a ρR of ~0.19g/cm2, which is a number that well represents cryogenic DT implosions at OMEGA,8 and for a ρR of ~1g/cm2 anticipated in THD implosions at
1.0 10.0 100.0 1,000.0
1.E+12 1.E+14 1.E+16
fCCT DT Neutron Yield (Yn) OMEGA
a)
NIF 1.0 10.01.E+12 1.E+14 1.E+16
DS -n unc er ta int y DT Neutron Yield (Yn) NIF OMEGA
b)
the NIF.5 Also shown in Figure 11b are averaged uncertainties determined from several OMEGA cryogenic DT implosions whose average ρR is ~0.19g/cm2. As illustrated by the graph, these results are in good agreement with the prediction. In addition, it should be noted that the statistical accuracy improves with increasing neutron yield even though the CCT becomes less effective because of higher signal and background levels, causing increased random coincidences.
ρR data obtained from well-established charged-particle techniques1, 9 were used to authenticate the MRS ρR data. The results from this authentication are shown in Figure 12.
Figure 12: ρR inferred from MRS data as a function of ρR inferred from charged-particle spectrometer (CPS) data. Considering
the error bars and that ±15% ρR asymmetries are typically observed for these types of implosions, good agreement between the
CPS and MRS data is observed, indicating that the CCT applied to the MRS data provides high-fidelity data.
The ρR values inferred from the two different techniques are in good agreement (considering the error bars and
that ±15% ρR asymmetries are typically observed for these types of implosions),9 indicating that the MRS technique, which utilizes the CCT, provides high-fidelity ρR data for a wide range of primary neutron yields (1012-1014) and ρRs (10-180 mg/cm2).5, 6
V. Conclusions
The coincidence counting technique (CCT), which uses a staged etch scheme, has been developed for the MRS at OMEGA and for MRS DS-n measurements in low-yield scenarios at the NIF to significantly reduce background. Background reductions of ~100 are regularly achieved when applying the CCT to DS-n data obtained at OMEGA. The CCT will also be pivotal for DS-n measurements in lower yield experiments anticipated in the THD campaign at the NIF. This work was supported in part by the U.S. Department of Energy (Grant No. DE-FG03-03SF22691), LLE (subcontract Grant No. 412160-001G), LLNL (subcontract Grant No. B504974).
References
1. F. H. Seguin, J. A. Frenje, C. K. Li, D. G. Hicks, S. Kurebayashi, J. R. Rygg, B. E. Schwartz, R. D. Petrasso, S. Roberts, J. M. Soures, D. D. Meyerhofer, T. C. Sangster, J. P. Knauer, C. Sorce, V. Y. Glebov, C. Stoeckl, T. W. Phillips, R. J. Leeper, K. Fletcher and S. Padalino, Review of Scientific Instruments 74 (2), 975-995 (2003).
2. T. R. Boehly, D. L. Brown, R. S. Craxton, R. L. Keck, J. P. Knauer, J. H. Kelly, T. J. Kessler, S. A. Kumpan, S. J. Loucks, S. A. Letzring, F. J. Marshall, R. L. McCrory, S. F. B. Morse, W. Seka, J. M. Soures and C. P. Verdon, Optics Communications 133 (1-6), 495-506 (1997).
3. E. I. Moses, Journal of Physics: Conference Series 112 (1), 012003 (2008).
4. J. A. Frenje, C. K. Li, F. H. Seguin, D. G. Hicks, S. Kurebayashi, R. D. Petrasso, S. Roberts, V. Y. Glebov, D. D. Meyerhofer, T. C. Sangster, J. M. Soures, C. Stoeckl, C. Chiritescu, G. J. Schmid and R. A. Lerche, Review of Scientific Instruments 73 (7), 2597-2605 (2002). 0 25 50 75 100 0 25 50 75 100 DS -n in fe rr ed ρ R [mg /c m 2] KO-d/KO-p Inferred ρR [mg/cm2]
5. J. A. Frenje, D. T. Casey, C. K. Li, F. H. Seguin, R. D. Petrasso, V. Y. Glebov, P. B. Radha, T. C. Sangster, D. D. Meyerhofer, S. P. Hatchett, S. W. Haan, C. J. Cerjan, O. L. Landen, K. A. Fletcher and R. J. Leeper, Physics of Plasmas 17, 056311-056319 (2010).
6. J. A. Frenje, D. T. Casey, C. K. Li, J. R. Rygg, F. H. Seguin, R. D. Petrasso, V. Y. Glebov, D. D. Meyerhofer, T. C. Sangster, S. Hatchett, S. Haan, C. Cerjan, O. Landen, M. Moran, P. Song, D. C. Wilson and R. J. Leeper, Review of Scientific Instruments 79 (10), 10E502 (2008).
7. J. A. Frenje, K. M. Green, D. G. Hicks, C. K. Li, F. H. Seguin, R. D. Petrasso, T. C. Sangster, T. W. Phillips, V. Y. Glebov, D. D. Meyerhofer, S. Roberts, J. M. Soures, C. Stoeckl, K. Fletcher, S. Padalino and R. J. Leeper, Review of Scientific Instruments 72 (1), 854-858 (2001).
8. T. C. Sangster, V. N. Goncharov, R. Betti, T. R. Boehly, D. T. Casey, T. J. B. Collins, R. S. Craxton, J. A. Delettrez, D. H. Edgell, R. Epstein, K. A. Fletcher, J. A. Frenje, Y. Y. Glebov, D. R. Harding, S. X. Hu, I. V. Igumenschev, J. P. Knauer, S. J. Loucks, C. K. Li, J. A. Marozas, F. J. Marshall, R. L. McCrory, P. W. McKenty, D. D. Meyerhofer, P. M. Nilson, S. P. Padalino, R. D. Petrasso, P. B. Radha, S. P. Regan, F. H. Seguin, W. Seka, R. W. Short, D. Shvarts, S. Skupsky, V. A. Smalyuk, J. M. Soures, C. Stoeckl, W. Theobald and B. Yaakobi, Physics of Plasmas 17, 056312-056317 (2010).
9. C. K. Li, F. H. Seguin, D. G. Hicks, J. A. Frenje, K. M. Green, S. Kurebayashi, R. D. Petrasso, D. D. Meyerhofer, J. M. Soures, V. Y. Glebov, R. L. Keck, P. B. Radha, S. Roberts, W. Seka, S. Skupsky, C. Stoeckl and T. C. Sangster, Physics of Plasmas 8 (11), 4902-4913 (2001).
10. D. T. Casey, (To be published).
11. S. Kacenjar, L. M. Goldman, A. Entenberg and S. Skupsky, Journal of Applied Physics 56 (7), 2027-2032 (1984). 12. I. Lengar, J. Skvarc and R. Ilic, Nuclear Instruments and Methods in Physics Research Section B: Beam Interactions
with Materials and Atoms 192 (4), 440-444 (2002).
13. H. Azechi, N. Miyanaga, R. O. Stapf, K. Itoga, H. Nakaishi, M. Yamanaka, H. Shiraga, R. Tsuji, S. Ido, K. Nishihara, Y. Izawa, T. Yamanaka and C. Yamanaka, Applied Physics Letters 49 (10), 555-557 (1986).
14. S. W. Barwick, K. Kinoshita and P. B. Price, Physical Review D 28 (9), 2338 (1983).
15. S. C. McDuffee, J. A. Frenje, F. H. Seguin, R. Leiter, M. J. Canavan, D. T. Casey, J. R. Rygg, C. K. Li and R. D. Petrasso, Review of Scientific Instruments 79 (4), 043302 (2008).
16. (Track Analysis Systems Ltd., H. H. Wills Physics Lab., Tyndall Ave., Bristol BS8 1TL, United Kingdom.).
17. D. G. Hicks, Massachusetts Institute of Technology, 1999.
18. Matiullah, S. Rehman and W. Zaman, Radiation Measurements 39 (3), 337-343 (2005).
19. D. Nikezic and K. N. Yu, Materials Science and Engineering: R: Reports 46 (3-5), 51-123 (2004).
20. Post-bulk etch scans tend to be more challenging for deeper bulk-etches, and therefore thinner CR-39, due to warping and auto-focus issues. Typically, CR-39 post-bulk etch thicknesses >0.5mm will maintain ideal focus throughout a scan (thinner detectors can be scanned with the aid of optical oil or pads). One-sided bulk-etches using a Teflon back-plate may also help alleviate some of these issues.
Table 1 – Typical bulk etch depths for recoil deuterons measured with the MRS at OMEGA (blue) and the NIF (red). Each window represents a CR-39 detector position at a certain energy along the MRS focal plane. This means that each window covers a specific energy range, as described in Figure 1 and ref. [5, 6]. Ta filtering in front of each CR-39 detector is specifically designed for the CCT to optimize
the energy of the incoming deuteron to be high enough to penetrate deeply into the CR-39 yet low enough for 100% detection efficiency.1
Likewise, the ethanol bulk-etch depth is chosen to be shorter than the deuteron range in CR-39. The ethanol bulk-etch time is calculated on the basis of the selected bulk-etch depth and the bulk-etch rate shown in Figure 3, using an etch temperature of 55 °C. For windows 1-3, the
CR-39 bulk-etch depth has to be smaller than 100 µm, which is the minimum etch depth to effectively remove the intrinsic-background
tracks (see Figure 9). For etch depths smaller than 100 µm, intrinsic coincident background must be considered. All down-scattered neutron data obtained at OMEGA and the NIF are processed with ~200µm ethanol bulk etch at and therefore insensitive to this intrinsic coincidence background. †For efficient processing, a 200µm bulk etch is sometimes slowed to run overnight at 50 °C for ~16hr.
OMEGA NIF
Window
Bulk-etch
depth [µm] Etch time[hr]
Bulk-etch
depth [µm] Etch time[hr]
1 NA NA 50* 2.5 2 70* 3.5 75* 3.5 3 90* 4.5 100 5 4 100 5 125 6 5 150 7.5 200 10† 6 200 10† 200 10† 7 200 10† 200 10† 8 200 10† NA NA