HAL Id: hal-00295616
https://hal.archives-ouvertes.fr/hal-00295616
Submitted on 15 Feb 2005
HAL is a multi-disciplinary open access
archive for the deposit and dissemination of
sci-entific research documents, whether they are
pub-lished or not. The documents may come from
teaching and research institutions in France or
abroad, or from public or private research centers.
L’archive ouverte pluridisciplinaire HAL, est
destinée au dépôt et à la diffusion de documents
scientifiques de niveau recherche, publiés ou non,
émanant des établissements d’enseignement et de
recherche français ou étrangers, des laboratoires
publics ou privés.
frequencies in the atmosphere simulation chamber
SAPHIR
B. Bohn, F. Rohrer, T. Brauers, A. Wahner
To cite this version:
B. Bohn, F. Rohrer, T. Brauers, A. Wahner. Actinometric measurements of NO2 photolysis
frequen-cies in the atmosphere simulation chamber SAPHIR. Atmospheric Chemistry and Physics, European
Geosciences Union, 2005, 5 (2), pp.493-503. �hal-00295616�
www.atmos-chem-phys.org/acp/5/493/ SRef-ID: 1680-7324/acp/2005-5-493 European Geosciences Union
Chemistry
and Physics
Actinometric measurements of NO
2
photolysis frequencies in the
atmosphere simulation chamber SAPHIR
B. Bohn, F. Rohrer, T. Brauers, and A. WahnerInstitut f¨ur Chemie und Dynamik der Geosph¨are II: Troposph¨are, Forschungszentrum J¨ulich, 52425 J¨ulich, Germany
Received: 25 October 2004 – Published in Atmos. Chem. Phys. Discuss.: 8 December 2004 Revised: 8 February 2005 – Accepted: 9 February 2005 – Published: 15 February 2005
Abstract. The simulation chamber SAPHIR at
Forschungs-zentrum J¨ulich has UV permeable teflon walls facilitating at-mospheric photochemistry studies under the influence of nat-ural sunlight. Because the internal radiation field is strongly affected by construction elements, we use external, radio-metric measurements of spectral actinic flux and a model to calculate mean photolysis frequencies for the chamber vol-ume (Bohn and Zilken, 2005). In this work we determine NO2 photolysis frequencies j (NO2) within SAPHIR using chemical actinometry by injecting NO2 and observing the chemical composition during illumination under various ex-ternal conditions. In addition to a photo-stationary approach, a time-dependent method was developed to analyse the data. These measurements had two purposes. Firstly, to check the model predictions with respect to diurnal and seasonal varia-tions in the presence of direct sunlight and secondly to obtain an absolute calibration factor for the combined radiometry-model approach. We obtain a linear correlation between cal-culated and actinometric j (NO2). A calibration factor of 1.34±0.10 is determined, independent of conditions in good approximation. This factor is in line with expectations and can be rationalised by internal reflections within the cham-ber. Taking into account the uncertainty of the actinometric
j(NO2), an accuracy of 13% is estimated for the determi-nation of j (NO2) in SAPHIR. In separate dark experiments a rate constant of (1.93±0.12)×10−14 cm3 s−1 was deter-mined for the NO+O3reaction at 298 K using analytical and numerical methods of data analysis.
1 Introduction
Photolysis processes are very important for atmospheric chemistry. For example, photolysis of NO2followed by
re-Correspondence to: B. Bohn
(b.bohn@fz-juelich.de)
action of O-atoms with O2is a major source of tropospheric ozone:
NO2+hν(λ ≤ 420 nm) → O(3P) + NO (1)
O(3P) + O2→O3 (2)
Photolysis frequencies (j ) are first-order rate constants quan-tifying the rate of photolysis processes in terms of a relative concentration change of the precursor molecule (or a photo-product). For Reaction (1):
j (NO2) = − 1
[NO2] d[NO2]
dt (3)
Of course, Eq. (3) is valid only in the absence of other NO2 loss or formation processes and cannot be used to determine
j(NO2) from NO2concentration measurements in complex, natural systems. In the troposphere for example, NO2loss by photolysis is partly compensated by reaction of NO with O3or peroxy radicals (RO2):
NO + O3→NO2+O2 (4)
NO + RO2→NO2+RO (5)
However, in simpler artificial chemical systems, photolysis frequencies can be determined by monitoring the gas-phase composition. This technique is well established since many years and referred to as chemical actinometry. A recent study by Shetter et al. (2003) gives an overview of previous work concerned with actinometric j (NO2) measurements. In the case of Reaction (1), a quartz flow-tube exposed to sunlight can be used where the carrier gas is loaded with a known concentration of NO2. Photolysis frequencies are then deter-mined from the increase of NO concentration as a function of exposure time.
The complex instrumentation needed to obtain a single photolysis frequency is a drawback of chemical actinometry
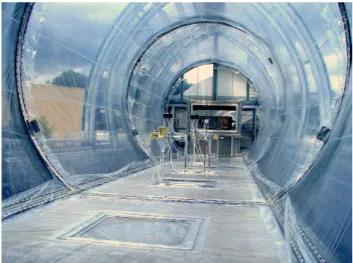
Fig. 1. The atmosphere simulation chamber SAPHIR from inside.
for field measurements. As a consequence, spectroradiome-try is a useful alternative where solar spectral actinic flux Fλ
is measured and photolysis frequencies are calculated using the absorption cross sections σ of the precursor molecule and the quantum yield φ of the photo-products (e.g. Hofzuma-haus et al., 1999). In the case of Reaction (1):
j (NO2) =
Z
σ (NO2) φ (O3P) Fλ(λ)dλ (6)
Recent comparisons show that chemical actinometry and spectroradiometry give consistent results within better than 10% with respect to NO2 and O3 photolyses (Kraus et al., 2000; Shetter et al., 2003; Hofzumahaus et al., 2004). In the case of NO2photolysis the agreement is even within 5% in a study from our laboratory (Kraus et al., 2000) using molec-ular data σ (NO2) and φ(O3P) by Merienne et al. (1995) and Troe (2000), respectively, as recently recommended by Atkinson et al. (2004).
The spectroradiometric approach is not as straightfor-ward for the atmosphere simulation chamber SAPHIR at Forschungszentrum J¨ulich (Fig. 1). SAPHIR was created to study tropospheric chemistry unaffected by transport pro-cesses at ambient levels of trace gas concentrations. As in the real troposphere, chemistry is driven by photolysis of trace gases induced by natural sunlight entering the cham-ber through UV-permeable teflon walls. However, the ra-diation field inside the chamber is complex and radiometric point measurements are not representative for the reactor as a whole.
In a preceding paper (Bohn and Zilken, 2005) a model was developed predicting time-dependent, volume-mean photol-ysis frequencies for the simulation chamber. This approach will be denoted SRTM (SAPHIR Radiative Transmission Model) in the following. The model uses external spectrora-diometric measurements of direct and diffuse down-welling 2π sr solar actinic flux as input and considers the influence
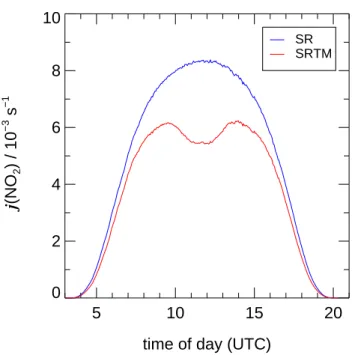
of opaque chamber elements and chamber teflon walls. Ba-sically, time and wavelength dependent, relative scaling fac-tors for the external diffuse and direct fluxes are derived. Time dependent effects are most pronounced for direct sun-light while wavelength dependence is induced by the cham-ber walls leading to an increase of transmission with wave-length by about 20% in the range 300–400 nm. As an ex-ample for the nature and magnitude of the predicted effects, Fig. 2 shows a comparison of j (NO2) measured externally by a spectroradiometer (SR) and calculated by SRTM. How-ever, so far SRTM calculations are on a relative basis and need confirmation on an absolute level. Moreover, the pre-dicted time-dependencies have to be checked experimentally before this method can be used for routine measurements of photolysis frequencies in SAPHIR, as intended.
In this work we present measurements of j (NO2) using the simulation chamber as a chemical actinometer. This is achieved by injecting NO2 into the clean chamber. Upon illumination, photolysis of NO2 leads to formation of NO and O3 (Reactions 1 and 2). After a delay dependent on experimental conditions, a photochemical equilibrium estab-lishes where losses of NO2 by photolysis are compensated by the NO+O3 reaction. From the equilibrium concentra-tions of NO, O3 and NO2 j(NO2) can be calculated. In addition we consider deviations from photochemical equi-librium by a time-dependent approach to derive photolysis frequencies under variable external conditions. The actino-metric j (NO2) are then compared with radiometric SRTM predictions. Clear sky conditions at different seasons as well as overcast conditions were investigated. Furthermore, the rate constant of Reaction (4) is determined in separate dark-experiments under the experimental conditions in SAPHIR.
2 Experimental
2.1 Simulation chamber
The simulation chamber SAPHIR consists of a double-wall teflon (FEP) tube held in a steel frame (Fig. 1). FEP film has been selected because it is chemically inert and UV per-meable. The inner tube is used as a reactor for simulation experiments. It has a volume of 270 m3and can be flushed with dry or wet synthetic air (purity 99.9999%) loaded with a variety of trace gases if required. The space between the in-ner and the outer tube (≈0.1 m) is permanently flushed with synthetic air to prevent diffusion of gases from outside. Typ-ical leak rates for the reactor are 3–8 m3 h−1. The cham-ber can be covered by a movable, opaque roof construction within about 1 min and vice versa. More details concerning the instrumentation and performance of SAPHIR are given by Rohrer et al. (2004).
2.2 Actinometry
In actinometric experiments typically 20–50 ppb of NO2 (500 ppm in N2, Messer Griesheim) were injected into the dark chamber filled with dry air in the absence of any VOCs (≤2 ppt, GC analysis). After about 30 min delay to allow for homogeneous mixing, the roof was opened and photo-chemistry started notable by a decrease of NO2 concentra-tion and a corresponding increase of NO and O3 concentra-tions. Measurements of trace gases were made close to the centre of the chamber 1 m above chamber ground. Ozone was measured by a commercial UV absorption instrument (Ansyco, O3 41M) with a precision of 0.3–0.5 ppb and an ac-curacy of 3%. NO and NO2were measured by a chemilumi-nescence technique with a modified commercial instrument (Eco Physics, TR 780). The precisions are about 5 ppt and 10 ppt at NO=0 and NO2=0, respectively, and about 0.1% at 50 ppb for both compounds. NO2is photolytically converted to NO prior to detection (Eco Physics, PLC 760). Absolute accuracy and the efficiency of the photolytic converter are checked by regular comparisons with certified NO test gas (2 ppm NO in N2, BOC Gases) and by gas phase titrations of NO with O3. The accuracy is 5% for NO, 10% for NO2 and 5% for the NO/NO2ratio. Measurements were made ev-ery 50 s with regular switching between NO and NO2 mea-surement modes. More details of this technique are given by Rohrer et al. (1998). Temperature and pressure measure-ments were made using an ultrasonic anemometer (Metek, USA-1) via sound velocity and a capacity pressure gauge (Setra Systems, 270), respectively. Temperature within the reactor cannot be controlled. It typically lies about 0–5 K above ambient temperature, dependent on conditions.
2.3 Spectroradiometry and model calculations
During the actinometric chamber experiments the down-welling 2π sr solar actinic flux was measured externally by a spectroradiometer on the roof of a nearby building. Spectra were recorded about every 2 min in the range 280–420 nm with a distinction of diffuse and direct sunlight by using a shadow ring. More details concerning these measurements are given by Hofzumahaus et al. (1999) and Bohn and Zilken (2005). From these measurements solar actinic flux spec-tra and photolysis frequencies are derived for the simulation chamber using SRTM calculations (Bohn and Zilken, 2005).
3 Results and discussion
3.1 Rate constant of the O3+NO reaction
The rate constant of Reaction (4) is essential to determine
j(NO2) by actinometry. k4can be obtained in separate dark-experiments by closing the roof of SAPHIR after the actino-metric experiments described in Sect. 2.2. NO subsequently reacts with O3 forming NO2until one or both reactants are
5
10
15
20
time of day (UTC)
0
2
4
6
8
10
j
(NO
2) / 10
−3s
− 1 SR SRTMFig. 2. Diurnal variation of j (NO2) measured on a clear sky day (28
July 2002) outside the simulation chamber by a spectroradiometer (SR). SRTM predictions for SAPHIR including a preliminary cal-ibration factor of 1.3 (Bohn and Zilken, 2005) are shown for com-parison.
used up. Although the chemical system is simple, data anal-ysis is not straightforward because starting concentrations of NO and O3are not identical. As a consequence, dilution is affecting the reactants differently. Although dilution is slow (≤10−5s−1), it cannot be neglected for the dark reactions be-cause the decay of the reactants takes hours at the concentra-tion levels used. On the other hand, diluconcentra-tion can be treated as a first-order loss process for any species because the chamber behaves like an ideal stirred reactor in good approximation.
The reason for the different starting concentrations of NO and O3is the presence of small amounts of HONO produced by the chamber walls at illumination (Rohrer et al., 2004). The formation rate of HONO is usually small at dry condi-tions (≈50 ppt h−1) but photolysis of HONO leads to a small net production of NO. On the other hand, after a longer pe-riod of illumination there is a tendency towards a net O3 pro-duction, probably induced by reaction of OH (from HONO photolysis) with traces of VOCs not accounted for by GC analysis. The background reactivity with respect to OH can be expressed in terms of a hypothetical CO concentration of typically 100–300 ppb (Rohrer et al., 2004). However, CO is just a proxy for unknown reactants because CO levels are continuously monitored and usually below the detection limit (10 ppb). These interferences are leading to certain levels of HO2 or RO2radicals upon illumination (see Sect. 3.2) and small differences of NO and O3 starting concentrations for the dark experiments.
0 5 10 15 20 t / 103 s 0.0 0.5 1.0 1.5 c / 10 11 cm −3 NO2 NO O3
Fig. 3. Concentration traces of NO2, NO and O3after closing the
roof of SAPHIR at t=0. Blue, red, and black lines, respectively,
show fits from analytical data analysis using NO and NO2data.
In the succeeding two sections, analytical and numerical methods of data analysis will be used to determine k4from the experimental NO, NO2and O3concentration traces.
3.1.1 Analytical solution
The dark-reactions can be described by the following set of differential equations:
d[NO]
dt = −k4[NO][O3] −kdil[NO] (7)
d[O3]
dt = −k4[NO][O3] −kdil[O3] (8)
d[NO2]
dt =k4[NO][O3] −kdil[NO2] (9)
Here kdil is the first-order rate constant of loss by dilution. Utilising the additional relations:
[NOx] = [NO2] + [NO] (10)
=([NO2]0+ [NO]0)exp(−kdilt )
[NO] − [O3] =([NO]0− [O3]0)exp(−kdilt ) (11) the system of differential equations can be reduced to a single equation:
d[NO]
dt = −k4[NO] {[NO] (12)
−([NO]0− [O3]0)exp(−kdilt )} − kdil[NO] This equation was solved using the solution of Bernoulli’s differential equation:
[NO] = (13)
D ([NO]0− [O3]0)
1 − [O3]0/[NO]0exp {k4/ kdil([NO]0− [O3]0) (D −1)}
Table 1. Approximate NO and NO2 starting concentrations
([O3]0≈[NO]0), experiment durations, temperatures, and fitted
scaling factors f4(Eq. 14) from four dark-experiments
investigat-ing Reaction (4). Scalinvestigat-ing factors usinvestigat-ing analytical and numerical data analysis are given.
[NO]0a [NO2]0a time/h T/Kb f4c f4d
1.1 0.7 6 295 1.017 –e
3.0 5.0 3 293 1.009 0.956
1.1 0.5 6 295 1.028 1.022
0.4 0.3 6 298 1.003 0.986
average 1.014±0.014 0.988±0.034
aUnits are 1011cm−3,bmean temperature at early stage of
exper-iments (see text),canalytical result,dnumerical result,eno flow
rate measurements available.
where D= exp(−kdilt ). From this solution, NO2 and O3 concentrations can be calculated by inserting into Eqs. (10) and (11).
Figure 3 shows an example of NO, NO2and O3 concentra-tion traces after closing the roof of SAPHIR. In the data anal-ysis Eqs. (13) and (10) were fitted simultaneously to NO and NO2 data, respectively, using a Levenberg-Marquardt least-squares fitting procedure. O3data were not used because of their poorer precision. Five parameters were determined: the starting concentrations [NO]0, [NO2]0and [O3]0and the rate constants kdiland k4.
In Table 1 conditions of four experiments are summarised. Temperatures could not be kept constant and typically de-creased by 6–8 K during the experiments. The temperatures listed in Table 1 are averages from the early periods of the ex-periments in which the NO concentrations dropped to 10% of the starting concentrations (within about 1–2 h after closing the roof). These temperatures are accurate within about 1 K and were assigned to the rate constants obtained from the fits. However, the temperatures of Table 1 are not representative for the later periods of the experiments where temperatures dropped more strongly. The numerical analysis described in the next section therefore uses actual temperatures for the whole period and rate constants k4 are determined in terms of scaling factors with respect to a currently recommended temperature dependent rate expression (Sander et al., 2003):
f4=
k4(T )
3.0 × 10⁻¹²cm3s−1exp(−1500K/T ) (14) To allow a comparison these scaling factors are also used here to specify the analytical results listed in Table 1.
In all four experiments the scaling factors are close to unity within 3%. The average corresponds to a rate constant of 1.98×10⁻¹⁴cm3 s−1at 298 K. A 5% error is estimated for the assumption of constant temperatures during the experi-ments. Together with the uncertainties of the NOx measure-ments we evaluate a 7% error limit for the rate constant. To
check for consistency, dilution rate constants were also de-termined by fitting the exponential decay D of Eq. (13) to the NOxdata. The kdil are similar within 2% compared to the results obtained by fitting Eq. (13).
3.1.2 Numerical analysis
Equation (13) shows that analytical solutions are getting complex and inflexible even for a fairly simple chemical system. A drawback of Eq. (13) is that dilution and tem-perature are assumed constant during the experiments. Al-though this is correct in good approximation, the use of mea-sured, time-dependent temperatures and dilution rates calcu-lated from the flow rates of the gas-supplying system (Rohrer et al., 2004) are more appropriate. For that reason a nu-merical method was used where time-dependent experimen-tal boundary conditions are considered and the system of differential equations (Eqs. 7–9) is solved numerically us-ing EASY (Brauers and Rohrer, 1999) which is an interface for the FACSIMILE integrator with time dependent bound-ary values and the Levenberg-Marquardt algorithm for fit-ting. The results of the numerical data analysis are also sum-marised in Table 1. Only three experiments could be anal-ysed because flow rates were not monitored in one of the experiments. The averaged scaling factor corresponds to a rate constant of 1.93×10⁻¹⁴cm3s−1 at 298 K. Taking into account the uncertainty of the NOx measurements and the reproducibility of the result, we estimate a 6% error limit for this rate constant.
In the numerical approach also the slow reaction:
NO2+O3→NO3+O2 (15)
and consecutive reactions of the NO3 radical were consid-ered, e.g. the fast reaction NO3+NO→2 NO2. However, switching off Reaction (15) in the numerical analysis led to fitted scaling factors within 1% compared to the full model, i.e. neglecting Reaction (15) in the analytical approach is jus-tified.
In summary, both methods of data analysis yield con-sistent results with averaged scaling factors very close to unity within 2%. Our data therefore confirm the recommendation by Sander et al. (2003) (Eq. 14,
k4(298 K)=1.95×10⁻¹⁴cm3s−1) which will be used in the following experiments aiming at photolysis frequencies. It should be noted that a recently recommended Arrhenius ex-pressions by Atkinson et al. (2004) is lower by 12% at 298 K.
3.2 Photolysis frequencies from trace gas concentrations
The idea behind chamber actinometry is to derive mean pho-tolysis frequencies from concentrations of trace gases within the reactor. After injection of NO2into the chamber, photol-ysis of NO2leads to formation of O3and NO. On the other hand, reaction of these photo-products regenerates NO2. A
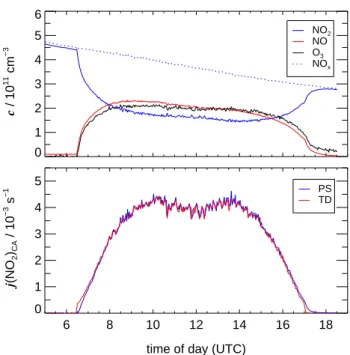
0 1 2 3 4 5 6 c / 10 11 cm −3 NO2 NO O3 NOx 6 8 10 12 14 16 18 time of day (UTC)
0 1 2 3 4 5 j (NO 2 )CA / 10 − 3 s − 1 PS TD
Fig. 4. Upper panel: concentration traces of NO2, NO and O3in an
actinometric experiment on 10 March 2002 under clear sky condi-tions. Lower panel: actinometric photolysis frequencies calculated using the photo-stationary (PS) and the time-dependent (TD) ap-proach.
photochemical equilibrium has established if loss and for-mation processes compensate each other, e.g. in the case of NO2:
d[NO2]
dt = −j (NO2)[NO2] +k4[O3][NO] = 0 (16) Since k4is known, j (NO2) can be calculated from the equi-librium concentrations of NO2, O3and NO:
j (NO2)PS=
k4[O3][NO]
[NO2]
(17)
In this photo-stationary (PS) approach losses by dilution are neglected and j (NO2) is assumed constant. Dilution is in-deed too slow to influence the photochemical equilibrium with j (NO2) typically more than two orders of magnitude greater than kdil.
The PS approach remains reasonable if j (NO2) changes slowly compared to the relaxation time of the photochem-ical system. This is the case for example under clear-sky conditions where j (NO2) exhibits a smooth change in the course of a day. However, under cloudy conditions j (NO2) often changes rapidly which leads to a departure from pho-tochemical equilibrium. As a consequence, a different, time-dependent approach (TD) was used to retrieve j (NO2) from the trace gas concentrations and their changes. The differen-tial equation describing the time-dependence of the NO con-centration,
d[NO]
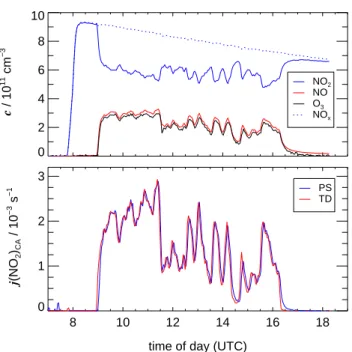
0 2 4 6 8 10 c / 10 11 cm −3 NO2 NO O3 NOx 8 10 12 14 16 18 time of day (UTC)
0 1 2 3 j (NO 2 )CA / 10 − 3 s − 1 PS TD
Fig. 5. Upper panel: concentration traces of NO2, NO and O3in
an actinometric experiment on 9 March 2002 under overcast condi-tions. Lower panel: actinometric photolysis frequencies calculated using the photo-stationary (PS) and the time-dependent (TD) ap-proach.
can be rearranged accordingly:
j (NO2)TD=j (NO2)PS+ 1 [NO2] d [NO] d t (19) ≈j (NO2)PS+ 1 [NO2] 1 [NO] 1 t
As an example Fig. 4 shows the variation of trace gas con-centrations in a typical actinometric experiment on a clear sky day (10 March 2002). After a short delay upon open-ing the roof, a photochemical equilibrium establishes and concentrations change smoothly in the course of the day. Accordingly, also the actinometric photolysis frequencies
j(NO2)CAshow a smooth change with a local minimum at noon caused by chamber construction elements. Except from short periods directly after opening and closing the roof of SAPHIR, the j (NO2)CAbased on photo-stationary (PS) and time-dependent (TD) calculations look very similar.
The concentration changes in Fig. 4 are superposed by continuous dilution as reproduced by NOx. Although the experiment starts with a small residue of NO left behind from an actinometric experiment on the previous day (Fig. 5), there is a slight built-up of O3resulting in a residue of about 1 ppb at the end of the day. These imbalances were explained qualitatively in Sect. 3.1. However, the influence of the un-derlying processes on the photochemical equilibrium are in-significant. For example, if a formation rate of 1 ppb/h of O3 is assumed as an upper limit and attributed to NO2photolysis preceded by oxidation of NO by HO2(or RO2) radicals, the
0 1 2 3 j(NO2)PS / 10 −3 s−1 0 1 2 3 4 j (NO 2 )SR / 10 − 3 s − 1 0 1 2 3 j(NO2)TD / 10 −3 s−1 r=0.940 r=0.994 PS TD
Fig. 6. Correlations of j (NO2)SRmeasured externally with a
spec-troradiometer and inside SAPHIR by actinometry on an overcast day (9 March 2002). Left: photo-stationary calculation (PS), right: time-dependent approach (TD). Linear correlation coefficients r are indicated.
contribution to the continuous, total NO2formation (mainly by NO+O3) is well below 1%.
Figure 5 shows an experiment on an overcast day (9 March 2002) where occasionally photolysis frequencies changed rapidly. This results in strong changes of trace gas concen-trations and sporadic deviations from photochemical equi-librium as indicated by the differences of actinometric PS and TD photolysis frequencies. The PS data clearly show a delayed response to the concentration changes. The dif-ference between the data sets is more obvious in Fig. 6 where the j (NO2)CAare plotted against radiometric photol-ysis frequencies j (NO2)SRmeasured outside of SAPHIR by the spectroradiometer. Under overcast conditions there is a linear correlation between the data (Sect. 4). However, the quality of the correlation improves significantly using the time-dependent calculations rather than the photo-stationary approach, as reflected in the correlation coefficients. In the following we will use the time-dependent approach for all types of conditions, i.e. j (NO2)CA=j (NO2)TD.
4 Comparison of actinometry with SRTM predictions
4.1 Overcast conditions
If a constant sky radiance distribution is assumed under over-cast conditions, a linear correlation between photolysis fre-quencies measured externally by radiometry and internally by actinometry is expected. Figure 7 shows a plot of external
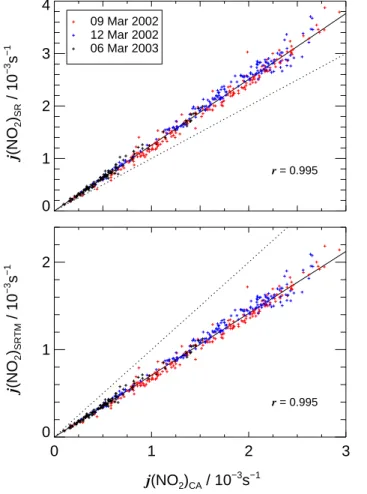
j(NO2)SR against j (NO2)CA for three overcast days. The correlation of the data is excellent with a linear correlation coefficient of 0.995. The mean ratio j (NO2)CA/j (NO2)SRis 0.80±0.05, i.e. the radiometric data have to be scaled down by this factor to obtain mean chamber values. A mean ra-tio is used here rather than a linear regression to give equal weight to all data points irrespective of the j (NO2) values. The procedure is justified because deviations from the mean
0 1 2 3 4 j (NO 2 )SR / 10 −3 s − 1 09 Mar 2002 12 Mar 2002 06 Mar 2003 0 1 2 3 j(NO2)CA / 10−3s−1 0 1 2 j (NO 2 )SRTM / 10 − 3 s − 1 r = 0.995 r = 0.995
Fig. 7. Upper panel: Correlations of j (NO2)SRmeasured externally
with a spectroradiometer and j (NO2)CAfrom actinometry inside
of SAPHIR on three overcast days. Lower panel: Similar plot with radiometric data modified by SRTM calculations. Dotted lines show 1:1 relationships. Linear correlation coefficients r are indicated.
ratio are normally-distributed in good approximation with a standard deviation stated above.
Of course, also SRTM predicts a linear relationship between j (NO2)CA and j (NO2)SR. Based on a time-independent SOC sky radiance distribution (standard over-cast sky, Grant and Heisler, 1997), scaling factors are cal-culated theoretically with very minor time-dependent varia-tions introduced by wavelength correction. Accordingly, the plot of j (NO2)SRTM against j (NO2)CA in the lower panel of Fig. 7 looks virtually identical and a similar correlation coefficient is obtained. However, the scaling factor neces-sary to convert SRTM to mean SAPHIR values is different: 1.41±0.09. In contrast to the data measured externally, the model data have to be scaled up because the SRTM calcula-tions are merely dealing with attenuation of radiation by the opaque chamber construction and the limited transmission of the chamber walls. The scaling factor corresponds to the chamber specific quantity hc>1 introduced in SRTM which is rationalised by internal reflections within SAPHIR (Bohn
0 2 4 6 8 j (NO 2 )SR / 10 −3 s − 1 10−11 Mar 2002 28−29 Jul 2002 09−11 Dec 2002 0 2 4 6 j(NO2)CA / 10−3s−1 0 1 2 3 4 5 j (NO 2 )SRTM / 10 − 3 s − 1 r = 0.972 r = 0.997
Fig. 8. Upper panel: Correlations of j (NO2)SR measured
exter-nally with a spectroradiometer and j (NO2)CAfrom actinometry
in-side of SAPHIR at a total of seven clear sky days. Different seasons are indicated by colors: black (winter), blue (spring) and red (sum-mer). Lower panel: Similar plot with radiometric data modified by SRTM calculations assuming a UV-A radiance distribution from lit-erature. Dotted lines show 1:1 relationships, dashed lines the results obtained for overcast conditions. Linear correlation coefficients r are indicated.
and Zilken, 2005). The effective hcjNO
2obtained here: hcjNO 2 = j (NO2)CA j (NO2)SRTM (20)
is close to an estimate hc≈1.3, independent of wavelength, based on 4π radiometric measurements inside the chamber (Bohn and Zilken, 2005). The difference can be explained by an underestimation of chamber wall transmission in the theoretical model. The results of the data analysis for over-cast conditions are summarised in Table 2.
The SOC radiance distribution used for the model calcula-tions is an empirical expression with a cosine dependence of radiance on zenith angle (Grant and Heisler, 1997). The ap-plied distribution is about 40% brighter at the zenith and 40% darker at the horizon compared to an isotropic distribution (uniform overcast sky, UOC). However, Bohn and Zilken
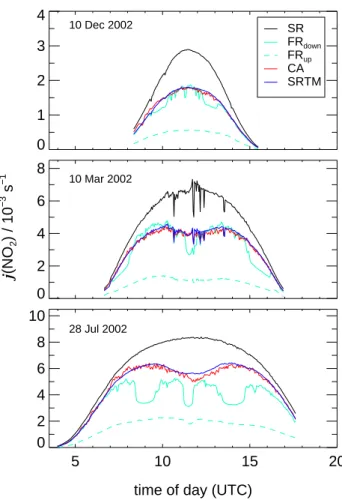
0 1 2 3 4 SR FRdown FRup CA SRTM 0 2 4 6 8 j (NO 2 ) / 10 −3 s − 1 5 10 15 20
time of day (UTC) 0 2 4 6 8 10 10 Dec 2002 10 Mar 2002 28 Jul 2002
Fig. 9. Examples of diurnal variations of j (NO2) on the three
days of different seasons under clear sky conditions. The external SR data (black) show momentary influence of clouds on 10 March 2002. FR data (green) show local measurements of (up- and
down-welling) j (NO2) inside the chamber using a filterradiometer (see
text). SRTM data (blue) were scaled by a factor hcjNO
2=1.34 to fit
the CA data (red). Data sets start and end at times where the roof of SAPHIR was opened and closed, respectively.
(2005) show that despite this difference, SOC and UOC ra-diance distributions give very similar SRTM model results.
4.2 Clear sky conditions
Under clear sky conditions the SRTM model is predicting strong time-dependent chamber effects. In accordance with this, the upper panel of Fig. 8 shows a much poorer correla-tion between external j (NO2)SRand internal j (NO2)CAfor a total of seven clear sky days of different seasons. Appli-cation of the SRTM model significantly improves this cor-relation by removing most of the diurnal and seasonal de-viations as shown in the lower panel of Fig. 8. The mean ratio j (NO2)CA/j (NO2)SRTM yields hcjNO2=1.34±0.08.
Ta-ble 2 gives a summary of results for different seasons. Within experimental scatter, there is no seasonal dependence of scal-ing factors recognisable. Moreover, although the agreement
is not perfect, within error limits the hcjNO
2is similar for
over-cast conditions.
The SRTM calculations of Fig. 8 are based on an empiri-cal, analytical distribution of diffuse UV-A sky radiance un-der clear sky conditions (Grant et al., 1997). This is con-sidered the best attempt if no information on radiance distri-butions is available. However, the quality of the correlation and the factor hcjNO
2 hardly change if the time-independent
SOC radiance distribution is used also for clear sky condi-tions. The reason for this are compensating effects concern-ing the shadow rconcern-ing correction and the scalconcern-ing factors for dif-fuse sky radiation (Bohn and Zilken, 2005). Using the SOC radiance distribution also for clear sky conditions has two practical benefits. Firstly, less time is needed for the model calculations because a large fraction of computing time is concerned with time-dependent shadow ring corrections and scaling factors of diffuse sky radiation. Secondly, no distinc-tion has to be made within the model between clear sky and overcast conditions.
The effect of neglecting the influence of the chamber walls in the model calculations was also investigated. Bohn and Zilken (2005) already showed that the chamber walls are ex-pected to induce minor time-dependent effects. The largest influence was predicted for direct sunlight during the win-ter season when the contribution of direct sunlight is low. In accordance with this, the quality of the CA versus SRTM cor-relations are still satisfactory if the influence of the chamber walls is neglected (r=0.996). On the other hand, the factor
hcjNO
2 is lower and close to unity (1.03±0.07) showing that
the limited transmission of the chamber walls is almost com-pensated by internal reflections. However, the hcjNO
2obtained
by neglecting chamber walls in the SRTM calculations can-not be assigned to other photolysis frequencies because no wavelength dependence is considered. Therefore SRTM cal-culations including chamber walls are preferred.
Taking clear sky and overcast data together and assum-ing an SOC radiance distribution, we obtain a mean scal-ing factor hcjNO
2=1.34±0.10 for all conditions, i.e. by the use
of external spectroradiometric measurements and the SRTM model we are currently able to determine photolysis frequen-cies for the simulation chamber within 7–8% of the actino-metric reference.
4.3 Limitations and possible error sources
As an example of the remaining differences between acti-nometric and SRTM data, Fig. 9 shows diurnal variations of photolysis frequencies on three clear sky days of differ-ent seasons. Spectroradiometric photolysis frequencies mea-sured outside exhibit a familiar, smooth shape with typi-cal diurnal and seasonal variations. Local measurements of j (NO2) inside the chamber using a filterradiometer (FR) are strongly influenced by shadows cast by construction ele-ments. Filterradiometers measure integrated actinic flux in a selected wavelength range imitating the relative spectral
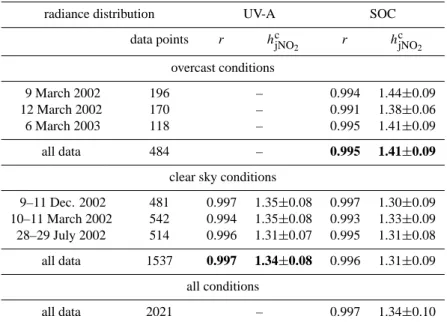
Table 2. Linear correlation coefficients r and chamber scaling factors hcjNO
2 from a comparison of SRTM and actinometric j (NO2) data for
overcast and clear sky conditions assuming different sky radiance distributions (see text). Error bars correspond to 1σ standard deviations. The results using model inputs considered most realistic are given in bold font.
radiance distribution UV-A SOC
data points r hcjNO
2 r h c jNO2 overcast conditions 9 March 2002 196 – 0.994 1.44±0.09 12 March 2002 170 – 0.991 1.38±0.06 6 March 2003 118 – 0.995 1.41±0.09 all data 484 – 0.995 1.41±0.09
clear sky conditions
9–11 Dec. 2002 481 0.997 1.35±0.08 0.997 1.30±0.09 10–11 March 2002 542 0.994 1.35±0.08 0.993 1.33±0.09 28–29 July 2002 514 0.996 1.31±0.07 0.995 1.31±0.08 all data 1537 0.997 1.34±0.08 0.996 1.31±0.09 all conditions all data 2021 – 0.997 1.34±0.10
response of NO2 photodissociation (Volz-Thomas et al., 1996). FR calibrations are made by comparisons with the spectroradiometer under field conditions. The FR measure-ment location was close to the centre of the chamber, 1 m above ground covering both hemispheres separately. The data shown in Fig. 9 confirm that local measurements are inadequate to monitor photolysis frequencies for the simula-tion chamber under condisimula-tions with direct sunlight. On the other hand, actinometric j (NO2) data and SRTM predictions agree well within experimental scatter. However, the preci-sion of the actinometric data is poorer, limited mainly by the ozone measurements. This induces part of the uncertainties of the hcjNO
2. Other possible error sources of more systematic
nature which will be discussed in the following.
Taking the actinometric j (NO2) representative for the chamber volume, assumes well mixed conditions because the radiation field within the chamber is heterogeneous as indicated by the FR measurements. Mixing properties of the chamber were investigated for different conditions. With opened roof there is convection resulting in complete mix-ing of an injected trace gas pulse within about 10 min. In the dark this mixing time is prolonged by a factor of about three. Operation of two mixing fans shortens the mixing time by a factor of about four. Switching on and off the mixing fans produced no significant change of the measured trace gas concentrations in an actinometric experiment un-der clear sky conditions where local shadowing should be most pronounced. This shows that mixing within SAPHIR is fast enough to prevent formation of concentration gradients
caused by heterogeneous illumination, at least for the photo-chemical system studied in this work. Nevertheless, small-scale mixing effects can reduce the precision of the actino-metric measurements.
Changes of temperature were not considered in the SRTM calculations where T =298 K was assumed. Using a linear interpolation of recommended, temperature dependent data of absorption cross sections and quantum yields of NO2 (Atkinson et al., 2004), a temperature coefficient of about 0.08% K−1for j (NO2) is estimated. This has a negligible effect (<1%) on the hcjNO
2 scaling factors listed in Table 2.
There seems to be a slight underestimation of the actino-metric data by the model calculations in the morning. Such an effect can be explained by different degrees of staining of the chamber foil exposed to atmospheric conditions. Staining can also explain the differences in the scaling factors hcjNO
2
obtained for overcast and clear sky conditions. Model cal-culations seem to over-predict chamber values when direct sunlight is incident from southerly directions passing the up-per, more horizontal parts of the chamber walls predestined for staining. However, such effects are hard to assess quanti-tatively within the model.
With respect to the model, the assumption of a constant SOC sky radiance distribution under overcast conditions is certainly not always matched by reality. Azimuthal varia-tions of sky radiance can produce changes in the actinomet-ric j (NO2) not noticed by the external radiometric measure-ment. Under clear sky conditions changes of aerosol load will produce variations in sky radiance distributions. Thus,
the model input can be improved by a measurement of sky ra-diance distributions as indicated by Bohn and Zilken (2005). The SRTM model postulates an effective internal ampli-fication of radiation, considered quantitatively by the factor
hc. This amplification is assumed independent of direction of incidence. Moreover, scattering processes at the cham-ber walls are not explicitly included in the model approach. Both deficiencies can lead to additional time-dependent ef-fects. It is therefore not surprising that model predictions of photolysis frequencies for single locations within the cham-ber are not well reproduced by measurements. Although the exact time and durations of shadows cast on a location can be predicted, the quantitative effect of these shadows cannot be reproduced. Qualitatively, the light level is higher than pre-dicted in the shadows and lower outside the shadows which can be explained by scattering of radiation at the chamber walls.
Generally also a wavelength dependence of the factor hcis expected. On the other hand, part of this dependence could already be included in the relative wavelength dependence applied within the SRTM model which is based on a compar-ison of spectral actinic flux measurements inside and outside the chamber (Bohn and Zilken, 2005). Moreover, 4π mea-surements within the chamber give no indication for a strong wavelength dependence. For the time being we therefore as-sume hc=hcjNO
2 for all wavelengths.
For the accuracy of the j (NO2) determination within SAPHIR possible systematic errors of the actinometric ref-erence have to be considered as well. Because the uncer-tainty of the rate constant k4is dominated by the uncertainty of the NOx measurements these errors are not independent and add to 10% for the photolysis frequencies. Assuming that the errors estimated for SRTM (7–8%) and O3(3%) are independent, a total uncertainty of 13% is evaluated.
5 Conclusions
In this work we have shown that mean j (NO2) photolysis frequencies for the atmosphere simulation chamber SAPHIR can be predicted with high accuracy and precision using the SRTM approach described by Bohn and Zilken (2005). The remaining differences can be attributed to deficiencies of the model approach and technical problems concerning the con-dition of the chamber walls. With respect to the actinometric reference measurements, we estimate an accuracy of 7–8% for the j (NO2) based on SRTM, independent of external con-ditions. No change of hcjNO
2was found within a period of one
year and regular checks will be made to assure the long-term reliability of the measurements. Taking into account possi-ble systematic errors of the actinometric j (NO2), photolysis frequencies within SAPHIR are accurate within 13%.
In future work the SRTM model and the radiometric in-put data could be improved as indicated by Bohn and Zilken (2005). Moreover, an actinometric determination of j (O1D)
photolysis frequencies within SAPHIR will be developed to check the model predictions concerning wavelength depdence. Ozone measurements of higher precision and the en-forcement of well mixed conditions would improve the pre-cision and the accuracy of the actinometric j (NO2) measure-ments. Under these conditions, smaller systematic effects caused by deficient model assumptions could be investigated.
Acknowledgements. The authors thank A. Hofzumahaus for useful
discussions. Financial support by the Helmholtz-Gemeinschaft
(B. Bohn) is gratefully acknowledged. Edited by: U. P¨oschl
References
Atkinson, R., Baulch, D. L., Cox, R. A., Crowley, J. N., Hamp-son, R. F., Hynes, R. G., Jenkin, M. E., Rossi, M. J., and Troe, J.: Evaluated kinetic and photochemical data for atmospheric
chem-istry: Part 1 – gas phase reactions of Ox, HOx, NOxand SOx
species, Atmos. Chem. Phys., 4, 1461–1738, 2004, SRef-ID: 1680-7324/acp/2004-4-1461.
Bohn, B. and Zilken, H.: Model-aided radiometric determination of photolysis frequencies in a sunlit atmosphere simulation cham-ber, Atmos. Chem. Phys., 5, 191–206, 2005,
SRef-ID: 1680-7324/acp/2005-5-191.
Brauers, T. and Rohrer, F.: Easy AtmoSpheric Chemistry: Manual Vers 2.9, available at http://www.fz-juelich.de/icg/icg-ii/easy doc/, 1999.
Grant, R. H. and Heisler, G. M.: Obscured overcast sky radiance distributions for ultraviolet and photosynthetically active radia-tion, J. Appl. Meteorol., 36, 1336–1345, 1997.
Grant, R. H., Heisler, G. M., and Gao, W.: Clear sky radiance distri-butions in ultraviolet wavelength bands, Theo. Appl. Climatol., 56, 123–135, 1997.
Hofzumahaus, A., Kraus, A., and M¨uller, M.: Solar actinic flux spectroradiometry: A technique for measuring photolysis fre-quencies in the atmosphere, Appl. Opt., 38, 4443–4460, 1999. Hofzumahaus, A., Lefer, B. L., Monks, P. S., Hall, S. R., Kylling,
A., Mayer, B., Shetter, R. E., Junkermann, W., Bais, A., Calvert, J. G., Cantrell, C. A., Madronich, S., Edwards, G. D., Kraus, A., M¨uller, M., Bohn, B., Schmitt, R., Johnston, P., McKenzie, R., Frost, G. J., Griffioen, E., Krol, M., Martin, T., Pfister, G., R¨oth, E. P., Ruggaber, A., Swartz, W. H., Lloyd, S. A., and VanWeele,
M.: Photolysis frequency of O3 to O(1D): Measurement and
modelling during the international photolysis frequency mea-surement and modelling intercomparision (IPMMI), J. Geophys. Res., 109, D8, D08S90, doi:10.1029/2003JD004333, 2004. Kraus, A., Rohrer, F., and Hofzumahaus, A.: Intercomparison of
NO2photolysis frequency measurements by actinic flux
spectro-radiometry and chemical actinometry during JCOM97, Geophys. Res. Lett., 27, 1115–1118, 2000.
Merienne, M. F., Jenouvrier, A., and Coquart, B.: The NO2
absorp-tion spectrum: 1. Absorpabsorp-tion cross-secabsorp-tions at ambient tempera-ture in the 300–500 nm region, J. Atmos. Chem., 20, 281–297, 1995.
Rohrer, F., Br¨uning, D., Grobler, E. S., Weber, M., Ehhalt, D. H., Neubert, R., Sch¨ussler, W., and Levine, I.: Mixing Ratios and
photostationary state of NO and NO2observed during the POP-CORN field campaign at a rural site in Germany, J. Atmos. Chem., 31, 119–137, 1998.
Rohrer, F., Bohn, B., Brauers, T., Br¨uning, D., Johnen, F.-J., Wah-ner, A., and Kleffmann, J.: Characterisation of the photolytic HONO source in the atmosphere simulation chamber SAPHIR, Atmos. Chem. Phys. Discuss., 4, 7881–7915, 2004,
SRef-ID: 1680-7375/acpd/2004-4-7881.
Sander, S. P., Friedl, R. R., Ravishankara, A. R., Golden, D. M., Kolb, C. E., Kurylo, M. J., Huie, R. E., Orkin, V. L., Molina, M. J., Moortgat, G. K., and Finlayson-Pitts, B. J.: Chemical Ki-netics and Photochemical Data for Use in Atmospheric Studies, Evaluation Number 14, JPL Publ. 02–25, 2003.
Shetter, R. E., Junkermann, W., Swartz, W. H., Frost, G. J., Craw-ford, J. H., Lefer, B. L., Barrick, J. D., Hall, S. R., Hofzuma-haus, A., Bais, A., Calvert, J. G., Cantrell, C. A., Madronich, S.,
M¨uller, M., Kraus, A., Monks, P. S., Edwards, G. D., McKenzie, R., Johnston, P., Schmitt, R., Griffioen, E., Krol, M., Kylling, A., Dickerson, R. R., Lloyd, S. A., Martin, T., Gardiner, B., Mayer, B., Pfister, G., R¨oth, E. P., Koepke, P., Ruggaber, A.,
Schwan-der, H., and van Weele, M.: Photolysis frequency of NO2:
Mea-surement and modelling during the international photolysis fre-quency measurement and modelling intercomparision (IPMMI), J. Geophys. Res., 108, D16, 8544, doi:10.1029/2002JD002932, 2003.
Troe, J.: Are primary quantum yields of NO2 photolysis at
λ ≤398 nm smaller than unity?, Z. Phys. Chem., 214, 573–581,
2000.
Volz-Thomas, A., Lerner, A., P¨atz, H.-W., Schultz, M., McKenna, D. S., Schmitt, R., Madronich, S., and R¨oth, E.-P.: Airborne
mea-surements of the photolysis frequency of NO2, J. Geophys. Res.,
![Table 1. Approximate NO and NO 2 starting concentrations ([O 3 ] 0 ≈ [NO] 0 ), experiment durations, temperatures, and fitted scaling factors f 4 (Eq](https://thumb-eu.123doks.com/thumbv2/123doknet/14774375.592931/5.892.462.819.199.323/approximate-starting-concentrations-experiment-durations-temperatures-scaling-factors.webp)