Petrophysical properties, mechanical behaviour, and failure modes of impact melt-bearing breccia (suevite) from the Ries impact crater (Germany)
Texte intégral
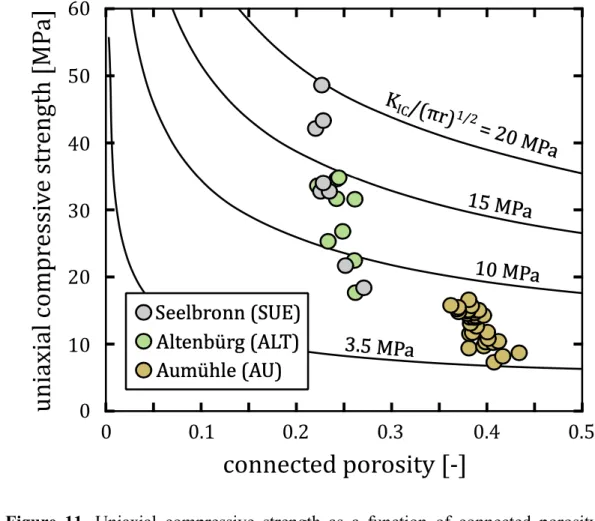
Figure

Documents relatifs
Even though the density of the rock decreases from the pillar wall to its centre, the other parameters – water-accessible porosity, water content at saturation and strength
The difference in degradation between the three classes of impact craters allowed us to construct a time series showing that craters with alluvial fans (type II) were formed between
The impact of one diagenetic cycle of dissolution and precipitation on the pore networks’ heterogeneity and consequently on the petrophysical properties (i.e. porosity and
We measured the impact of the compression step on the textural properties (namely the specific surface area and the micropore volume), the bulk density and the
water (and dissolved methane gas) was then allowed to be expelled.. of pore pressure and temperature) is far outside the phase diagram (Figure 9), the methane
These investigations showed a decrease of the intrinsic properties of polycarbonate (Young modulus, yield stress, etc.); the superposition of spectra IRTF shows that the intensity
These investigations showed a decrease of the intrinsic properties of polycarbonate (Young modulus, yield stress, etc.); the superposition of spectra IRTF shows
The exfoliation corrosion behaviour of the 2091 alloy in all three tempers is shown in Table 3 as determined by the EXCO test and compared with the results of unclad 2024-T3 sheet
