HAL Id: hal-00296900
https://hal.archives-ouvertes.fr/hal-00296900
Submitted on 9 Jan 2006
HAL is a multi-disciplinary open access
archive for the deposit and dissemination of
sci-entific research documents, whether they are
pub-lished or not. The documents may come from
teaching and research institutions in France or
abroad, or from public or private research centers.
L’archive ouverte pluridisciplinaire HAL, est
destinée au dépôt et à la diffusion de documents
scientifiques de niveau recherche, publiés ou non,
émanant des établissements d’enseignement et de
recherche français ou étrangers, des laboratoires
publics ou privés.
Precipitation dynamics and chemical properties in
tropical mountain forests of Ecuador
R. Rollenbeck, P. Fabian, J. Bendix
To cite this version:
R. Rollenbeck, P. Fabian, J. Bendix. Precipitation dynamics and chemical properties in tropical
mountain forests of Ecuador. Advances in Geosciences, European Geosciences Union, 2006, 6,
pp.73-76. �hal-00296900�
SRef-ID: 1680-7359/adgeo/2006-6-73 European Geosciences Union
© 2006 Author(s). This work is licensed under a Creative Commons License.
Advances in
Geosciences
Precipitation dynamics and chemical properties in tropical
mountain forests of Ecuador
R. Rollenbeck1,2, P. Fabian2, and J. Bendix1
1University of Marburg, Faculty of Geography, Laboratory for Climatology and Remote Sensing (LCRS), Germany 2Institute for Bioclimatology and Immission Research, Technical University of Munich, Germany
Received: 28 June 2005 – Revised: 6 October 2005 – Accepted: 18 October 2005 – Published: 9 January 2006
Abstract. Terrestrial ecosystems in southern Ecuador are strongly affected by interannual climate variations. This holds especially true for the episodic El Ni˜no events, which cause above-normal precipitation in the coastal region of Ecuador and below normal values in the eastern provinces of the Amazon basin (Bendix, 1999). For the transitional zone between these two extremes, which consists mainly of the andean slopes and larger interandean basins the effect on interannual climate variability is not well known.
The PREDICT project monitors regional climate in the provinces of Loja and Zamora-Chinchipe (4◦S/79◦W), where a strong gradients of precipitation are observed. Be-tween the eastern slopes of the Cordillera Real and the dry valley of Catamayo, which are only 70 km apart, rain totals drop from over 4000 mm to only 300 mm per year. These two extremes represent the both sides of the Andean moun-tain chain and are completely covered by the study area, which is 120 km in diameter. Methods used are a combi-nation of point measurements (climate stations) and remote sensing devices (weather radar, satellite imagery), which en-able a high-resolution real-time observation of rain distribu-tion and underlying processes. By this, ideal condidistribu-tions are given to monitor a potential shift of the transition zone be-tween below-average and above-average rainfall situated in this region, if another ENSO-anomaly occurs. Furthermore variability of atmospheric nutrient inputs is analysed within the scope of the project, to assess further impacts on this ecosystem.
1 Introduction
Southern Ecuador is one of the regions most impacted by ENSO-variability. Whereas coastal areas in south Ecuador and northern Peru suffer from heavy precipitation and asso-ciated flooding events, the Amazon Basin is known to have
Correspondence to: R. Rollenbeck
(rollenbe@staff.uni-marburg.de)
prolonged dryness, as was observed especially in 1998 (Rol-lenbeck, 2002). The transition zone between these two dif-fering patterns is formed by the Andean Cordillera, which in large parts of South America is formed by two more or less parallel mountain chains. In the region of Loja, this to-pograpic scheme is modified; here, a distinct depression in the average altitude of the chains is observable and the reg-ular structure is interrupted by many perpendicreg-ular valleys cutting deeply into the Cordillera. Hence, this region also acts as a natural connection between the humid Amazon low-lands and the semi-arid to arid coastal areas.
The PREDICT project was implemented to determine lo-cal variability and processes leading to the extreme hetero-geneity of precipitation input in tropical mountain forests. As is well known, strong altitudinal gradients exist in these ecosystems (Weischet, 1969; Bruijnzeel, 2000). But there are several other factors affecting the formation of spatial differences of precipitation, such as exposition of mountain chains to prevailing winds, variations of cloud condensation level and of course many dynamic processes like local wind phenomena as foehn (dry leeward winds) and the mass eleva-tion effect. To understand the interaceleva-tion of these processes, a combination of local observation points and remote sensing is needed.
2 Methods
The central research area of the project is located some 15 km east of the provincial capital of Loja, on the eastern slope of the Cordillera Real, the main ridge of the Andes in this region. Here, conventional climate stations are operated in a dense network and with high temporal resolution (Fig. 1, right). This enables the precise assessment of important vari-ables like altitudinal gradients of rain and fog precipitation as well as cloud levels. Also, the input of inorganic chemi-cal compunds through precipitation is analysed, to determine contributions to the local nutrient balance (Rollenbeck et al., 2004).
74 R. Rollenbeck et al.: Precipitation dynamics and chemical properties
Fig. 1. 3-D-View of the study region in the south of Ecuador and the central research area. The white trangles show the position of rain and
fog sampling sites.
Additionally, the project makes intensive use of NOAA-AVHRR (Advanced very high resolution radiometer) satellite imagery and has adopted a cloud detection scheme to determine frequency and distribution of cloudiness for all of Ecuador. Furthermore variables like cloud top-altitude and liquid-water path can be derived (Bendix et al. 2004).
Results
The data obtained so far, indicate a clear seasonal variation of precipitation input for the wider study region. Main rainy season is from April to August, whereas a secondary less pronounced peak occurs in some years in December. Radar-derived rain distributions show that this seasonality is different for the eastern and western half of the region. Fig. 2 shows monthly totals of rainfall for the whole range covered by the radar (s. Fig.1, left). The eastern half of the circle consists of the very humid eastern andean slope, with high rainfall in almost all months. In the western half the rainy season observed in the central study area, is replaced by a bimodal pattern, showing pronounced dryness in July to September.
Fig. 2: Rainfall distribution within the study region (120x120km) derived from radar data for the years 2002 and 2003. The triangle marks the location of the provincial capital Loja.
The altitudinal gradients show details of the seasonality within the central research area. The lower parts show the previously mentioned peak in June-July, while the upper parts above 2600 m have maximum rain fall earlier in April to May (Fig. 3). A secondary maximum can
10 50 100 200 300 400 >500
wet season May-June dryseason July-Sept. transitional Oct.-Feb.
average monthly rain total [mm]
Fig. 2. Rainfall distribution within the study region (120×120 km)
derived from radar data for the years 2002 and 2003. The triangle marks the location of the provincial capital Loja.
To complement this detailed analysis, a weather radar is installed at the highest peak of the study area, covering a range of 60 km and giving five-minute totals of the rain distri-bution in the wider study region, with a pixelwidth of 500 m (Rollenbeck and Bendix, 2004). This enables the analy-sis of regional rain generating processes, because the whole zone from the humid eastern lowlands via the highest andean peaks to the western coastal hills is covered (see Fig. 1, left). Additionally, the project makes intensive use of NOAA-AVHRR (Advanced very high resolution radiometer) satel-lite imagery and has adopted a cloud detection scheme to determine frequency and distribution of cloudiness for all of Ecuador. Furthermore variables like cloud top-altitude and liquid-water path can be derived (Bendix et al., 2004).
be observed at least for the highest station in November. The right panel in Fig. 3 shows the potential input of fog and winddriven rain, which is registered by mesh collectors of 1 m² at the climate stations (s. also Fig. 1 right). Maximum input is observed in July and August, when highest wind speeds are measured.
The altitudinal gradient is non-linear for both precipitation types. On average it increases by 230 mm/100 m for rain and 240 mm/100 m for fog. But the highest increase is always observed in the higher portions of the study site, between 2600 and 3200 m. This coincides with the visually observed condensation level of 2700 to 3100 m.
Fig. 3: Height/time section of monthly totals of rain and fog/horizontal rain in the central research area.
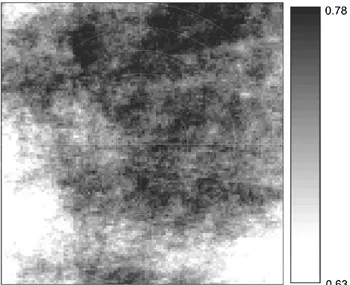
The rainfall distribution observed (Fig. 2) is also represented in the horizontal extent of cloudiness. Analysis of 2 years of almost daily satellite images from the AVHRR sensor enabled us to calculate cloud frequency for the region covered by the weather radar. Fig. 4 shows the relative values of cloudiness. The barrage effect of the main andean chain is clearly visible, as well as the low cloudiness due to “foehn”-effects in the valleys southwest of the highest ridges. A modification of this pattern is very probable, if El Niño affects the regional atmospheric flows. 1800 2000 2200 2400 2600 2800 3000 3200 03 06 09 12 03 06 09 12 10 0 150 200 250 030 350 400 450 500
RAIN HORIZONTAL RAINFOG/
A ltitu de [m asl] Month Month Precipitation [mm]
Fig. 3. Height/time section of monthly totals of rain and fog/horizontal rain in the central research area.
Fig. 4. Relative cloud frequency derived from satellite images (NOAA-AVHRR) for the study region. Range circles for every 10 km of distance from the radar location are shown.
R. Rollenbeck et al.: Precipitation dynamics and chemical properties 75
generalized flow patterns for the regions. By overlaying these data with maps of
biomassburning, a strong evidence resulted, that the immissions are caused by heavy forest
fires, which are mainly located in Brazil (Fabian et al. 2005) (see Fig. 6). But natural sources
play a role too: High loads in November 2002 could be explained by airmasses that passed the
recently erupted volcanoe El Reventador.
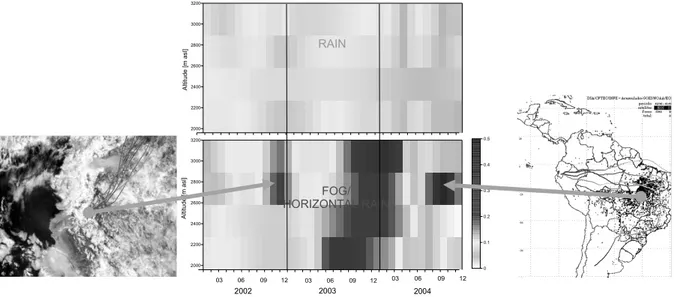
Fig. 5: Altitudinal variations 2002-2004 of ionic load in rain and fog water as observed in the central research area. Sources end evidence by backward trajectories is shown for two peak-input episodes. Left: Eruption of El Reventador (3. Nov. 2002), right, Firepixels in Sept. 2004 as detected by NOAA and GOES satellites (INPE, Brasil) and time synchronous trajectories.
Conclusions
Regional climate variability in the southern ecuadorian Andes is mainly controlled by
topograpic variables, climatological processes and the interaction of both. This kind of
dynamics can not be detected by the conventional station network, which neither has the
required density nor the capability to observe dynamic processes. Although in the last few
years since 1999 no strong deviations from normal ENSO-conditions could be observed, yet
this study may help to assess the potential impact of larger-scale oscillations like El Niño on
terrestrial ecosystems in the south of Ecuador, because it is situated at the pivotal point
between two opposing impacts of this climatic oscillation. Furthermore, identification of
nutrient inputs and variations in the nutrient balance may result in a broader understanding of
the ecosystem impact, because not only rainfall is affected, but also other consequences of
atmospheric oscillations are probable.
2000 2200 2400 2600 2800 3000 3200 2000 2200 2400 2600 2800 3000 3200 0 0.1 0.2 0.3 0.4 0.5 A ltitu de [m a sl] A ltit ud e [m a sl] RAIN FOG/ HORIZONTAL RAIN 2002 2003 2004 03 06 09 12 03 06 09 12 03 06 09 12
Fig. 5. Altitudinal variations 2002–2004 of ionic load in rain and fog water as observed in the central research area. Sources end evidence
by backward trajectories is shown for two peak-input episodes. Left: Eruption of El Reventador (3 November 2002), right, Firepixels in September 2004 as detected by NOAA and GOES satellites (INPE, Brasil) and time synchronous trajectories.
3 Results
The data obtained so far, indicate a clear seasonal variation of precipitation input for the wider study region. Main rainy season is from April to August, whereas a secondary less pronounced peak occurs in some years in December. Radar-derived rain distributions show that this seasonality is dif-ferent for the eastern and western half of the region. Fig. 2 shows monthly totals of rainfall for the whole range covered by the radar (Fig. 1, left). The eastern half of the circle con-sists of the very humid eastern andean slope, with high rain-fall in almost all months. In the western half the rainy season observed in the central study area, is replaced by a bimodal pattern, showing pronounced dryness in July to September.
The altitudinal gradients show details of the seasonality within the central research area. The lower parts show the previously mentioned peak in June–July, while the upper parts above 2600 m have maximum rain fall earlier in April to May (Fig. 3). A secondary maximum can be observed at least for the highest station in November. The right panel in Fig. 3 shows the potential input of fog and winddriven rain, which is registered by mesh collectors of 1 m2at the climate stations (also Fig. 1 right). Maximum input is observed in July and August, when highest wind speeds are measured.
The altitudinal gradient is non-linear for both precipitation types. On average it increases by 230 mm/100 m for rain and 240 mm/100 m for fog. But the highest increase is always observed in the higher portions of the study site, between 2600 and 3200 m. This coincides with the visually observed condensation level of 2700 to 3100 m.
The rainfall distribution observed (Fig. 2) is also repre-sented in the horizontal extent of cloudiness. Analysis of 2 years of almost daily satellite images from the AVHRR sen-sor enabled us to calculate cloud frequency for the region covered by the weather radar. Figure 4 shows the relative
values of cloudiness. The barrage effect of the main andean chain is clearly visible, as well as the low cloudiness due to “foehn”-effects in the valleys southwest of the highest ridges. A modification of this pattern is very probable, if El Ni˜no af-fects the regional atmospheric flows.
As rainfall is the most important source for input of in-organic nutrients in the ecosystem of tropical mountain for-est, this study and the wealth of data was also used to as-sess the atmospheric contribution to the local nutrient bal-ance. Hence, all precipitation samplers are also used to take weekly water samples, that are subsequently analysed for the major ions, as there are: Na+, K+, NH+4, Mg2+, Ca2+, Cl-, NO−3, SO2−4 and PO34. In general, atmospheric input is low, but some episodic events show concentrations, that were un-known for tropical environments and may reach levels only observed in industrialized countries. This applies especially for S- and N- species, but also Ca and Na, sometimes show unusal high levels. To find out if there are regular phenom-ena controlling these inputs, the altitudinal gradient was in-vestigated for seasonal variations (Fig. 5). Though the to-tal ionic load exhibits some interannual variations, a distinct seasonal pattern is not recognizable. The episodic events are centered at different times of the year and also occur in different altitudes. This holds especially true for the con-centrations in fogwater. To determine possible sources for these elevated concentrations, we used backward-trajectories (Stohl and Trickl, 1999) to determine generalized flow pat-terns for the regions. By overlaying these data with maps of biomassburning, a strong evidence resulted, that the im-missions are caused by heavy forest fires, which are mainly located in Brazil (Fabian et al., 2005) (see Fig. 6). But natural sources play a role too: High loads in November 2002 could be explained by airmasses that passed the recently erupted volcanoe El Reventador.
76 R. Rollenbeck et al.: Precipitation dynamics and chemical properties
4 Conclusions
Regional climate variability in the southern ecuadorian An-des is mainly controlled by topograpic variables, climatolog-ical processes and the interaction of both. This kind of dy-namics can not be detected by the conventional station net-work, which neither has the required density nor the capabil-ity to observe dynamic processes. Although in the last few years since 1999 no strong deviations from normal ENSO-conditions could be observed, yet this study may help to as-sess the potential impact of larger-scale oscillations like El Ni˜no on terrestrial ecosystems in the south of Ecuador, be-cause it is situated at the pivotal point between two opposing impacts of this climatic oscillation. Furthermore, identifica-tion of nutrient inputs and variaidentifica-tions in the nutrient balance may result in a broader understanding of the ecosystem im-pact, because not only rainfall is affected, but also other con-sequences of atmospheric oscillations are probable.
The study will be continued until 2009 and will probably be able to monitor larger variations of ENSO in the coming years.
Edited by: P. Fabian and J. L. Santos Reviewed by: two anonymous referees
References
Bendix, J.: Precipitation Dynamics in Ecuador and Northern Peru during the 1991/92 El Ni˜no- a remote sensing perspective, Int. J. Rem. Sens. H., 21, 533–548, 1999.
Bendix, J., Rollenbeck, R., and Palacios, E.: Cloud classification in the Tropics – a suitable tool for climateecologicalstudies in the high mountains of Ecuador, Int. J. Rem. Sens., 25, 21, 4521– 4540, 2004.
Bruijnzeel, L. A.: Hydrology of tropical montane cloud forests: A Reassessment, Land Use and Water Resources Research, 1, 1.1– 1.18, 2000.
Fabian P., Kohlpaintner M., and Rollenbeck, R.: Biomass burning in the Amazon – fertilizer for the mountaineous rain forest in Ecuador, Environm. Sci. Pollut. Res., 12, 5, 290–296, 2005. Rollenbeck, R.: Wasser- und Energiehaushalt eines neotropischen
Tieflandregenwalds, Mannh. Geogr. Arb., 55, 173 pp., 2002. Rollenbeck, R., Bendix, J., Fabian, P.: Spatial and temporal
dynam-ics of atmospheric water- and nutrient inputs in tropical mountain forests of southern Ecuador, Proceedings of the 2nd Int. Con-ference on tropical montane cloud forests, Waimea, Hawaii, in press, 2004.
Rollenbeck, R. and Bendix, J.: Experimental calibration of a cost-effective X-band weather radar for climate-ecological studies in southern Ecuador, Atmos. Res., in press, 2004.
Weischet, W.: Klimatologische Regeln zur Vertikalverteilung der Niederschl¨age in Tropengebirgen, Die Erde 100 Jg. H., 2–4, 287–310, 1969.