HAL Id: hal-00298828
https://hal.archives-ouvertes.fr/hal-00298828
Submitted on 23 Apr 2007HAL is a multi-disciplinary open access
archive for the deposit and dissemination of sci-entific research documents, whether they are pub-lished or not. The documents may come from teaching and research institutions in France or abroad, or from public or private research centers.
L’archive ouverte pluridisciplinaire HAL, est destinée au dépôt et à la diffusion de documents scientifiques de niveau recherche, publiés ou non, émanant des établissements d’enseignement et de recherche français ou étrangers, des laboratoires publics ou privés.
Prediction of runoff and discharge in the Simiyu River
(tributary of Lake Victoria, Tanzania) using the WetSpa
model
J. Rwetabula, F. de Smedt, M. Rebhun
To cite this version:
J. Rwetabula, F. de Smedt, M. Rebhun. Prediction of runoff and discharge in the Simiyu River (tributary of Lake Victoria, Tanzania) using the WetSpa model. Hydrology and Earth System Sciences Discussions, European Geosciences Union, 2007, 4 (2), pp.881-908. �hal-00298828�
HESSD
4, 881–908, 2007Prediction of runoff in the Simiyu River,
Tanzania using WetSpa J. Rwetabula et al. Title Page Abstract Introduction Conclusions References Tables Figures ◭ ◮ ◭ ◮ Back Close
Full Screen / Esc
Printer-friendly Version Interactive Discussion
Hydrol. Earth Syst. Sci. Discuss., 4, 881–908, 2007 www.hydrol-earth-syst-sci-discuss.net/4/881/2007/ © Author(s) 2007. This work is licensed
under a Creative Commons License.
Hydrology and Earth System Sciences Discussions
Papers published in Hydrology and Earth System Sciences Discussions are under open-access review for the journal Hydrology and Earth System Sciences
Prediction of runoff and discharge in the
Simiyu River (tributary of Lake Victoria,
Tanzania) using the WetSpa model
J. Rwetabula1, F. De Smedt1, and M. Rebhun2 1
Department of Hydrology and Hydraulic Engineering, Vrije University Brussel, Pleinlaan 2b, 1050, Brussels, Belgium
2
Environmental and Water Resources Engineering, Technion – Israel Institute of Technology, 32000 Haifa, Israel
Received: 18 January 2007 – Accepted: 18 February 2007 – Published: 23 April 2007 Correspondence to: J. Rwetabula (jrwetabu@vub.ac.be)
HESSD
4, 881–908, 2007Prediction of runoff in the Simiyu River,
Tanzania using WetSpa J. Rwetabula et al. Title Page Abstract Introduction Conclusions References Tables Figures ◭ ◮ ◭ ◮ Back Close
Full Screen / Esc
Printer-friendly Version Interactive Discussion
Abstract
A spatially distributed hydrologic model (WetSpa) is used to estimate daily river wa-ter discharge in the Simiyu river a tributary of Lake Victoria, Tanzania. The model combines topography, landuse and soil maps, and observed daily meteorological time series to predict discharge hydrographs and the spatial distribution of hydrological pa-5
rameters in the catchment. The elevations in the catchment range from 2000 to 1100 m at the outlet, with average slope of 1.4%. The dominant landuse types are, wasteland, grassland, bushland, cultivated land, and a very small area is covered by surface water. The dominant soil types are sandy loam, followed by sandy clay loam, clay loam, clay, loam and sandy clay. There are two distinctive seasons in the Simiyu catchment. Short 10
rains mainly in November, December and January, and long rains in March to May, re-sulting in a total average annual precipitation of 700 to 1000 mm. The annual potential evapotranspiration is about 1300 mm, and the river discharge at the catchment out-let ranges from 0 to about 200 m3/s. Global parameters of the model are calibrated using three years of daily observed discharge values measured at the mouth of the 15
river at Lake Victoria. The estimated average travel time of the runoff to the outlet of the catchment is about 2.4 d and maximum 8 d for the most remote areas. The model results also show that the surface runoff and interflow provide respectively 38.6% and 61.4% of the total runoff, while the contribution of groundwater drainage is nil. The absence of groundwater drainage is probably due to the high evaporation demand of 20
the atmosphere, which accounts for about 90% of the total precipitation being lost by evapotranspiration. The annual water balance estimated with the model reveals that the total outflow to Lake Victoria is about 500×106m3per year, which occurs mainly in the wet seasons, i.e. from March to May and from November to January. The volume of runoff produced by agricultural land amounts to about 9% of the total runoff annually. 25
HESSD
4, 881–908, 2007Prediction of runoff in the Simiyu River,
Tanzania using WetSpa J. Rwetabula et al. Title Page Abstract Introduction Conclusions References Tables Figures ◭ ◮ ◭ ◮ Back Close
Full Screen / Esc
Printer-friendly Version Interactive Discussion
1 Introduction
Lake Victoria is the largest freshwater lake in Africa, and one of the major sub-basins within the Nile basin sharing its resources with Tanzania, Kenya and Uganda (Ningu, 2000; Phoon et al., 2004). The water quality of Lake Victoria has been declining due to point and non-point pollution sources from domestic, industrial and agricultural activi-5
ties. Pollution from agricultural activities is mainly fertilizers and pesticides (Scheren et al., 2000). To avoid such problems and environmental concern, the riparian countries established the Lake Victoria Environmental Management Project (LVEMP), a World Bank Funded Project, which became operational in 1997, aiming at rehabilitation of the degraded lake ecosystem.
10
The main processes affecting the fate of pollutants include, surface runoff, erosion and sediment transport, and chemical, biological and biochemical interactions within the soil-plant-water system. The hydrologic cycle has an especially prominent role in the functioning of these processes. This means that the task of quantifying, or mod-elling pollutant loads must include consideration of hydrology, water and soil chemistry, 15
micro-and macro-biology, and many other disciplines (Jolankai et al., 1999).
Tanzanian river basins polluting Lake Victoria are mainly Mara, Kagera, and Simiyu (Crul, 1995). The Simiyu catchment is considered to be one of the main contributors to the deterioration of Lake Victoria, because it is relatively large (10 800 km2), with many agricultural activities using agrochemicals (Ningu, 2000), and generating high 20
yields of sediments (Lugomela and Machiwa, 2002). Pollution transport of the Simiyu river to Lake Victoria is clearly associated with seasonal river flow patterns. Higher chemical concentrations appear during high flows indicating that the gross amount of contaminants is released from agricultural fields during storm events (Lugomela and Machiwa, 2002; Henry and Kishimba, 2003; Rwetabula et al., 2006). Chemicals 25
are mainly transported by surface runoff in dissolved or particulate form. Hence, a proper water quality management cannot be initiated without a clear understanding of the hydrological processes in the Simiyu river basin. Therefore, models capable
HESSD
4, 881–908, 2007Prediction of runoff in the Simiyu River,
Tanzania using WetSpa J. Rwetabula et al. Title Page Abstract Introduction Conclusions References Tables Figures ◭ ◮ ◭ ◮ Back Close
Full Screen / Esc
Printer-friendly Version Interactive Discussion
of predicting flow and water quality, are needed to study the hydrologic behaviour of the catchment and to predict effects of land use and waste management for decision making.
In this study, a modelling approach is described using remote sensed data, GIS and a hydrological model to predict the Simiyu river discharge and the hydrological char-5
acteristics of the catchment. The hydrological model WetSpa was originally developed by Wang et al. (1996) and adopted for flood prediction by De Smedt et al. (2000) and Liu and De Smedt (2004a). It has been applied in tropical environments by Liu et al. (2005), for analyzing the effects of climate changes on stream flow by Gebremeskel et al. (2005), and for prediction of phosphorous transport by Liu et al. (2006). Until 10
now, it has not been tested in an ephemeral/intermittent river environment. The model is simple to use, needs very limited input parameters, and generally performs well in reproducing river discharges (Liu and De Smedt, 2004a; Bahremand et al., 2005). The results of the model together with contaminant concentrations will be useful to chemical loads generated from the Simiyu catchment and finally deposited in Lake Victoria. 15
2 Materials and methods
2.1 WetSpa model (theory)
The WetSpa model is a grid-based distributed hydrological model for predicting the wa-ter and energy transfer between soil, plants and atmosphere on regional or basin scale as proposed by Wang et al. (1996), and further applied by many researchers for flood 20
prediction and stream flow simulations (De Smedt et al., 2000, 2004; Liu et al., 2002; Liu and De Smedt, 2004b; Bahremand et al., 2005). Hydrological processes consid-ered in the model are precipitation, interception, depression storage, surface runoff, infiltration, evapotranspiration, percolation, interflow, groundwater flow, and water bal-ance in the root zone and the saturated zone. The detailed procedure of running the 25
model and parameters selection is explained in the user manual (Liu and De Smedt, 884
HESSD
4, 881–908, 2007Prediction of runoff in the Simiyu River,
Tanzania using WetSpa J. Rwetabula et al. Title Page Abstract Introduction Conclusions References Tables Figures ◭ ◮ ◭ ◮ Back Close
Full Screen / Esc
Printer-friendly Version Interactive Discussion
2004a).
The water balance in the root zone is important, because soil wetness is a key factor controlling the amount of surface runoff, interflow and groundwater recharge. The water balance for each grid cell in the root zone is computed as:
D∆θ
∆t = P − I − S − E − F − R (1)
5
where:D=root depth [L], ∆θ=change in soil moisture content [L3L−3
], ∆t=time interval [T],P =precipitation [LT−1], I=initial abstraction including interception and depression
storage [LT−1], S=surface runoff [LT−1], E =evapotranspiration [LT−1], F =amount of
interflow [LT−1], andR=percolation to groundwater [LT−1].
Interception depends on storm intensity and, vegetation characteristics, and depres-10
sion storage is controlled by slope, soil type, and landuse. Water loss by interception is returned to the atmosphere through evaporation, while water held in depressions either evaporates or contributes afterwards to infiltration. The remaining rainfall is separated into runoff and infiltration depending on landcover, soil type, slope, and antecedent moisture content of the soil. The infiltrated part of the rainfall may contribute to soil 15
moisture in the root zone, move laterally as interflow, or percolate further down as groundwater recharge depending on the water holding capacity of the soil. Evaporation from the soil and transpiration from vegetation is regulated by the evapotranspiration demand of the atmosphere, soil and plant characteristics, and soil wetness.
The surface runoff is computed by using a moisture related runoff coefficient method 20
S = cr(P − I)(θ/θs)α (2)
where: θs=saturated soil moisture content [L3L−3], c
r=potential runoff coefficient [–] depending on slope, landuse and soil type, andα=empirical parameter [–]. Exponent α [–] in the formula is a variable reflecting the effect of rainfall intensity on runoff
gen-eration. The value is higher for low rainfall intensities resulting in less surface runoff, 25
and approaches 1 for high rainfall intensities. Potential runoff coefficients were col-lected and compiled from literature (Dunne, 1978; Chow et al., 1988; Browne, 1990;
HESSD
4, 881–908, 2007Prediction of runoff in the Simiyu River,
Tanzania using WetSpa J. Rwetabula et al. Title Page Abstract Introduction Conclusions References Tables Figures ◭ ◮ ◭ ◮ Back Close
Full Screen / Esc
Printer-friendly Version Interactive Discussion
Mallants and Feyen, 1990) and linked to slope, soil type and landuse classes using lookup tables (Liu and De Smedt, 2004a). Evapotranspiration from soil and vegetation is calculated using the relationship developed by Thornwaite and Mather (1955) as a function of potential evapotranspiration, vegetation type, stage of growth, and soil mois-ture content (Liu et al., 2002). Actual evapotranspiration is computed as a fraction of 5
potential evapotranspiration in function of landuse and soil type. A portion of the tran-spiration is taken from the groundwater storage. Finally, the total evapotrantran-spiration is calculated as the sum of evaporation from interception storage, depression storage and evapotranspiration from soil and groundwater storage.
Interflow and percolation are assumed to be gravity driven as suggested by Famigli-10
etti and Wood (1994), and are supposed to occur when the soil moisture is higher than field capacity, in function of hydraulic conductivity, moisture content, slope angle, and root depth. Groundwater flow is estimated using a simplified lumped linear reservoir on small GIS derived sub-basin scale, while a non-linear relationship between ground-water flow and groundground-water storage is optional in the model (Wittenberg 1999; Liu and 15
De Smedt, 2004a).
The surface runoff generated according to Eq. (2) is rooted from each location to the basin outlet by the diffusive waveform approximation of the St. Venant equation, used in the model to simulate both overland flow and channel flow:
∂Q ∂t = D ∂2Q ∂x2 − C ∂Q ∂x (3) 20
where: Q=discharge at location x and time t [L3T−1],
x=distance along the flow path
[L],C=wave celerity [LT−1], andD=dissipation coefficient [L2T−1]. The wave celerityC
and dissipation coefficient D depend on flow velocity, flow depth, and terrain character-istics. The flow velocityv [LT−1], is computed using the Manning equation:
v = 1 nR
2/3S1/2
o (4)
25
where: R=hydraulic radius [L], n=Manning roughness coefficient [L−1/3T], and
HESSD
4, 881–908, 2007Prediction of runoff in the Simiyu River,
Tanzania using WetSpa J. Rwetabula et al. Title Page Abstract Introduction Conclusions References Tables Figures ◭ ◮ ◭ ◮ Back Close
Full Screen / Esc
Printer-friendly Version Interactive Discussion
S0=surface slope [LL−1]. The celerity C of the diffusion wave is given as (5/3)v and
the dissipation coefficient D as vR/2So (Henderson, 1996). Under the assumption that the hydraulic radius is a static terrain characteristic that does not change during a flood event, it follows thatC and D only depend upon position and can be determined
from basic landuse and soil data. An approximate solution of Eq. (3), in the form of an 5
instantaneous unit hydrograph (IUH), relating the discharge at the end of flow path to the available runoff at any upstream location is given as (De Smedt et al., 2000; Liu et al, 2003): U(t) = 1 σq2πt3/t3 0 exp " − (t − t0) 2 2σ2t/t 0 # (5) and 10 Q(t) = Z A Zt 0 (P − I) (τ) U (t − τ) dτdA (6)
where: U(t)=flow path unit response function [T−1] which routes excess water from
any grid cell to the basin outlet or any downstream convergent point,to=average travel time to the outlet along the flow path [T], σ=standard deviation of the flow time [T], Q(t)=outlet flow hydrograph [L3T−1], τ=time delay [T], A=drainage area of the
wa-15
tershed [L2]. Parameters to and σ are spatially distributed and can be obtained by integration along the topographical determined flow paths as a function of flow celerity
C and dissipation coefficient D as suggested by De Smedt et al. (2000): to= Z C−1dx (7) and 20 σ = s Z 2DC−3dx (8) 887
HESSD
4, 881–908, 2007Prediction of runoff in the Simiyu River,
Tanzania using WetSpa J. Rwetabula et al. Title Page Abstract Introduction Conclusions References Tables Figures ◭ ◮ ◭ ◮ Back Close
Full Screen / Esc
Printer-friendly Version Interactive Discussion
Hence, the flow routing involves tracking of surface runoff and interflow along its topo-graphic determined flow path, such that a response function is obtained for every grid cell to the catchment outlet or any other downstream convergence point. The routing response serves as an instantaneous unit hydrograph and the total discharge is ob-tained by convolution of the flow response from all grid cells using Eqs. (5) and (6). 5
The total river discharge at the downstream convergence point is obtained by superim-posing all contributions from every grid cell, and the groundwater outflow generated in each subcatchment.
The main inputs to the model are digital data of elevation, soil type, and landuse in raster format, and observed time series of precipitation and potential evapotranspira-10
tion. Observed river discharge time series are optional for model calibration. The basic output parameters of the model are the predicted hydrographs at the catchment outlet or at any selected subcatchment outlet. Other outputs are spatial distributions of the simulated hydrological parameters in the form of GIS maps.
2.2 The Simiyu catchment and field data collection 15
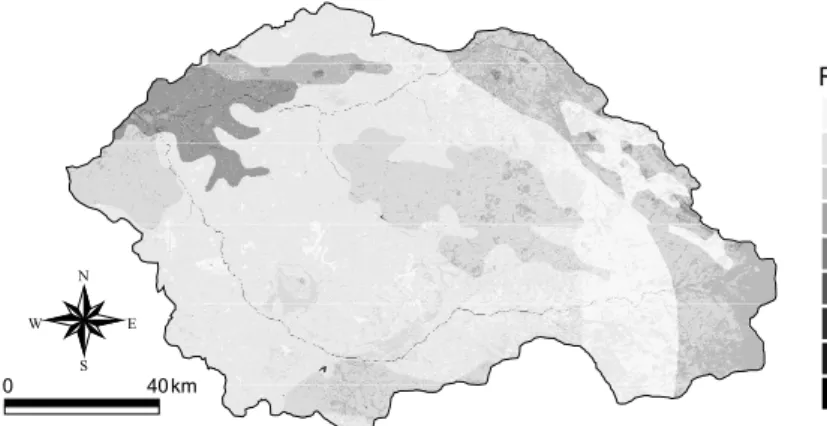
The Simiyu catchment is located in the southeast of Lake Victoria Tanzania (Fig. 1) and covers an area of about 10 800 km2. The topography is generally flat with small undulating hills. The elevation in the catchment ranges from maximum 2000 m to mini-mum 1100 m at the outlet, with an average slope of about 1.4%. Digital elevation data (DEM) were obtained from topographical maps on scale 1:50 000. A soil map was 20
developed using field reconnaissance and information from literature (Meertens et al., 1996; FAO, 2002). The landuse map was obtained from satellite images (Landsat 7 ETM+) of 2001, with a resolution of 28.5 m, using Idrisi32 release 2 image process-ing software and trainprocess-ing sites for supervised classification method (Rwetabula and De Smedt, 2005). All GIS data is raster based with a 100 m grid size. Figures 2, 3, and 4 25
show the topographic elevation map of the Simiyu catchment, the spatial distribution of the different land uses, and the soil texture. The dominant landuse types are wasteland (mixed bare land and short grasses) (46.5%), grassland (25.5%), bushland (19.7%),
HESSD
4, 881–908, 2007Prediction of runoff in the Simiyu River,
Tanzania using WetSpa J. Rwetabula et al. Title Page Abstract Introduction Conclusions References Tables Figures ◭ ◮ ◭ ◮ Back Close
Full Screen / Esc
Printer-friendly Version Interactive Discussion
and cultivated land (8.3%), while a very small (less than 1%) area is covered by sur-face water. The Serengeti national park/game reserve covers the upstream part of the catchment in the east and is dominated by dense grassland and bushland. The domi-nant soil types are sandy loam (63.8%), sandy clay loam (13.5%), clay loam (12.9%), clay (5%), loam (2.9%), and sandy clay (1.9%).
5
The catchment has a warm tropical savannah climate with an average temperature of about 23◦C. Five and half years of climatological observations from January 1999 to
May 2004, at three stations located in or near the Simiyu catchment, show distinctive wet and dry seasons. The wet season is characterized by short rains mainly in Novem-ber, December and January, and by long rains from March to May. The total average 10
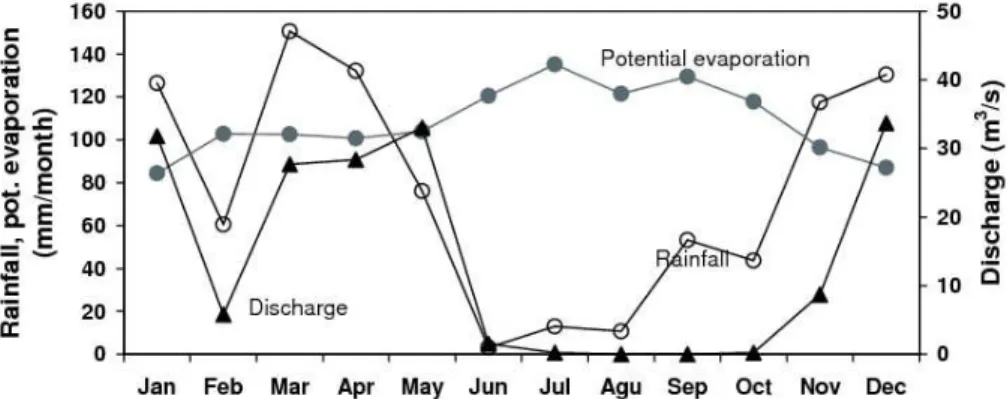
annual precipitation varies between 700 and 1000 mm, of which 39% occurs in the long rain season from March to May, 41% in the short rain season from November to January, and 20% for the rest of the months. Figure 5 shows the monthly variation of rainfall, potential evapotranspiration and average monthly discharge at the catchment outlet of the Simiyu river. The monthly potential evapotranspiration in the catchment as 15
derived from pan evaporation data (FAO, 1997) ranges from about 80 mm in the short rain season to 140 mm in the dry season, yielding a total annual potential evaporatran-spiration of about 1300 mm.
No discharge measurements have been performed by the authorities although river water levels have been recorded regularly since 1999. For this study water levels 20
were recorded daily from 2001 to 2004 and river discharge measurements were mea-sured regularly using calibrated current meters i.e. type A OTT propeller V-Arkansas and Global Water Flow Probe FP101. Daily discharge values were estimated from the recorded water level readings, which were converted to discharge values using rat-ing curves as described in literature (Shaw, 1988; Chow et al., 1988). Float method 25
discharge measurements were used to cross-check discharge measurements as de-scribed by Wanielista et al. (1997). The average monthly discharge ranges from zero to about 34 m3/s. Minimum or no discharge appears in the dry season mainly in June to October. In general, discharges of about 30 m3/s on average are recorded in the rain
HESSD
4, 881–908, 2007Prediction of runoff in the Simiyu River,
Tanzania using WetSpa J. Rwetabula et al. Title Page Abstract Introduction Conclusions References Tables Figures ◭ ◮ ◭ ◮ Back Close
Full Screen / Esc
Printer-friendly Version Interactive Discussion
seasons.
3 Model application
3.1 Model input parameters
Model parameters are automatically derived from the topography, soil and landuse maps using lookup tables. From the DEM, hydrological features as surface slope, 5
flow direction, flow accumulation, stream network, stream order and sub-catchments are delineated. The threshold for delineating the stream network is set to 100 pixels, meaning that a cell is considered being drained by a stream when the upstream drained area becomes greater than 1 km2. The threshold value for determining subcatchments is set to 3000 pixels or 30 km2, by which 199 sub-catchments are identified with an av-10
erage sub-catchment area of about 54.3 km2. The calculated catchment slope ranges from very flat areas (ponds, reservoirs, etc.) to maximum 35.5% for very steep slopes. Soil hydraulic conductivity, porosity, field capacity, residual moisture, pore size distribu-tion index, and plant wilting point for each grid cell are derived from the soil map. The interception storage capacity and root depth parameters are derived from the landuse 15
map. The stream network and hydraulic radius are derived from the DEM. The aver-age hydraulic radius varies between 0.005 m for runoff areas and is maximum 4.3 m at the outlet of the main river. The Manning roughness coefficient for both land surfaces and river channels is estimated based on landuse and stream order. The Manning coefficient for the river channels is linearly interpolated based on stream order with 20
0.075 m−1/3s for the lowest order and 0.035 m−1/3s for the highest order.
The potential runoff coefficient and depression storage capacity are calculated from the slope, soil type and landuse combinations. Figure 6 shows the distribution of the potential runoff coefficient. As the catchment is relatively flat, the potential runoff co-efficient is strongly influenced by soil type and landuse. Potential runoff coco-efficients 25
are higher in areas with clay soils and grass or bareland cover than in areas with 890
HESSD
4, 881–908, 2007Prediction of runoff in the Simiyu River,
Tanzania using WetSpa J. Rwetabula et al. Title Page Abstract Introduction Conclusions References Tables Figures ◭ ◮ ◭ ◮ Back Close
Full Screen / Esc
Printer-friendly Version Interactive Discussion
sandy loam soils and bush. Obviously higher potential runoff coefficients observed in areas covered by clay soil can be related to low infiltration capacity of clay soils (Wanielista et al., 1997). The average potential runoff coefficient of the Simiyu catch-ment is about 0.28, which is a typical value for a relative flat area with mixed cultivated or pasture/range land (Chow et al., 1988).
5
The maps of precipitation, temperature, and potential evapotranspiration are created based on the geographical locations of each measuring station and the catchment boundary using the Thiessen polygon method. Maps of flow velocity and mean and standard deviation of the travel time to the basin outlet are generated, by which the IUH of each grid cell to the basin outlet can be calculated. Figure 7 shows the esti-10
mated average travel time to the basin outlet. The travel time is 2.4 d on average and maximum about 8 d for the most remote areas in the Serengeti game reserve.
3.2 Model calibration
The WetSpa model is run using the observed rainfall and potential evapotranspiration time series, and calibrated against the daily stream flow measurements at the catch-15
ment outlet for the time period from June 2001 to May 2004. Calibration is done by incorporating a model independent parameter estimator PEST (Doherty and Johnston, 2003). In this automated calibration procedure, the best set of parameters is selected from within a reasonable range, by adjusting values until the discrepancies between observed and simulated hydrographs is reduced to a minimum in the weighted least 20
squares sense. Prior to the automated calibration, investigation of parameter sensitivity is performed and the automated calibration is applied focusing only on the most sensi-tive parameters of the WetSpa model (Liu and De Smedt, 2004a; Bahremand and De Smedt, 2006), i.e. baseflow recession constant, initial soil moisture, interflow scaling factor, evapotranspiration correction factor, and surface runoff parameters (runoff expo-25
nent and maximum rainfall intensity). The snowmelt parameters are not involved in the calibration process as the corresponding processes are irrelevant in the Simiyu catch-ment. Also, spatial parameters and parameters in the lookup tables are not calibrated
HESSD
4, 881–908, 2007Prediction of runoff in the Simiyu River,
Tanzania using WetSpa J. Rwetabula et al. Title Page Abstract Introduction Conclusions References Tables Figures ◭ ◮ ◭ ◮ Back Close
Full Screen / Esc
Printer-friendly Version Interactive Discussion
and remain fixed as default values.
The optimization reveals that the baseflow recession coefficient is zero, and conse-quently the model predicts that there is no groundwater drainage to the Simiyu river. This corresponds to the actual situation as Simiyu river is ephemeral, with flows oc-curring only during the rainy season and no flow during prolonged dry periods. The 5
optimization also shows that the initial moisture content of the soils at the start of the simulation period is very small, which is again likely due to prolonged drought and high evaporative demand of the atmosphere. The interflow is found to be rather large what can be related to the soil types and the effect of vegetation especially in the up-stream part of the Simiyu catchment. Most soils in the Simiyu catchment are Planosols 10
(FAO, 2002), characterized by an alluvial horizon with loamy sand or coarser textures of which the lower boundary is marked within 100 cm from the surface by an abrupt tex-tural change to a less permeable subsoil with significantly more clay material than the surface horizon (FAO, 2002). This explains some of the special conditions in the Simiyu catchment. The sandy loam soils with a relative high permeability would normally pro-15
mote infiltration and groundwater recharge, but here the opposite is observed. The less permeable subsoils promote stagnant soil water and subsequent loss by evapo-transpiration and by interflow. This explains why precipitation easily infiltrates into the soils but does not lead to groundwater recharge, and why interflow becomes far higher than normally expected and groundwater storage and drainage are insignificant. 20
3.3 Model results and discussions
After calibration the model performance is verified for a larger period, because the dynamics of the hydrological processes in the basin can change significantly over long periods of time in response to the variability of the rainfall from year to year. Hence, keeping the same calibrated parameters, the model was used to simulate measured 25
discharges at the catchment outlet from January 1999 to May 2004. The simulated results are compared with daily observed discharge, both graphically and statistically. The predicted and observed hydrographs are presented in Fig. 8.
HESSD
4, 881–908, 2007Prediction of runoff in the Simiyu River,
Tanzania using WetSpa J. Rwetabula et al. Title Page Abstract Introduction Conclusions References Tables Figures ◭ ◮ ◭ ◮ Back Close
Full Screen / Esc
Printer-friendly Version Interactive Discussion
As can be seen in Fig. 8, river discharge, concentration time and flow volumes are accurately predicted. The maximum recorded peak rainfall intensity is about 48 mm/d and the corresponding maximum observed peak discharge is 208 m3/s. Generally, river discharges are well simulated suggesting that the model is able to capture the long-term dynamics of the river Simiyu reasonably. However, some peak discharges are 5
not well reproduced, possibly due to insufficient spatial distribution of rainfall gauging stations, that do not allow to capture accurately all local rain events in the 10 800 km2 catchment, and/or the daily water velocity at the catchment outlet that may not capture short term flush flows.
The necessary of precipitation gauging stations per unit area (precipitation gauge 10
density) is discussed by Shaw (1988) and Wanielista et al. (1997). The minimum den-sity of precipitation stations for flat areas as reported by Shaw (1988) ranges from 600 to 900 km2/gauge. Therefore at least ten stations are needed for a large catchment as the Simiyu river, while at present there are only three stations, of which only one is located inside the basin (Fig. 1). Also, the discharge estimated from the daily water 15
levels recording cannot capture all flow variations. Hourly or half hourly recordings are needed to accurately monitor flood hydrographs of short duration. A last source of error can be runoff retained by intermediate storage in the basin, a process that is not included in the WetSpa model.
Four hydrological model evaluation criteria are applied to asses the performance of 20
the model (Hoffmann et al., 2004; De Smedt et al., 2005): (1) model bias or aver-age error between observed and predicted discharge expressed as percentaver-age of the average observed discharge (2) model efficiency (Nash and Sutcliffe, 1970), i.e. the ratio of the variance of the model bias and the observed flows; (3) and (4) modified model efficiencies evaluating the ability of the model to reproduce low flows and high 25
flows respectively. The WetSpa model performance over the five years verification pe-riod excluding gaps of missing discharge observations are: a model bias of 2.4%, a model efficiency of 57.4 %, and an ability to reproduce low flows and high flows of 54.3% and 66.9% respectively. These results clearly indicate that the model performs
HESSD
4, 881–908, 2007Prediction of runoff in the Simiyu River,
Tanzania using WetSpa J. Rwetabula et al. Title Page Abstract Introduction Conclusions References Tables Figures ◭ ◮ ◭ ◮ Back Close
Full Screen / Esc
Printer-friendly Version Interactive Discussion
well, although in other studies (Liu et al., 2002; De Smedt et al., 2004) the WetSpa model performed better with a model efficiency in the order of 75 to 90%. The lower performance of the WetSpa model for the Simiyu catchment is evidently caused by in-sufficient data about the areal variation of rainfall and evapotranspiration and temporal variation of the discharge at the catchment outlet.
5
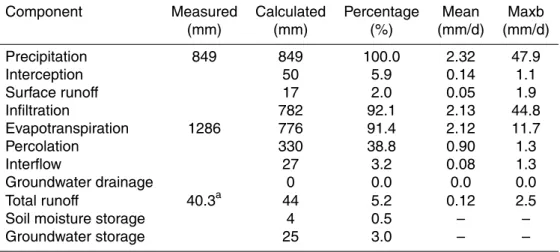
Table 1 shows the estimated mean annual water balance for the five year cycle (June 1999 to May 2004). The estimated amount of surface runoff, interception and infiltration for the verification period are 17, 50 and 782 mm, representing 2%, 5.9% and 92.1% of the total precipitation. Next, 42.2% of the infiltrated water percolates out of the root zone, 53.8% evaporates, and 3.5% becomes interflow. The sum of percolation, 10
soil evapotranspiration and interflow is not exactly equal to the infiltration, because the model predicts that there is a net increase of soil moisture storage over the 5 year period. This must clearly be a temporal effect because there cannot be a continuous increase in soil moisture storage. Inspection of the rainfall series reveals that the first two years (1999–2000) are rather dry, while the last three years (2001–2003) are rather 15
wet. Hence, after the dry years 1999 and 2000 the soil moisture storage has gradually been increasing during the wetter years 2001–2003 until this effect will be nullified by the occurrence of a dry period in the future. This also explains why there is a net increase in groundwater storage but no groundwater drainage to the Simiyu river. Evidently, due to prolonged dryness the groundwater storage was below drainage level 20
at the start of simulation period and in the wetter years 2001–2003 groundwater storage is gradually recovering but still does not reach the drainage level. Whether groundwater storage will ever reach a level where it might result in groundwater drainage to the river is questionable. Anyway, in this research no groundwater drainage was observed or predicted by the model in the Simiyu catchment.
25
The estimated annual surface runoff, interflow, and groundwater drainage are 17, 27 and 0 mm respectively. These represent 38.6%, and 61.4% and 0% of the total runoff. The large interflow may be due to the planosoils covering a large part of the catchment. The low groundwater recharge is probably due to the high evaporative
HESSD
4, 881–908, 2007Prediction of runoff in the Simiyu River,
Tanzania using WetSpa J. Rwetabula et al. Title Page Abstract Introduction Conclusions References Tables Figures ◭ ◮ ◭ ◮ Back Close
Full Screen / Esc
Printer-friendly Version Interactive Discussion
demand of the atmosphere. The model predicts that 91.4% of the total precipitation is lost by evapotranspiration, including loss due to interception, soil evaporation, and plant transpiration, and evaporation losses from the groundwater reservoir.
The total runoff contributed by each landuse type is obtained by integration of the surface runoff and interflow from each grid cell belonging to a particular land use type 5
within the catchment over the simulation period. Estimated average runoff volumes contributed by each landuse type are, 8.7% for cultivated land, 48.7% for wasteland (short grasses and bare land), 28.7% for grassland, 13.4% for bushland and 0.5% for surface water. The runoff volume originating from mixed short grasses and bare land is quite high because these occupy the largest portion of the catchment area (46.4%). 10
Actually, all runoff percentages are very similar to the area percentage covered by each landuse category in the catchment. Agricultural land which is the primary source for non-point pollution and degradation of Lake Victoria contributes for about 9% to the discharge of the Simiyu river. This corresponds to an annual volume of water of 500×106m3which may transport agrochemical residues to Lake Victoria.
15
4 Conclusion and recommendations
A spatially hydrologic simulation model (WetSpa) running on daily time scale is applied to the Simiyu river basin, a tributary of Lake Victoria, Tanzania. The model uses spatial elevation, landuse and soil data in GIS form, and observed climatological time series to predict the river discharge.
20
Prediction results show a reasonable agreement between measured and simulated discharge. The model performance over the five year verification period results in a model bias of 2.4%. The model efficiency for reproducing the river discharge is only 57.4%. This suggests that the WetSpa model can reasonably estimate annual water flows and associated hydrological characteristics of the Simiyu catchment, but less 25
accurately reproduces daily flows. This is mainly caused by insufficient information about the areal distribution of the rainfall and evapotranspiration, and the daily water
HESSD
4, 881–908, 2007Prediction of runoff in the Simiyu River,
Tanzania using WetSpa J. Rwetabula et al. Title Page Abstract Introduction Conclusions References Tables Figures ◭ ◮ ◭ ◮ Back Close
Full Screen / Esc
Printer-friendly Version Interactive Discussion
level recordings that cannot capture flush flows at the catchment outlet.
The average travel time of the runoff to the outlet of the Simiyu catchment is about 2.4 d and maximum is 8 d for the remote areas. The annual total flow to the Lake Victoria produced by the Simiyu river is about 500×106m3, of which 9% of the runoff volume is produced by agricultural land, and occurs mainly in the wet seasons, from 5
March to May and from November to January.
The estimated interflow is 61.4% of the total runoff, and there appears to be no drainage of groundwater. The high interflow may be are caused by planosols covering 63.8% of the catchment area. The zero groundwater drainage is probably due to the high evaporation demand of the atmosphere, which accounts for over 90% of the total 10
precipitation being lost by evapotranspiration.
The WetSpa model can be used to estimate the annual water balance of the Simiyu catchment. Such information can consequently be linked to water quality models to estimate contaminant loads generated from agricultural fields in the Simiyu catchment, which are transported and deposited to Lake Victoria. Also, the results of this study 15
can be used to simulate flows of ungauged sub-catchments to study the effects of topography, soil type and landuse on the hydrological behaviour.
Although the Simiyu catchment is relatively flat, there is a need for establishing more and sustainable climatological stations. Also more detailed river discharge measure-ments are needed, so that more accurate predictions become possible.
20
Acknowledgement. The authors acknowledge the Lake Victoria Environmental Management
World Bank Project (LVEMP) for the support of this research.
References
Bahremand, A., Corluy, J., Liu, Y., and De Smedt, F.: Stream flow simulation by WetSpa model in Hornad river basin, Slovakia, in: Floods, from Defence to Management edited by van
25
Alphen, J., van Beek, E., and Taal, M., Taylor-Francis Group, London, 67–74, 2005.
HESSD
4, 881–908, 2007Prediction of runoff in the Simiyu River,
Tanzania using WetSpa J. Rwetabula et al. Title Page Abstract Introduction Conclusions References Tables Figures ◭ ◮ ◭ ◮ Back Close
Full Screen / Esc
Printer-friendly Version Interactive Discussion
Bahremand, A. and De Smedt, F.: Sensitivity and uncertainty analysis of a GIS-based flood simulation model using PEST, WSEAS Transactions on environment and development, 2(1), 29–37, 2006.
Browne, F. X.: Stormwater management, in: Standard Handbook of Environmental Engineer-ing, edited by: Corbitt, R. A., McGraw-Hill, New York, 7.1–7.135, 1990.
5
Chow, V. T., Maidment, D. R., and Mays, L. W.: Applied hydrology, McGraw Hill Inc., New York, 1988.
Crul, R. C. M.: Limnology and hydrology of Lake Victoria: comprehensive and comparative study of great lakes, UNESCO/IHP – IV Project M-5.1, France, 1995.
De Smedt, F., Liu, Y. B., and Gebremeskel, S.: Hydrologic modeling on a catchment scale using
10
GIS, and remote sensed landuse information, in: Risk Analysis II, edited by: Brebbia, C. A., WTI press, Southampton, Boston, 3061–3078, 2000.
De Smedt, F., Liu, Y. B., Gebremeskel, S., Hoffmann, L., and Pfister, L.: Application of GIS and remote sensing in flood modelling for complex terrain: GIS and Remote Sensing in Hydrology, Water Resources and Environment, Proceedings of ICGRHWE held at the Three
15
Gorges Dam, China, September 2003, IAHS publ. 289, 23–32, 2004.
De Smedt, F., Liu, Y. B., and Gebremeskel, S.: Integrated modelling of hydrological processes on basin scale, in: Proceedings of contact forum conference “Geodesy and geophysics for the third millennium in Belgium 13 Oct 2005”, edited by: Arijs, E. and Ducarme, B., 51–67, 2005.
20
Doherty, J. and Johnston, J. M.: Methodologies for calibration and predictive analysis of a watershed model, J. Amer. Water Resour. Assoc., 39, 251–265, 2003.
Dunne, T.: Field studies of hill slope flow processes, in: Hills slope hydrology, edited by: Kirkby, M. J, John Wiley and Sons, 227–294, 1978.
FAO: Major soils of the world, Rome, Italy, on CD-ROM, 2002.
25
FAO: Small-scale irrigation for arid zones: principles and options, online link: http://www.fao.
org/docrep/W3094E/W3094E00.htm, 1997.
Famiglietti, J. S. and Wood, E. F.: Multiscale modeling of spatially variable water and energy-balance processes, Water Resour. Res., 30(11), 3061–3078, 1994.
Gebremeskel, S., Liu, Y. B., De Smedt, F., and Pfister, L.: Analyzing the effect of climate
30
changes on streamflow using statistically downscaled GCM scenarios, Int. J. River Basin Manage., 3(1), 1–10, 2005.
Henderson, F. M.: Open channel flow, McMillan, New York, USA, 1996.
HESSD
4, 881–908, 2007Prediction of runoff in the Simiyu River,
Tanzania using WetSpa J. Rwetabula et al. Title Page Abstract Introduction Conclusions References Tables Figures ◭ ◮ ◭ ◮ Back Close
Full Screen / Esc
Printer-friendly Version Interactive Discussion
Henry, L. and Kishimba, M. A.: Levels of pesticides residues in water, soil and sediments from southern Lake Victoria and its basin, Tanzania J. Sci., 29(1), 77–90, 2003.
Hoffmann, L., El Idrissi, A., Pfister, L., Hingray, B., Guex, F., Musy, A., Humbert, J., Drogue, G., and Leviandier, T.: Development of regionalized hydrological models in an area with short hydrological observation series, River Res. Appl., 20(3), 243–254, 2004.
5
Jolankai, G., Panuska, J., and Rast, W.: Modelling of nonpoint source pollutant loads, in: As-sessment and control of nonpoint sources pollution of aquatic ecosytems, edited by: Thorn-ton, J. A., Rast, W., Holland, M. M., Jolankai, G., and Ryding, S.-O., UNESCO, Paris, France, 291–338, 1999.
Liu, Y. B., De Smedt, F., and Pfister, L.: Flood prediction with the WetSpa model oncatchment
10
scale, in: Flood Defence, 2002, edited by: Wu, B. S., Wang, Z. Y., Wang, Q., Huanga, G. H., Fang, W., and Huang, J. C, Science Press, New York Ltd., 499–507, 2002.
Liu, Y. B., Gebremeskel, S., De Smedt, F., Hoffmann, L., and Pfister, L.: A diffusive transport approach for flow routing in GIS-based flood modelling, J. Hydrol., 38(1–4), 91–106, 2003. Liu, Y. B. and De Smedt, F.: WetSpa Extension, Documentation and User manual, Department
15
of Hydrology and Hydraulic Engineering, Vrije Universiteit Brussel, 2004a.
Liu, Y. B. and De Smedt, F.: Flood Modeling for complex terrain using GIS and remote sensed information, Water Resour. Manage., 19, 605–624, 2004b.
Liu, Y. B., Batelaan, O., De Smedt, F., Huong, N. T., and Tam, V. T.: A test of a distributed mod-elling approach to predict flood flows in the karst Suoimuoi catchment in Vietnam, Environ.
20
Geol., 48, 931–940, 2005.
Liu, Y. B., Corluy, J., Bahremand, A., De Smedt, F., Poorova, J., and Velcicka, L.: Simulation of runoff and phosphorous transport in a Carpathian catchmeent, Slovakia, J. River Res. Appl., 22, 1009–1022, 2006.
Lugomela, C. and Machiwa, J.: Nutrient distribution, phytoplankton abundance and species
25
composition in Magu bay following the principal rain season in 2001, in: In Nutrients, micro-algae, sedimentation and sediment associations at the mouth of Simiyu river (Magu bay of Speke gulf) Lake Victoria, Tanzania, edited by: Machiwa, J. F., Lake Victoria Environmental Management Project (LVEMP), Tanzania, 22–39, 2002.
Mallants, D. and Feyen, J.: Kwantitative en kwalitatieve aspecten van oppervlakte en
grondwa-30
terstroming (in Dutch), 76, Vol. 2, Katholieke Universiteit Leuven (KUL), 1990.
Meertens, H. C. C. and Lupeja, P. M.: A collection of agricultural background information for for Mwanza region. Kilimo/FAO plant nutrition programme in Tanzania, Field document
HESSD
4, 881–908, 2007Prediction of runoff in the Simiyu River,
Tanzania using WetSpa J. Rwetabula et al. Title Page Abstract Introduction Conclusions References Tables Figures ◭ ◮ ◭ ◮ Back Close
Full Screen / Esc
Printer-friendly Version Interactive Discussion
No GCPF/URT/106/NET, Mwanza, Tanzania, 1996.
Nash, J. E. and Sutcliffe, J. V.: River flow forecasting through conceptual model, J. Hydrol., 10, 282–290, 1970.
Ningu, J.: An inventory of agro-chemicals in the Lake Victoria basin, Mwanza, Tanzania, Lake Victoria Environmental Management Project (LVEMP), Tanzania, 1–23, 2000.
5
Phoon, S. Y., Shamseldin, A. Y., and Vairavamoorthy, K.: Assessing impacts of climate change on Lake Victoria Basin, Africa, in: Proceedings of 30th WEDC International Conference, Vientiane, Lao PDR, 392–397, 2004.
Rwetabula, J., De Smedt, F., Rebhun, M., and Mwanuzi, F.: Transport of micropollutants and phosphates in the Simiyu river (tributary Lake Victoria), Tanzania, in: Proceedings of 1st
10
International Conference on Environmental Science and Technology, USA, edited by: Lyon, W. G., Hong, J., and Reddy, R. K., American Science Press, New Orleans, USA, 1, 110–116, 2006.
Rwetabula, J. and De Smedt, F.: Landuse and land cover mapping of the Simiyu Catchment (Tanzania) using remote sensing techniques, Proceedings of FIG Working Week and 8th
15
International Conference of Global Spatial Data Infrastructure (GSDI-8), Egypt, Cairo, online link:http:/www.fig.net/cairo/index.htm, 2005.
Scheren, P. A. G. M., Zanting, H. A., and Lemmens, A. M. C.: Estimation of water pollution sourcces in Lake Victoria, East Africa: Application and elaboration of the rapid assessment methodology, J. Environ. Manage., 58, 235–248, 2000.
20
Shaw, E. M.: Hydrology in practice, Van Nostrand Reinhold (International) Co. Ltd, 1988. Thornthwaite, C. W. and Mather, J. R.: “The water balance”, Laboratory of Climatology.
Publ. No. 8, Centerton N.J., 1955.
Wang, Z., Batelaan, O., and De Smedt, F.: A distributed model for Water and Energy Tranfer between Soil, Plants and Atmosphere (WetSpa), Phys. Chem. Earth, 21(3), 189–193, 1996.
25
Wanielista, M., Kersten, R., and Eaglin, R. Hydrology: Water quantity and quality control. John Wiley and Sons, Inc, New York, 1997.
Wittenberg, H.: Base flow recession and recharge as nonlinear storage processes, Hydrol. Processes, 13, 715–726, 1999.
HESSD
4, 881–908, 2007Prediction of runoff in the Simiyu River,
Tanzania using WetSpa J. Rwetabula et al. Title Page Abstract Introduction Conclusions References Tables Figures ◭ ◮ ◭ ◮ Back Close
Full Screen / Esc
Printer-friendly Version Interactive Discussion
Table 1. Estimated average annual water balance of the Simiyu catchment for the five year verification period June 1999 to May 2004.
Component Measured Calculated Percentage Mean Maxb (mm) (mm) (%) (mm/d) (mm/d) Precipitation 849 849 100.0 2.32 47.9 Interception 50 5.9 0.14 1.1 Surface runoff 17 2.0 0.05 1.9 Infiltration 782 92.1 2.13 44.8 Evapotranspiration 1286 776 91.4 2.12 11.7 Percolation 330 38.8 0.90 1.3 Interflow 27 3.2 0.08 1.3 Groundwater drainage 0 0.0 0.0 0.0 Total runoff 40.3a 44 5.2 0.12 2.5
Soil moisture storage 4 0.5 – –
Groundwater storage 25 3.0 – –
a
exclusive missing data
b
for the 5 year verification period
HESSD
4, 881–908, 2007Prediction of runoff in the Simiyu River,
Tanzania using WetSpa J. Rwetabula et al. Title Page Abstract Introduction Conclusions References Tables Figures ◭ ◮ ◭ ◮ Back Close
Full Screen / Esc
Printer-friendly Version Interactive Discussion # S # S # S # # S Serengeti game reserve # Flow station MET station 0 40km N E W S Lake Victoria
Fig. 1. Schematic representation of the Simiyu catchment, Tanzania, East Africa, with main rivers and location of flow and meteorological (MET) stations.
HESSD
4, 881–908, 2007Prediction of runoff in the Simiyu River,
Tanzania using WetSpa J. Rwetabula et al. Title Page Abstract Introduction Conclusions References Tables Figures ◭ ◮ ◭ ◮ Back Close
Full Screen / Esc
Printer-friendly Version Interactive Discussion 0 40km N E W S Elevation (m) 1900 - 2000 1800 - 1900 1700 - 1800 1600 - 1700 1500 - 1600 1400 - 1500 1300 - 1400 1200 - 1300 1100 - 1200
Fig. 2. Topographical map of the Simiyu catchment.
HESSD
4, 881–908, 2007Prediction of runoff in the Simiyu River,
Tanzania using WetSpa J. Rwetabula et al. Title Page Abstract Introduction Conclusions References Tables Figures ◭ ◮ ◭ ◮ Back Close
Full Screen / Esc
Printer-friendly Version Interactive Discussion N E W S 0 40km Landuse Bushland Cultivated Grassland Surface water Wasteland
Fig. 3. Landuse map of the Simiyu catchment.
HESSD
4, 881–908, 2007Prediction of runoff in the Simiyu River,
Tanzania using WetSpa J. Rwetabula et al. Title Page Abstract Introduction Conclusions References Tables Figures ◭ ◮ ◭ ◮ Back Close
Full Screen / Esc
Printer-friendly Version Interactive Discussion Clay Clay loam Loam Sandy clay Sandy clay loam Sandy loam Soil texture N E W S 0 40km
Fig. 4. Soil texture map of the Simiyu catchment.
HESSD
4, 881–908, 2007Prediction of runoff in the Simiyu River,
Tanzania using WetSpa J. Rwetabula et al. Title Page Abstract Introduction Conclusions References Tables Figures ◭ ◮ ◭ ◮ Back Close
Full Screen / Esc
Printer-friendly Version Interactive Discussion
Fig. 5. Variation of average monthly rainfall, potential evapotranspiration, and discharge at the catchment outlet of the Simiyu river (1999–2004).
HESSD
4, 881–908, 2007Prediction of runoff in the Simiyu River,
Tanzania using WetSpa J. Rwetabula et al. Title Page Abstract Introduction Conclusions References Tables Figures ◭ ◮ ◭ ◮ Back Close
Full Screen / Esc
Printer-friendly Version Interactive Discussion Runoff coefficient 0.1 - 0.2 0.2 - 0.3 0.3 - 0.4 0.4 - 0.5 0.5 - 0.6 0.6 - 0.7 0.7 - 0.8 0.8 - 0.9 0.9 - 1.0 N E W S 0 40km
Fig. 6. Potential runoff coefficient map of the Simiyu catchment.
HESSD
4, 881–908, 2007Prediction of runoff in the Simiyu River,
Tanzania using WetSpa J. Rwetabula et al. Title Page Abstract Introduction Conclusions References Tables Figures ◭ ◮ ◭ ◮ Back Close
Full Screen / Esc
Printer-friendly Version Interactive Discussion 0 40km N E W S
114 - 137
0 - 1 1 - 2 2 - 3 3 - 4 4 - 5 5 - 6 6 - 7 7 - 8 Travel time (d)Fig. 7. Flow travel time to the catchment outlet of the Simiyu river.
HESSD
4, 881–908, 2007Prediction of runoff in the Simiyu River,
Tanzania using WetSpa J. Rwetabula et al. Title Page Abstract Introduction Conclusions References Tables Figures ◭ ◮ ◭ ◮ Back Close
Full Screen / Esc
Printer-friendly Version Interactive Discussion
Fig. 8. Observed and simulated river discharge at the catchment outlet of Simiyu for the verifi-cation period, January 1999 to May 2004.