HAL Id: hal-00303002
https://hal.archives-ouvertes.fr/hal-00303002
Submitted on 25 Jul 2007HAL is a multi-disciplinary open access
archive for the deposit and dissemination of sci-entific research documents, whether they are pub-lished or not. The documents may come from teaching and research institutions in France or abroad, or from public or private research centers.
L’archive ouverte pluridisciplinaire HAL, est destinée au dépôt et à la diffusion de documents scientifiques de niveau recherche, publiés ou non, émanant des établissements d’enseignement et de recherche français ou étrangers, des laboratoires publics ou privés.
Application of a diode array spectroradiometer to
measuring the spectral scattering properties of cloud
types in a laboratory
A. R. D. Smedley, A. R. Webb, C. P. R. Saunders
To cite this version:
A. R. D. Smedley, A. R. Webb, C. P. R. Saunders. Application of a diode array spectroradiometer to measuring the spectral scattering properties of cloud types in a laboratory. Atmospheric Chemistry and Physics Discussions, European Geosciences Union, 2007, 7 (4), pp.10767-10797. �hal-00303002�
ACPD
7, 10767–10797, 2007 Laboratory spectral scattering of clouds A. R. D. Smedley et al. Title Page Abstract Introduction Conclusions References Tables Figures ◭ ◮ ◭ ◮ Back Close Full Screen / EscPrinter-friendly Version Interactive Discussion
EGU
Atmos. Chem. Phys. Discuss., 7, 10767–10797, 2007 www.atmos-chem-phys-discuss.net/7/10767/2007/ © Author(s) 2007. This work is licensed
under a Creative Commons License.
Atmospheric Chemistry and Physics Discussions
Application of a diode array
spectroradiometer to measuring the
spectral scattering properties of cloud
types in a laboratory
A. R. D. Smedley, A. R. Webb, and C. P. R. Saunders
Centre for Atmospheric Science, University of Manchester, Simon Building, Manchester M13 9PL, UK
Received: 23 May 2007 – Accepted: 23 July 2007 – Published: 25 July 2007 Correspondence to: A. R. D. Smedley ([email protected])
ACPD
7, 10767–10797, 2007 Laboratory spectral scattering of clouds A. R. D. Smedley et al. Title Page Abstract Introduction Conclusions References Tables Figures ◭ ◮ ◭ ◮ Back Close Full Screen / EscPrinter-friendly Version Interactive Discussion
EGU
Abstract
In the last few years diode array spectroradiometers have become useful complements to traditional scanning instruments when measuring visible and ultraviolet solar radia-tion incident on the ground. This study describes the applicaradia-tion of such an instrument to the problem of measuring the radiation scattered by different cloud types in a labo-5
ratory environment. Details of how the instrument is incorporated into the experimental set-up are given together with the development of the system as a whole. The capa-bility to measure a full spectrum for each scattering angle is an undoubted advantage, although the limited dynamic range impacts on the usefulness for optically thin clouds. Nevertheless example results are presented: (1) scattering phase functions at a range 10
of wavelengths recorded simultaneously for water clouds, showing spectral deviation at the rainbow angle and verification of Mie theory; (2) likewise for mixed phase clouds, with evidence of both halo and rainbow features in a single scattering function; and, (3) detail of the forward scattering region in a glaciated cloud showing a barely per-ceptible halo feature, with implications for the small-scale structure of the ice crystals 15
produced.
1 Introduction
Clouds are without doubt the most important regulators of radiation in the atmosphere, and thus a reliable treatment of scattering is required in many areas. Although single scattering numerical schemes are available they are often too computationally inten-20
sive to be included as a component part of a large model, such as a NWP model. To improve the accuracy and range of forecasts an appropriate simplification should be incorporated into the code. Typically this is done without any spectral dependence and with limited modelling of the different cloud types (Goody and Yung, 1995). Spe-cialist radiative schemes, including those that are chemically based, similarly rely on 25
ACPD
7, 10767–10797, 2007 Laboratory spectral scattering of clouds A. R. D. Smedley et al. Title Page Abstract Introduction Conclusions References Tables Figures ◭ ◮ ◭ ◮ Back Close Full Screen / EscPrinter-friendly Version Interactive Discussion
EGU
received throughout the atmosphere (Webb et al., 2002). However oversimplification of the complex microphysics and the single scattering process can have a large impact on the validity of such models; likewise much emphasis needs to be placed on ensur-ing that improved radiation treatments are no more numerically intensive, yet provide a significant step-up in the accuracy of bulk radiative properties for typical clouds at a 5
wide range of wavelengths. Experimental evidence is pivotal in selecting the optimum simplification for all these cases, as well as to verify new single scattering predictions for increasingly complex and realistic cloud particles.
In a related vein, atmospheric remote sensing relies upon a knowledge of scatter-ing processes for retrieval of cloud locations, types and composition, amongst other 10
atmospheric variables. This is so whether the instrument is space or ground-based, active or passive in nature (for example Chepfer et al., 2001; Donovan et al., 2001). Satellite remote measurements of environmental and geophysical variables must also deal accurately with the cloud–radiation interaction. Many of these applications require the wavelength dependent aspect of scattering to be properly constrained for accurate 15
data retrieval.
Furthermore spectral scattering by cloud types has a number of immediate implica-tions for human activities. First there are notable biological effects that depend primarily on the intensity and wavelength of radiation incident at ground level. Not least amongst these is an increase in the incidence of skin melanoma in Europe, both malignant and 20
non-malignant, a primary risk factor being exposure to ultraviolet radiation (for example, de Guijl, 1999). Additionally the ultraviolet and visible ranges of the solar spectrum are of critical importance for the wider biosphere, both for crop production and unmanaged ecosystems.
Lastly an improved understanding of the scattering process can be useful as a coun-25
terpoint to its role in future global warming scenarios. In many regions of the world an integrated approach towards renewable energy is most favourable, with wind turbines and solar panels providing differing proportions of the power requirements depending on the prevailing weather conditions. The solar PV cell industry is still largely in its
ACPD
7, 10767–10797, 2007 Laboratory spectral scattering of clouds A. R. D. Smedley et al. Title Page Abstract Introduction Conclusions References Tables Figures ◭ ◮ ◭ ◮ Back Close Full Screen / EscPrinter-friendly Version Interactive Discussion
EGU
infancy, with the power output of different devices being related to both the wavelength and angle of incidence of radiation on an individual basis (for example, Parretta et al., 1999). Hence analysis of a site’s climatology can allow appropriate device charac-teristics to be selected, optimising future power output. Spectral scattering will also play an important role in predicting the day to day contribution to a region’s energy 5
requirements.
Previous laboratory scattering studies have typically used lasers as the light source, and although this provides an intense highly collimated beam, it limits results to a sole wavelength (for example Sassen and Liou, 1979 and more recently Rimmer and Saun-ders, 1997). Ideally multiple wavelengths would be scattered and recorded separately 10
in a single instance. Diode array spectroradiometers (DASR) have already been used to this end in ground and aircraft based radiation measurements (Bais et al., 2005; Kylling et al., 2005; Jakel et al., 2007); here their application to the problem of sin-gle scattering by various cloud types will be described, together with some example results. Further details are available in Smedley (2003).
15
2 Experimental set-up
In order to measure the spectral scattering properties of various cloud types in a labo-ratory scenario a number of component parts must be realised and controlled. These are: containment and control of the cloud produced; determination of the cloud’s physi-cal properties; a stable, collimated light source; and the ability to measure the scattered 20
radiation at a number of different angles with respect to the incoming beam. 2.1 Cloud chamber and production
The cloud chamber used in this study has previously been used in other cloud micro-physical investigations, as has the scattering chamber and 2-D probe (Rimmer and Saunders, 1997; Saunders and Rimmer, 1999). The cloud chamber is housed within 25
ACPD
7, 10767–10797, 2007 Laboratory spectral scattering of clouds A. R. D. Smedley et al. Title Page Abstract Introduction Conclusions References Tables Figures ◭ ◮ ◭ ◮ Back Close Full Screen / EscPrinter-friendly Version Interactive Discussion
EGU
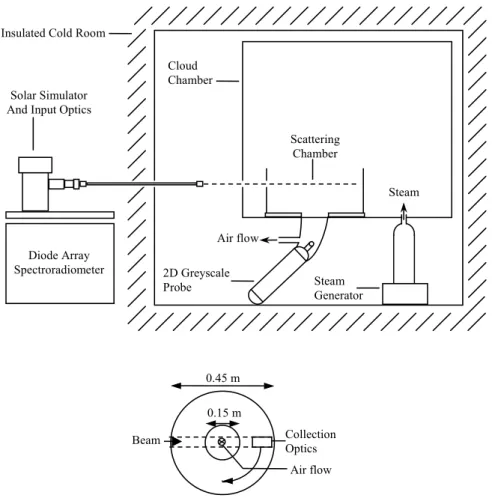
a walk-in cold room of internal dimensions approximately 2 m×2 m×2 m. The walls are 0.2 m thick and insulated, entry being by a double door airlock. The cloud chamber itself is 1.22 m×1.17 m in area, with a height of 0.90 m; the base is raised 0.9 m above the cold room floor. Scattering of radiation occurs within a cylindrical chamber of di-ameter 450 mm located on the base of the cloud chamber. All internal cloud chamber 5
surfaces are painted matt black to minimise reflections.
Thermostatic control allows the temperature of the cold room to be reduced to – 40◦C; the actual temperature within the cloud chamber is measured by 8 calibrated
K-type thermocouples, cold junction compensated on a controlling board, and each with a resulting resolution of 0.2◦C. The standard deviation of each thermocouple in
10
the range 0 to –20◦C is 0.9◦C with a time response to step changes of 12 s.
Water vapour is produced by a applying a variable voltage to a steam generator located beneath the cloud chamber. As the steam enters the cloud chamber it con-denses, the temperature and time spent by individual cloud particles within the cham-ber determining the microphysical properties. The addition of an external vacuum 15
pump enables the cloud properties to be held constant for a longer period of time than otherwise would be feasible by enabling a steady state environment to be produced; additionally it provides a flow of air from the main cloud producing part of the cloud chamber, down through the scattering chamber, and past the 2-D probe detection re-gion, before exiting the cold room.
20
Nucleation of the vapour injected into the cloud chamber can be achieved in one of two main ways: one is the addition of a refrigerating catalyst (often achieved by inserting a LN2 cooled metal rod into the supercooled cloud), another is the “pop-gun” method where sudden adiabatic expansion of moist air creates many small ice crystals. Both are essentially “one-shot” methods and therefore do not help to sustain a 25
controlled steady-state particle size distribution. The latter method, however, has been adapted to create a continuous nucleation method for ice and mixed phase clouds, as in Rimmer and Saunders (1997). To achieve this, compressed air is supplied at 2 to 3 bar to a solenoid valve located within the cloud chamber. An electrical pulse
ACPD
7, 10767–10797, 2007 Laboratory spectral scattering of clouds A. R. D. Smedley et al. Title Page Abstract Introduction Conclusions References Tables Figures ◭ ◮ ◭ ◮ Back Close Full Screen / EscPrinter-friendly Version Interactive Discussion
EGU
circuit allows ∼10 ms pulses of compressed air to be released every few seconds from the valve. Pulse length and frequency are adjustable enabling cloud conditions to be stabilised for up to 10 min. For further details on nucleation methods see Sect. 3.4. 2.2 Measurement of cloud physical properties
To size and identify cloud particles an optical array two-dimensional greyscale probe 5
(model number: OAP-2D-GA2) provided by Particle Measuring Systems Inc. is placed beneath an aperture of diameter 150 mm in the base of the scattering chamber. A downward draft from the vacuum pump draws cloud particles between the 2-D probe tips and through the laser beam sample volume. Each particle causes a shadow to be cast on a 64 element photodiode array. The degree of shadowing is encoded as 10
a two-bit digital signal with three levels of shadow: 25 to 50%, 50 to 75% and greater than 75% shadowing. Imaging occurs between the probe tips at an effective resolution of 10 µm, with a maximum particle width of 620 µm. The instantaneous conditions of all 64 photodiodes together form a horizontal image slice; these are recorded at a rate proportional to the vertical component of the particles’ velocity to form complete 2-D 15
images.
Ordinarily the slice rate must be set such that an image exhibits the same aspect ratio as the particle that formed it. An anemometer connected to the purge air tube allowed the slice rate to be set thus, once corrected for losses and the ratio of the tube cross-section at both points.
20
In the case of droplets, the method of “oversampling” was used to determine the particle size distribution (Smedley et al., 2003). This essentially follows Reuter and Bakan (1998) where a linear fit is obtained between the particle diameter (estimated from the total number of shadowed image pixels) and the proportion of min shadowed pixels. Fundamentally however the slice rate is increased by a factor of 10, thereby 25
stretching the droplet image to an ellipse. The primary advantage is that the number of pixels is greatly increased allowing the method to size particles down to 7 µm. The increase in size of the diffraction image as the particle moves away from the object
ACPD
7, 10767–10797, 2007 Laboratory spectral scattering of clouds A. R. D. Smedley et al. Title Page Abstract Introduction Conclusions References Tables Figures ◭ ◮ ◭ ◮ Back Close Full Screen / EscPrinter-friendly Version Interactive Discussion
EGU
plane is intrinsically taken into account.
In the case of ice crystals, oversampling offers no benefits and the slice rate is set to preserve the aspect ratio of cloud particles. This allows crystal habits to be identi-fied more easily, more so as the temperature and nucleation of each cloud sample is controlled; crystals are then sized. For both droplets and crystals, to derive the particle 5
size distribution, the particle count is correctly adjusted for the sample area which is particle size dependent, together with the probe busy rate.
2.3 Illumination of the cloud sample
An ozone-free 1000W Xenon arc lamp (Oriel Instruments, CT) is used to illuminate the cloud formed within the chamber. It is powered by a constant wattage arc lamp supply 10
which maintains the idealised power output to within 2%, once thermal equilibrium has been achieved. This was found to require at least 30 min, and hence this time was allowed between ignition of the lamp and the taking of measurements. To mitigate against any extra instability, as seen by Bolsee et al. (2000), the scattered spectrum is normalised by the direct beam spectrum for each cloud sample.
15
The lamp is contained within a force-ventilated safety housing located adjacent to the cold room. In the housing resides an integrated F/1 UV grade fused silica condenser assembly on one side of the lamp and a spherical mirror on the other, to increase the output beam intensity by 60%. The condenser assembly and spherical mirror are used to collimate the beam before it passes into a water filter. The water filter is filled 20
with distilled water and cooled by pumping tap water through its external chamber. It serves to remove infrared wavelengths, thus protecting other optical components and also eliminating an unwanted cause of evaporation or sublimation of cloud particles as they pass through the beam.
Next the collimated beam passes through a 320 nm high-pass step filter to protect 25
the liquid light guide (LLG) from the shortest UV wavelengths. It is then focused onto the entrance of the LLG which directs the beam towards the outer edge of the scattering chamber. The LLG is a flexible tube 1 m in length, with a diameter of 5 mm, containing
ACPD
7, 10767–10797, 2007 Laboratory spectral scattering of clouds A. R. D. Smedley et al. Title Page Abstract Introduction Conclusions References Tables Figures ◭ ◮ ◭ ◮ Back Close Full Screen / EscPrinter-friendly Version Interactive Discussion
EGU
a transmissive liquid sealed by stainless steel tubing and quartz windows at both ends. It has advantages over traditional fibres with a high acceptance angle of 72◦, higher UV
transmittance and does not suffer from fibre breakage. However the liquid does freeze at –5◦C and therefore the portion within the cold room is heated to prevent this.
At the exit port of the LLG is attached a 38 mm diameter F/2 fused silica lens assem-5
bly to collimate the output. A thin aperture stop with a diameter of 1.33 mm has been inserted against the window of the LLG to limit the maximum divergence of the beam to 0.50◦. The optical axis of the collimated beam is then aligned with the axis of the
entrance and exit ports of the scattering chamber, by positioning the marginal radiance distribution of the beam symmetrically on both.
10
The useful beam power delivered to the scattering chamber, however, is a small frac-tion of that developed by the arc lamp. Collimating the beam, selecting UV and visible wavelengths, and reducing the divergence all contribute so that only 5W is directed into the scattering chamber.
2.4 Measurement of the scattered radiation 15
In order to measure the scattered radiation a DASR is used. This is a relatively new method of capturing spectral data. It does have limitations compared to scanning spectroradiometers: a relatively poor dynamic range and lower sensitivity at UV wave-lengths. In our case though the advantage of being able to record a full spectrum within ∼1 s outweighed these, allowing scattering data for a cloud to be recorded within less 20
than 10 min. The difficulties of cloud reproducibility precludes using a scanning spec-troradiometer for more than a couple of wavelengths; likewise illuminating the cloud with monochromatic radiation and recording with a broadband detector is not a realis-tic option.
The DASR consists of a pair of monolithic monochromators each with fixed concave 25
imaging gratings contained within a single 19 inch-rack mountable unit. The diffracted spectra are incident upon two separate linear diode arrays; these are recorded as counts and output, via the accompanying electronics and an RS232 connection, to a
ACPD
7, 10767–10797, 2007 Laboratory spectral scattering of clouds A. R. D. Smedley et al. Title Page Abstract Introduction Conclusions References Tables Figures ◭ ◮ ◭ ◮ Back Close Full Screen / EscPrinter-friendly Version Interactive Discussion
EGU
PC.
Each spectrometer exhibits a drift in wavelength alignment of <0.05 nm/K to temper-ature changes and integration times that can be set between 50 and 5000 ms. The 512 pixel diode arrays have a spectral resolution of 0.82 nm (equivalent interpixel distance), FWHM of 2.1 nm and a wavelength range of 280 to 700 nm. Counts are recorded in 5
16-bit precision, recording up to 64 000 for each pixel.
The optical input to each spectrometer is by way of 4 m long 0.5 mm diameter quartz optical fibres. The detection optics for the first monochromator, channel A, consists of a sealed lens assembly containing a 38 mm diameter 69.3 mm focal length plano-convex lens. This is positioned so that the lens focal point is positioned centrally, and 10
normally to the optical fibre input. The lens assembly is secured to a rotating disc within the scattering chamber, facing towards the axis of rotation and level with the incoming beam (Fig. 1). To prevent frost or condensation build-up on the face of the lens, the assembly is heated and wrapped in insulating material. Due to the low dynamic range of the instrument, when measuring the forward scattering region the aperture of the 15
receiving optics was reduced by a factor of 1100.
The route taken by the optical fibre is chosen carefully so that as the scattering disc rotates to measure radiation scattered at the full range of angles (each step equates to an angular movement of 0.094◦), there will be minimal change in the degree of bending.
Additionally each section of the optical fibre only experiences either torsional forces or 20
bending about an axis perpendicular to its own. To this end the fibre passes through the cold room wall and enters the scattering chamber from beneath, to one side of the 2-D probe tips; here it executes a 180◦ turn to enter the rear of the lens assembly.
The optical fibre connected to channel B of the DASR similarly passes into the cloud chamber, but enters through a port in the side. The end is positioned to face precisely 25
along the optical axis of the incoming beam, allowing the direct beam to be monitored at all times when the channel A lens assembly is at scattering angles greater than 30◦.
It is not necessary to calibrate the intensity of the DASR as all scattered radiation spectra will be normalised by the direct, unscattered, beam. However the wavelength
ACPD
7, 10767–10797, 2007 Laboratory spectral scattering of clouds A. R. D. Smedley et al. Title Page Abstract Introduction Conclusions References Tables Figures ◭ ◮ ◭ ◮ Back Close Full Screen / EscPrinter-friendly Version Interactive Discussion
EGU
calibration must be determined and the dark and stray light signal subtracted. The wavelength calibration is carried out by fitting a quadratic function to the peak of each of the seven most prominent emission lines emitted by a Hg pencil lamp (Oriel model 6035). A fourth order polynomial fit was then produced between the fractional pixel number of each line and the idealised wavelengths as measured by Sansonetti et 5
al. (1996), and applied to the whole array. In two cases where the DASR was un-able to resolve a multiplet, the weighted mean position was found from the relative intensity values supplied by Sansonetti et al.
The mean dark signal of 5 scans was recorded immediately before and after the scattering measurement and at the same integration time, and subtracted from each 10
spectrum, ensuring that the DASR temperature remained stable. This allows signals to be recorded for the full range of wavelengths detectable by the DASR. To test for stray light a series of high-pass step filters was inserted between the direct beam and the detection optics; this showed that there are no multiple order or stray light effects at the level of 10−4 of the primary signal.
15
3 Results
3.1 Analysis of measured spectra
In order to compare the experimentally found scattering functions with those predicted from Mie Theory and ray tracing, it is necessary to convert these into comparable forms. For the measured scattering spectra, further to normalisation by the direct beam, this 20
entails correcting for the “scattering volume”, and integrating as appropriate over wave-length.
In the first instance the theoretical calculation of the scattering matrix, S, and hence the scattering phase functions, Pi j, apply to single particles. Integration over a range of particle sizes is of course possible, but the scattering that occurs is assumed to be 25
ACPD
7, 10767–10797, 2007 Laboratory spectral scattering of clouds A. R. D. Smedley et al. Title Page Abstract Introduction Conclusions References Tables Figures ◭ ◮ ◭ ◮ Back Close Full Screen / EscPrinter-friendly Version Interactive Discussion
EGU
upon the intersection volume of the incoming beam and the scattered beam. This angle-dependent volume is hereinafter referred to as the scattering volume.
It will be noted that a simple exact solution for the scattering volume would only ob-tainable when both beams are of the same radius and collimated. As differing radii are involved the result involves elliptic functions. Therefore the most efficient method 5
was that of a simple numerical model whereby elements in a 3-D matrix, each repre-senting a cube of side 1mm, were counted if they fell within the surfaces delimiting the scattering volume. These were principally the outer surface of the diverging incoming beam, and of the field of view of the receiving optics, but additionally, for scattering an-gles close to 0◦and 180◦, the scattering chamber itself, the front face of the receiving
10
optics, plus occlusion by the receiving optics housing.
The effect of beam divergence upon the scattering volume was also incorporated into this model, with the cross-sectional intensity of the incoming beam being approxi-mated well by a trapezium. Conservation of energy is then used to find the appropriate weighting for each pixel, both as a function of distance along the optical axis and per-15
pendicular distance, and then applied for both the incoming beam and the receiving optics. This process produces the scattering volume as a function of scattering angle for both the normal and reduced aperture cases.
In order to increase the signal to noise ratio (SNR) for side scattering, six wavebands were chosen such that the total intensity in the incoming beam for each waveband 20
would be approximately equal. The intensity-weighted centre wavelengths thus found are: 340, 395, 444, 483, 540 and 624 nm; the first two falling into the UVA band and the remainder into the visible: violet, blue, green and red respectively.
The final stage in determining the measurable element of Pi j, the P11phase function,
from raw data is to consider the effect of multiply scattered and non-scattered contribu-25
tion to the measured signal. Typical total number concentrations are at most 300 cm−3,
with a scattering cross-section of 100 µm2 and path length of 300 mm. Combining these results in an optical depth of τ∼0.01, and hence multiply-scattered contribution of 1% – thus no attempt is made to remove any multiply scattered component. The
un-ACPD
7, 10767–10797, 2007 Laboratory spectral scattering of clouds A. R. D. Smedley et al. Title Page Abstract Introduction Conclusions References Tables Figures ◭ ◮ ◭ ◮ Back Close Full Screen / EscPrinter-friendly Version Interactive Discussion
EGU
scattered component, however, must be removed from the total measured signal and this is done by forming the ratio of the scattered to total intensity in terms of microphys-ical and optmicrophys-ical parameters, the latter determined largely from theory.
3.2 Theoretical calculations
Theoretical predictions of the scattering intensity were found from a combination of Mie 5
Theory, for water droplets, and ray tracing, for ice particles; all code being written in MatLab.
The code for Mie calculations was transcribed from Bohren and Huffman’s (1983) Fortran 77 code, and subsequently vectorised. Values for the scattering efficiency and coefficients were fully verified against Boll et al. (1958) for a range of size parameters 10
between 1 and 100 and refractive indices between 0.60 and 0.90. The form of phase functions were similarly checked against values on http://omlc.ogi.edu/calc/mie calc.
html. When integrating across the particle size distribution (PSD), n(r), rather than give equal consideration to all droplet radii, r, 200 intervals were chosen such that
n(r). ∆r was constant, thus reducing computing time while maintaining accuracy. 15
The ray tracing code follows Macke (1993) and Rockwitz (1989). The principal di-mension of a crystal is determined from 2-D probe measurements, with the secondary dimension calculated according to relations in Pruppacher and Klett (1997, p51). The crystal is orientated so that a realistic range of incoming ray angles is simulated. For crystals with a longest dimension, l , less than a lower threshold, l1, it is assumed that
20
all elevations between 0 and π/2 are equally likely; for crystals with l >l2, an upper threshold, the range of elevations is set to 0 to 0.05 radians to simulate the natural variability. For crystals where l1<l <l2 the upper angular limit is taken to be a linear
function of l . The limits have been set as follows, for plates [l1, l2] = [10 µm, 80 µm], and for columns [l1, l2] = [3 µm, 9 µm]. These reflect the greater stability of columnar
25
crystals, as implied from their drag coefficients, themselves proportional to the crystals’ equatorial area normal to the flow direction (Pruppacher and Klett 1997, Ch10).
ACPD
7, 10767–10797, 2007 Laboratory spectral scattering of clouds A. R. D. Smedley et al. Title Page Abstract Introduction Conclusions References Tables Figures ◭ ◮ ◭ ◮ Back Close Full Screen / EscPrinter-friendly Version Interactive Discussion
EGU
than 10−5 of its initial value, spread over a range of orientations and impacting across
the surface of the crystal. The scattered rays are added to the diffracted component and normalised to 4π over the complete sphere, before obtaining P11 in the horizontal plane. Values calculated for single crystals are comparable to those found in Rockwitz, but without the artificial peaks at intervals of 6◦. Subsequently the phase functions are
5
weighted according to the measured PSD.
In all calculations the real parts of the refractive indices for water are found from the relation in Djurisic and Stanic (1999), making use of the temperature and wavelength dependence; the imaginary component is taken from Hale and Querry (1973). At the wavelengths under investigation the refractive index of ice is independent of tempera-10
ture, and both real and imaginary values are taken from Warren (1984).
Calculations for both water droplets and ice particles were carried out for the six intensity-weighted wavelengths noted above.
3.3 Discussion and further analysis: water clouds
A wide range of environmental settings (steam generator voltage, purge velocity and 15
temperature) were chosen in order to produce water clouds of varied microphysical properties. Initial tests of the system indicated that the primary difficulty encountered was a low scattered signal. To ameliorate this a number of steps were taken: the cold room temperature was reduced below freezing even for liquid phase runs thus increas-ing the total number concentration; the integration time was increased to its maximum 20
of 5000 ms; and, the DASR itself was moved within the coldroom. This last measure reduced its operating temperature and hence the magnitude and standard deviation of the dark signal, although the instrument was held at a temperature several degrees above the main coldroom temperature in order to minimise the risk of condensation. The cumulative effect of these steps was to increase the sensitivity of the system by 25
approximately an order of magnitude.
var-ACPD
7, 10767–10797, 2007 Laboratory spectral scattering of clouds A. R. D. Smedley et al. Title Page Abstract Introduction Conclusions References Tables Figures ◭ ◮ ◭ ◮ Back Close Full Screen / EscPrinter-friendly Version Interactive Discussion
EGU
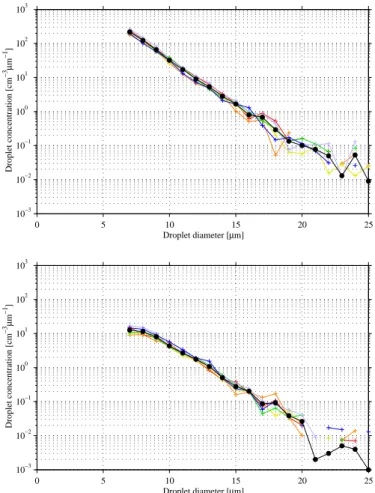
ied PSDs were selected for a second generation of water clouds, albeit with the tem-perature reduced in each case by 15◦C. Two sample PSDs are shown, in Figs. 2 and
3.
It can be seen that these PSDs generally exhibit a similar form, that is, reducing in an exponential manner. Closer inspection shows that cloud 14 adheres to this form 5
more closely while cloud 17 appears to have a maximum at 7 µm; the latter also has a much smaller total number concentration: 475 cm−3 for cloud 14, but only 43.0 cm−3
for cloud 17.
The issue of droplet sizes below the 7 µm measurement threshold of the 2-D probe is also considered. Four simplistic forms were proposed for the PSD between 0 and 10
7 µm: (1) no droplets of diameter less than 7 µm (2) the value at 7 µm is the peak and the PSD reduces to zero at 0 µm in an exponential fashion (3) the distribution is flat from 0 to 7 µm, with a value equal to that at 7 µm, and (4) the PSD continues to increase towards small particle diameter at the same exponential rate. These options cover most possible forms that could exist, assuming a singly peaked PSD, noting that 15
(2) bears most resemblance to natural cloud PSDs.
For each option the extrapolated PSD was used as an input to Mie Theory and the resulting phase functions compared with those measured. It was expected that the relative magnitude of the forward scattered peak would be a principle indicator in deciding which form the PSD took. However difficulties with the smooth motion of the 20
scattering disc at lower temperatures have caused a slight misalignment of the collector lens thus shutting off this avenue: in many cases the measured forward scattering is less than that at 1◦ as can be seen in Figs. 4 and 5. Therefore the shape of the
remainder of the phase function was used, noting that an increasing proportion of small particles has several effects: the diffraction peak, as well as reducing in height, 25
broadens; the second minimum moves to greater angles and rises; both primary and secondary rainbow peaks become less defined both angularly and spectrally. Using these features the best fit found was (4), which from direct extrapolation of the PSD is to be expected, particularly that in Fig. 2; this shows the cloud production method
ACPD
7, 10767–10797, 2007 Laboratory spectral scattering of clouds A. R. D. Smedley et al. Title Page Abstract Introduction Conclusions References Tables Figures ◭ ◮ ◭ ◮ Back Close Full Screen / EscPrinter-friendly Version Interactive Discussion
EGU
results in markedly different PSDs than occur naturally, being more like that of a contrail in form.
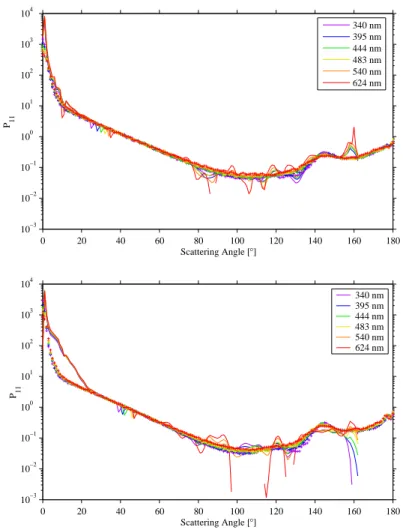
Due to the misalignment of the forward scattering peak, it was necessary to match the measured phase functions to the theoretical values over the range 20◦to 60◦, and
comparisons of these phase functions for the PSDs in Figs. 2 and 3 are shown in 5
Figs. 4 and 5.
It is apparent in cloud 14 that the measured phase function matches that predicted by Mie Theory for all wavelengths in general form. The obvious difference at 1◦can be
reconciled with the slight misalignment of the collector lens and the noise observed at the minimum is to be expected from spectra where the SNR was typically 1:50 for an 10
individual pixel of the DASR. A greater disparity is seen at 160◦due to dwindling signal
as the scattering volume reduces to zero. The effects of low signal can also be seen at a scattering angle of 13◦where the signal from the full beam was saturated and the
low signal was taken from reduced aperture measurements. For the angular range 0◦
to 13◦ the error bars are approximately 30, in P
11 units, and two orders of magnitude
15
less over the remainder of the phase function. Nonetheless the enhanced scattering at longer wavelengths at 10◦ is observed, as is the predicted spectral variation in the
cloudbow region. Considering the range of values that have been measured covers seven orders of magnitude, the closeness of fit is very good, once account is taken of the small diameter region of the PSD.
20
In water cloud 17 the same form for the extrapolation of the PSD has been used for the theoretical prediction and matching over scattering angles of 20◦ to 60◦ has been
carried out. As before a good fit is found for all scattering angles >24◦ including some
indication of the spectral nature at the 138◦rainbow angle, within the errors mentioned
previously. 25
However, there is a marked deviation in the measured signal of an order of magnitude over the range 2◦ to 24◦. This deviation is an increase and thus not due to a loss of
signal in the system. Multiple scattering has been considered earlier, and especially for cloud 17 due to its low optical thickness, has been ruled out.
ACPD
7, 10767–10797, 2007 Laboratory spectral scattering of clouds A. R. D. Smedley et al. Title Page Abstract Introduction Conclusions References Tables Figures ◭ ◮ ◭ ◮ Back Close Full Screen / EscPrinter-friendly Version Interactive Discussion
EGU
One avenue lies in the assumption that the PSD is representative of the cloud in the whole scattering chamber, and at a minimum, the scattering volume. In tests some inhomogeneity has been observed by eye, mainly due to light air flows through the port through which the incident beam enters. This has been minimised by placing the collimating lens assembly in close proximity to the port and sealing the surrounding 5
volume. Making the reasonable assumption that air is drawn down the purge pipe equally from all of the scattering chamber, then for such a signal to be observed would place strong and improbable restrictions upon the symmetry of N0fluctuations.
The most likely cause for the observed increase is condensation on the focusing lens. Although none was observed and regular cleaning imposed and the assembly heated 10
on its curved surface, the possibility remains that a small number of droplets could have formed during the initiation period of the cloud. A covering of even ∼1% of the lens surface area would leave the remainder of the signal unaffected, but at scattering angles where the focusing lens was still illuminated by the proceeding beam, conden-sation droplets could redirect part of this beam into the field of view of the detection 15
optics providing a significant enhancement. This process could operate in the present instance for scattering angles up to 11◦; a similar mechanism on the inner curved
sur-face of the lens housing, grooved with a screw thread and extending beyond the lens, would operate for scattering angles up to 22◦. It is clear that Fig. 5 corroborates this
explanation. 20
3.4 Discussion and further analysis: ice and mixed phase clouds
Turning the experimental set-up to investigate scattering by mixed phase and ice clouds was more problematic. It was anticipated that the production of stable, reproducible PSDs for these cloud types would be more difficult and thus the aim was to create ice clouds in the first instance; a large proportion of water droplets would denote a mixed 25
phase cloud.
All glaciated clouds were produced at –15◦C to maximise the growth of ice particles
ACPD
7, 10767–10797, 2007 Laboratory spectral scattering of clouds A. R. D. Smedley et al. Title Page Abstract Introduction Conclusions References Tables Figures ◭ ◮ ◭ ◮ Back Close Full Screen / EscPrinter-friendly Version Interactive Discussion
EGU
was implemented so as to preserve the aspect ratio of crystal images. In order to size crystals it was decided to follow a simplistic method of measuring the maximum linear dimension. Although this does not take account of the effects of diffraction or non-normal crystal orientation (which introduces a reduction of up to 30% for plates), these two factors oppose one another to some extent and thus smooth the true PSD 5
rather than introducing a bias in either direction.
It was assumed that smallest cloud particle images were either water droplets or ice spheres and therefore sized as the diameter of the circle with an equivalent area. Those greater than 25 µm were assumed to be ice crystals, with the habit confirmed by manual observation of the largest crystals. The 25 µm threshold was derived from 10
earlier water PSDs and confirmed as the point where the PSD reduces most rapidly. The presence of ice crystals was additionally confirmed by the degree of scintillation visible.
A wide gamut of experimental settings was tested, including those of Rimmer and Saunders (1997). Greater variability was seen in the PSDs between individual clouds 15
and over the course of a single cloud’s lifetime and invariably the cloud microphysics was dominated by water. To circumvent this, the ‘pop-gun’ solenoid was replaced with a short section of rubber tube which was restricted with a screw clamp. Judicious setting of the clamp allowed a greater air flow than before, yet retaining significant adiabatic cooling. The result was significant and more sustained nucleation.
20
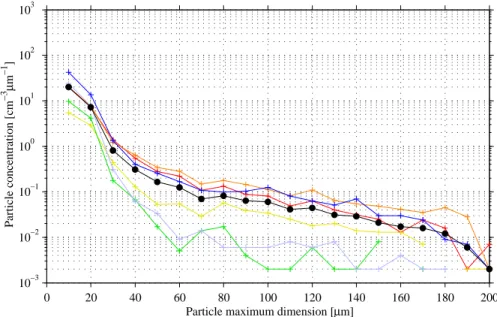
The PSD shown in Fig. 6 from mixed cloud 3 is typical of those produced. A large peak of water droplets at 10 to 20 µm, followed by a drop of an order of magnitude or two, before a plateau of hexagonal plates is seen out to a maximum dimension of approximately 150 µm. Despite the improvement in the nucleation method, it can be seen that there is a great deal more fluctuation between samples than for water clouds. 25
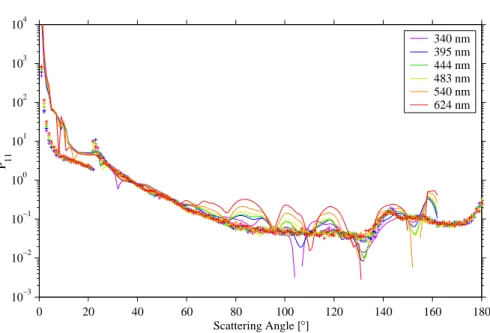
For scattering, however, the most important result is the reduced optical depth. This can be seen in the phase function measured in Fig. 7, against the theoretical prediction. The low optical depth reduces side scattering signals at angles between 60◦and 135◦;
ACPD
7, 10767–10797, 2007 Laboratory spectral scattering of clouds A. R. D. Smedley et al. Title Page Abstract Introduction Conclusions References Tables Figures ◭ ◮ ◭ ◮ Back Close Full Screen / EscPrinter-friendly Version Interactive Discussion
EGU
and from that predicted.
Notably the mixed phase cloud shows optical characteristics of both ice and water phase clouds in that there is an indication of both the 22◦ halo and 138◦primary
rain-bow, as expected by Oshchepkov et al. (2000). However the halo feature is much more poorly defined than predicted, perhaps due to the plates having small rimed droplets 5
upon their surface or imperfect symmetry both of which would broaden the peak and lessen its intensity. The rainbow, on the other hand, is enhanced in this example, but this is due to a reduction in the proportion of ice crystals at the end of the sampling period. At the lowest scattering angles the presumed effect of condensation remains an important issue.
10
When the system was applied to measuring the scattering from fully glaciated clouds, it was found that the total number concentration was lowered again, reducing the side scattering intensity below the threshold for meaningful results. The value of N0 was,
however, reasonable high in comparison to natural clouds: ∼5×10⁶m−3 in the cloud
chamber, compared to Dowling and Radke’s (1990) value of 3×10⁴m−3. As such, no
15
meaningful conclusions can be drawn about the full phase function in these cases. Despite the low SNR and the occurrences of condensation, there remains a region between 20◦ and 40◦where reasonable signals can be measured, and also where, for
plate-dominated clouds, 22◦halos should occur. For the following tests scattering
mea-surements were made with the DASR for 5000 ms at each angle from 16.9◦to 33.8◦, at
20
intervals of 0.94◦. The environmental conditions were as in the ice clouds, using the
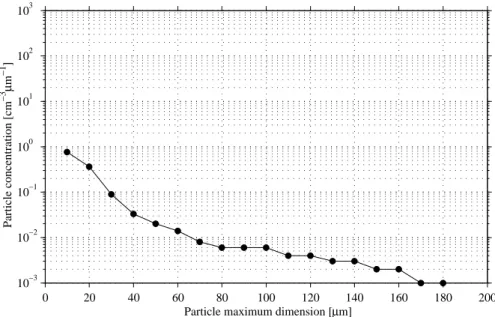
im-proved nucleation technique. The short timescale over which measurements recorded ensures that the PSD is representative of the particles producing the scattering. A typ-ical PSD is shown in Fig. 8, with example 2-D probe images from the same cloud in Fig. 9. It will be noted that, subject to the effects of diffraction and variable orientation, 25
the cloud consists of hexagonal plates.
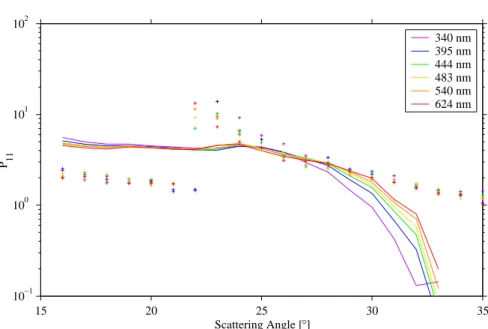
The experimental phase function section is normalised across the measured range to match theoretical predictions. Again in the modelling, the 25 µm threshold assump-tion is made, whereby the smallest particles are considered spheres and the remainder
ACPD
7, 10767–10797, 2007 Laboratory spectral scattering of clouds A. R. D. Smedley et al. Title Page Abstract Introduction Conclusions References Tables Figures ◭ ◮ ◭ ◮ Back Close Full Screen / EscPrinter-friendly Version Interactive Discussion
EGU
to be hexagonal plates, as observed. Figure 10 shows an example of the scattering produced. Although there is some evidence of the theoretically predicted spectral vari-ation in the measured phase function, the most important point of note is the lack of any discernable halo feature. There is no sudden increase at 22◦, but instead little
more than an inflexion point. 5
Rather than a deviation from theory per se, the lack of a halo feature is related to the difficulty of observing halos (for example Mishchenko and Macke, 1999). Although there are a number of possible explanations for this, one most easily ruled out is that the plates produced were too small for the geometric optics approximation to apply: for size parameters of 80 and above, both T-matrix calculations and geometric optics 10
predict a well defined peak (Mishchenko and Macke, 1999), a range into which all plates larger than 25 µm fall. The most plausible explanation is that mentioned earlier; that is, although plate-like in appearance, many ice crystals will exhibit interfacial angles that deviate from 60◦with small scale defects. Both of these will act to broaden the halo
peak and reduce its intensity (Konnen et al., 1994 and Barkey et al., 1999). Additionally 15
the smallest crystals are likely to be less well formed crystals, being in transition from recently nucleated ice spheroids to fully formed plates. The contributing effects of these entirely possible defects, unobservable with the 2-D probe used, would provide a powerful mechanism for destroying the halo feature, as observed.
It will be noted that previous scattering studies have dealt with the presence of a 20
22◦ halo. The first, Rimmer and Saunders (1997) did reveal the halo, but without any
analysis of the peak’s intensity which showed rapidly varying values in its vicinity. Four other studies are of note, all recording measurements made in the field with halos re-sulting from natural clouds. Two of these deal particularly with the polarimetry of halos (Konnen et al., 1994; Konnen and Tinbergen, 1991), and record a leading edge that is 25
less abrupt than from geometric optics. Digital analysis of a photograph by Lynch and Schwatrz (1985) produced a very similar form for the phase function, although in situ observation by Auriol et al. (2001) with a nephelometer and 2-D probe did not produce the minimum deviation enhancement. The significance of these studies becomes clear
ACPD
7, 10767–10797, 2007 Laboratory spectral scattering of clouds A. R. D. Smedley et al. Title Page Abstract Introduction Conclusions References Tables Figures ◭ ◮ ◭ ◮ Back Close Full Screen / EscPrinter-friendly Version Interactive Discussion
EGU
when the data collection process is considered. The first three studies measured the halo intensity profile whilst the halo was observable to the naked eye; the last follows the route in the instant study: searching for halos in microphysical conditions that ap-pear conducive to halo formation. Thus instrumentation will record halos when they are apparent to the naked eye and obtains useful intensity profiles, but this method assists 5
less in explaining the microphysical reasons for the relative scarcity of halos. To do this one must make a series of measurements irrespective of any prior knowledge of the halo.
4 Conclusions
This study has described the incorporation of a DASR instrument into an experimental 10
set-up designed to measure spectral scattering of various cloud types. Previous inves-tigations have typically used a laser and a broadband detector therefore limiting results to a single wavelength. Here the advantages are clearly apparent: multiple wave-lengths can be recorded at a single pass removing the need to repeatedly produce clouds with consistent PSDs. In turn no synchronisation is needed between scattering 15
runs and all the illumination can be provided by a single broadband source.
This strategy has proved itself in the first verification of Mie Scattering by water droplets at multiple wavelengths and particularly in the ultraviolet. Furthermore, al-though the mean diameter of droplets is below the threshold for well-defined rainbow colours to be observed, the spectral variation in the rainbow region is obvious.
20
However as the glaciated fraction in the cloud increases and the optical depth de-creases, the poor dynamic range of the instrument proves to be a shortcoming. This was evident during the production of mixed phase clouds in the first case and more so for ice clouds. For mixed clouds it was found still to be possible to record meaningful phase functions over the maximum possible range of scattering angles. It was possi-25
ble to control the environmental conditions such that the scattering function possessed characteristics of both water (rainbow) and ice (halo) clouds. These were poorly
de-ACPD
7, 10767–10797, 2007 Laboratory spectral scattering of clouds A. R. D. Smedley et al. Title Page Abstract Introduction Conclusions References Tables Figures ◭ ◮ ◭ ◮ Back Close Full Screen / EscPrinter-friendly Version Interactive Discussion
EGU
fined though, due to the low scattering intensity and the often-present influence of condensation upon the collection optics.
For ice clouds, despite improvements in the nucleation technique, a reduced optical depth prevented a full phase function from being recorded. In lieu, detail of the halo region was obtained. As in the mixed phase example the halo was much more weakly 5
produced than predicted. The most likely explanation for this had implications that even in a well controlled laboratory environment, the small scale structure of ice crystals can have a major impact on the scattering properties of the cloud as a whole.
Acknowledgements. The authors would like to thank the Natural Environment Research
Coun-cil for the funding of this study via Grant number 04/99/AS/284. 10
References
Auriol, F., Gayet, J. F., Febvre, G., Jourdan, O., Labonnote, L., and Brogniez, G.: In situ obser-vation of cirrus scattering phase functions with 22 degrees and 46 degrees halos: cloud field study on 19 February 1998, J. Atmos. Sci., 58, 3376–3390, 2001.
Bais, A., Blumthaler, M., Webb, A., Seckmeyer, G., Thiel, S., Kazadzis, S., Redondas, A., 15
Kift, R., Kouremeti, N., Schallhart, B., Schmitt, R., Pisulla, D., Diaz, J. P., Garcia, O., Diaz Rodriguez, A. M., and Smedley, A.: Intercomparison of solar UV direct irradiance spectral measurements at Izana in June 2005, P. Soc. Photo.-Opt. Inst., 5886, 1–10, 2005.
Barkey, B., Liou, K.-N., Gellerman, W., and Sokolsky, P.: An analog light scattering experiment of hexagonal icelike particles. Part I: Experimental apparatus and test measurements, J. 20
Atmos. Sci., 56, 605–612, 1999.
Bohren, C. F. and Huffman, D. R.: Absorption and scattering of light by small particles, Wiley, Chichester (NY), 1983.
Boll, R. H.: Tables of light-scattering functions, Univ of Michigan Pr., Ann Arbor (MI), 1958. Bolsee, D., Webb, A. R., Gillotay, D., Dorschel, B., Knuschke, P., Krins, A., and Terenetskaya, 25
I.: Laboratory facilities and recommendations for the characterization of biological ultraviolet dosimeters, Appl. Optics, 39, 2813–2822, 2000.
ACPD
7, 10767–10797, 2007 Laboratory spectral scattering of clouds A. R. D. Smedley et al. Title Page Abstract Introduction Conclusions References Tables Figures ◭ ◮ ◭ ◮ Back Close Full Screen / EscPrinter-friendly Version Interactive Discussion
EGU
crystal shapes in cirrus clouds derived from POLDER/ADEOS-1, J. Geophys. Res.-Atmos., 106, 7955–7966, 2001.
de Gruijl, F. R.: Biological Action Spectra, Radiat. Prot. Dosim., 91, 57–63, 1999.
Djurisic, A. B. and Stanic, B. V.: Modeling the temperature dependence of the index of refraction of liquid water in the visible and the near-ultraviolet ranges by a genetic algorithm, Appl. 5
Optics, 38, 11–17, 1999.
Donovan, D. P.: Ice-cloud effective particle size parameterization based on combined lidar, radar reflectivity, and mean Doppler velocity measurements, J. Geophys. Res.-Atmos., 108, 4573, doi:10.1029/2003JD003469, 2003.
Dowling, D. R. and Radke, L. F.: A summary of the physical properties of cirrus clouds, J. Appl. 10
Meteorol., 29, 970–978, 1990.
Goody, R. M. and Yung, Y. L.: Atmospheric radiation: theoretical basis, Oxford Univ. Pr., Oxford, 1995.
Hale, G. M. and Querry M. R.: Optical constants of water in the 200 nm to 200 µm wavelength region, Appl. Optics, 12, 555–563, 1973.
15
Jakel, E. Wendisch, M., Blumthaler, M., Schmitt, R., and Webb, A. R.: A CCD spectrora-diometer for ultraviolet actinic radiation measurements, J. Atmos. Ocean. Tech., 24, 449– 462, 2007.
Konnen, G. P., Muller, S. H., and Tinbergen, J.: Halo polarization profiles and the interfacial angles of ice crystals, Appl. Optics, 33, 4569–4579, 1994.
20
Konnen, G. P. and Tinbergen, J.: Polarimetry of a 22 degrees halo, Appl. Optics, 30, 3382– 3400, 1991.
Kylling, A, Webb, A. R., Kift, R., Gobbi, G. P., Ammannato, L., Barnaba, F., Bais, A., Kazadzis, S., Wendisch, M., Jakel, E., Schmidt, S., Kniffka, A., Thiel, S., Junkermann, W., Blumthaler, M., Silbernagl, R., Schallhart, B., Schmitt, R., Kjeldstad, B., Thorseth, T. M., Scheirer, R., and 25
Mayer, B.: Spectral actinic flux in the lower troposphere: measurement and 1-D simulations for cloudless, broken cloud and overcast situations, Atmos. Chem. Phys., 5, 1975–1997, 2005,
http://www.atmos-chem-phys.net/5/1975/2005/.
Lynch, D. K. and Schwartz, P.: Intensity profile of the 22 degree halo, J. Opt. Soc. Am. A, 2, 30
584–589, 1985.
Macke, A.: Scattering of light by polyhedral ice crystals, Appl. Optics, 32, 2780–2788, 1993. Mishchenko, M. I. and Macke, A.: How big should hexagonal ice crystals be to produce halos?,
ACPD
7, 10767–10797, 2007 Laboratory spectral scattering of clouds A. R. D. Smedley et al. Title Page Abstract Introduction Conclusions References Tables Figures ◭ ◮ ◭ ◮ Back Close Full Screen / EscPrinter-friendly Version Interactive Discussion
EGU
Appl. Optics, 38, 1626–1629, 1999.
Oshchepkov, S., Isaka, H., Gayet, J. F., Sinyuk, A., Auriol, F., and Havemann, S.: Microphysical properties of mixed-phase and ice clouds retrieved from in situ airborne polar nephelometer measurements, Geophys. Res. Lett., 27, 209–212, 2000.
Parretta, A., Sarno, A., Tortora, P., Yakubu, H., Maddalena, P., Zhao, J., and Wang, A.: Angle-5
dependent reflectance measurements on photovoltaic materials and solar cells, Opt. Com-mun., 172, 139–151, 1999.
Pruppacher, H. R. and Klett, J. D.: Microphysics of clouds and precipitation, D Reidel, Dordrecht (Holland), 1997.
Reuter, A., and Bakan, S.: Improvements of cloud particle sizing with a 2D-grey probe, J. 10
Atmos. Ocean. Tech., 15, 1196–1203, 1998.
Rimmer, J. S. and Saunders, C. P. R.: Radiative scattering by artificially produced clouds of hexagonal plate ice crystals, Atmos. Res., 45, 153–164, 1997.
Rockwitz, K. D.: Scattering properties of horizontally oriented ice crystal columns in cirrus clouds, Appl. Optics, 28, 4103–4110, 1989.
15
Sansonetti, C. J., Salit, M. L., and Reader, J.: Wavelengths of spectral lines in mercury pencil lamps, Appl. Optics, 35, 74–77, 1996.
Sassen, K. and Liou, K.-N.: Scattering of polarised laser light by water droplet, mixed phase and ice crystal clouds. Part II: angular depolarising and multiple-scattering behaviour, J. Atmos. Sci., 36, 852–861, 1979.
20
Saunders, C. P. R. and Rimmer, J. S.: The electric field alignment of ice crystals in thunder-storms, Atmos. Res., 51, 337–343, 1999.
Smedley, A. R. D.: Spectral scattering properties of cloud types, Thesis submitted to University of Manchester, Institute of Science and Technology, 2003.
Smedley, A. R. D., Saunders, C. P. R., and Webb, A.R.: Small particle size determination by 25
optical array probe oversampling, J. Atmos. Ocean. Tech., 20, 1568–1575, 2003.
Warren, S. G.: Optical constants of ice from the ultraviolet to the microwave, Appl. Optics, 23, 1206–1225, 1984.
Webb, A. R., Bais, A. F., Blumthaler, M., Gobbi, G. P., Kylling, A., Schmitt, R., Thiel, S., Barnaba, F., Danielsen, T., Junkermann, W., Kazantzidis, A., Kelly, P., Kift, R., Liberti, G. L., Misslbeck, 30
M., Schallhart, B., Schreder, J., and Topaloglou, C.: Measuring spectral actinic flux and irradiance: Experimental results from the Actinic Flux Determination from Measurements of Irradiance (ADMIRA) project, J. Atmos. Ocean. Tech., 19, 1049–1062, 2002.
ACPD
7, 10767–10797, 2007 Laboratory spectral scattering of clouds A. R. D. Smedley et al. Title Page Abstract Introduction Conclusions References Tables Figures ◭ ◮ ◭ ◮ Back Close Full Screen / EscPrinter-friendly Version Interactive Discussion EGU Steam Steam Generator 2D Greyscale Probe Air flow Scattering Chamber Cloud Chamber Insulated Cold Room
Solar Simulator And Input Optics
Diode Array Spectroradiometer Beam Collection Optics 0.45 m Air flow 0.15 m
ACPD
7, 10767–10797, 2007 Laboratory spectral scattering of clouds A. R. D. Smedley et al. Title Page Abstract Introduction Conclusions References Tables Figures ◭ ◮ ◭ ◮ Back Close Full Screen / EscPrinter-friendly Version Interactive Discussion EGU 0 5 10 15 20 25 10−3 10−2 10−1 100 101 102 103 Droplet diameter [µm] Droplet concentration [cm −3µ m −1 ] 0 5 10 15 20 25 10−3 10−2 10−1 100 101 102 103 Droplet diameter [µm] Droplet concentration [cm −3µ m −1]
ACPD
7, 10767–10797, 2007 Laboratory spectral scattering of clouds A. R. D. Smedley et al. Title Page Abstract Introduction Conclusions References Tables Figures ◭ ◮ ◭ ◮ Back Close Full Screen / EscPrinter-friendly Version Interactive Discussion EGU 0 20 40 60 80 100 120 140 160 180 10−3 10−2 10−1 100 101 102 103 104 Scattering Angle [°] P11 340 nm 395 nm 444 nm 483 nm 540 nm 624 nm 0 20 40 60 80 100 120 140 160 180 10−3 10−2 10−1 100 101 102 103 104 Scattering Angle [°] P11 340 nm 395 nm 444 nm 483 nm 540 nm 624 nm
ACPD
7, 10767–10797, 2007 Laboratory spectral scattering of clouds A. R. D. Smedley et al. Title Page Abstract Introduction Conclusions References Tables Figures ◭ ◮ ◭ ◮ Back Close Full Screen / EscPrinter-friendly Version Interactive Discussion EGU 0 20 40 60 80 100 120 140 160 180 200 10−3 10−2 10−1 100 101 102 103
Particle maximum dimension [µm]
Particle concentration [cm
−3
µ
m
−1 ]
Fig. 4. PSD for mixed cloud 03 at 2 min intervals (blue through red; black is mean), N0 = 293 cm−3, 93% drops, 7% plates by particle number.
ACPD
7, 10767–10797, 2007 Laboratory spectral scattering of clouds A. R. D. Smedley et al. Title Page Abstract Introduction Conclusions References Tables Figures ◭ ◮ ◭ ◮ Back Close Full Screen / EscPrinter-friendly Version Interactive Discussion EGU 0 20 40 60 80 100 120 140 160 180 10−3 10−2 10−1 100 101 102 103 104 Scattering Angle [°] P 11 340 nm 395 nm 444 nm 483 nm 540 nm 624 nm
ACPD
7, 10767–10797, 2007 Laboratory spectral scattering of clouds A. R. D. Smedley et al. Title Page Abstract Introduction Conclusions References Tables Figures ◭ ◮ ◭ ◮ Back Close Full Screen / EscPrinter-friendly Version Interactive Discussion EGU 0 20 40 60 80 100 120 140 160 180 200 10−3 10−2 10−1 100 101 102 103
Particle maximum dimension [µm]
Particle concentration [cm
−3 µ
m
−1
]
ACPD
7, 10767–10797, 2007 Laboratory spectral scattering of clouds A. R. D. Smedley et al. Title Page Abstract Introduction Conclusions References Tables Figures ◭ ◮ ◭ ◮ Back Close Full Screen / EscPrinter-friendly Version Interactive Discussion EGU
5 15 25
5
15
25
5 15 25
5
15
25
5 15 25
5
15
25
5 15 25
5
15
25
5 15 25
5
15
25
5 15 25
5
15
25
5 15 25
5
15
25
5 15 25
5
15
25
5 15 25
5
15
25
5 15 25
5
15
25
5 15 25
5
15
25
5 15 25
5
15
25
5 15 25
5
15
25
5 15 25
5
15
25
5 15 25
5
15
25
5 15 25
5
15
25
ACPD
7, 10767–10797, 2007 Laboratory spectral scattering of clouds A. R. D. Smedley et al. Title Page Abstract Introduction Conclusions References Tables Figures ◭ ◮ ◭ ◮ Back Close Full Screen / EscPrinter-friendly Version Interactive Discussion EGU 15 20 25 30 35 10−1 100 101 102 Scattering Angle [°] P 11 340 nm 395 nm 444 nm 483 nm 540 nm 624 nm