HAL Id: hal-00302263
https://hal.archives-ouvertes.fr/hal-00302263
Submitted on 13 Nov 2006HAL is a multi-disciplinary open access
archive for the deposit and dissemination of sci-entific research documents, whether they are pub-lished or not. The documents may come from teaching and research institutions in France or abroad, or from public or private research centers.
L’archive ouverte pluridisciplinaire HAL, est destinée au dépôt et à la diffusion de documents scientifiques de niveau recherche, publiés ou non, émanant des établissements d’enseignement et de recherche français ou étrangers, des laboratoires publics ou privés.
Relation of air mass history to nucleation events in Po
Valley, Italy, using back trajectories analysis
L. Sogacheva, A. Hamed, M. C. Facchini, M. Kulmala, A. Laaksonen
To cite this version:
L. Sogacheva, A. Hamed, M. C. Facchini, M. Kulmala, A. Laaksonen. Relation of air mass history to nucleation events in Po Valley, Italy, using back trajectories analysis. Atmospheric Chemistry and Physics Discussions, European Geosciences Union, 2006, 6 (6), pp.11209-11246. �hal-00302263�
ACPD
6, 11209–11246, 2006
Relation of air mass history to nucleation events in Po Valley, Italy L. Sogacheva et al. Title Page Abstract Introduction Conclusions References Tables Figures ◭ ◮ ◭ ◮ Back Close Full Screen / Esc
Printer-friendly Version Interactive Discussion Atmos. Chem. Phys. Discuss., 6, 11209–11246, 2006
www.atmos-chem-phys-discuss.net/6/11209/2006/ © Author(s) 2006. This work is licensed
under a Creative Commons License.
Atmospheric Chemistry and Physics Discussions
Relation of air mass history to nucleation
events in Po Valley, Italy, using back
trajectories analysis
L. Sogacheva1, A. Hamed2, M. C. Facchini3, M. Kulmala1, and A. Laaksonen2
1
Division of Atmospheric Sciences, Department of Physical Sciences, P.O. Box 64, 00014 University of Helsinki, Finland
2
Department of Physics, University of Kuopio, P.O. Box 1627, 70211 Kuopio, Finland
3
Istituto di Scienze dell’Atmosfera e del Clima – CNR, Italy Via Gobetti 101, 40 129 Bologna, Italy
Received: 29 September 2006 – Accepted: 3 November 2006 – Published: 13 November 2006
ACPD
6, 11209–11246, 2006
Relation of air mass history to nucleation events in Po Valley, Italy L. Sogacheva et al. Title Page Abstract Introduction Conclusions References Tables Figures ◭ ◮ ◭ ◮ Back Close Full Screen / Esc
Printer-friendly Version Interactive Discussion
Abstract
In this paper, we study the transport of air mass to San Pietro Capofiume (SPC) in Po Valley, Italy, by means of back trajectory analysis. Our main aim is to investigate whether air masses originate from different regions on nucleation event days and on nonevent days, during three years when nucleation events have been continuously
5
recorded at SPC. The results indicate that nucleation events occur frequently in air masses arriving form Central Europe, whereas event frequency is much lower in air transported from southern directions and from the Atlantic Ocean. We also analyzed the behaviour of meteorological parameters during 96 h transport to SPC, and found that on average, event trajectories undergo stronger subsidence during the last 12 h
10
before the arrival at SPC than nonevent trajectories. This causes a reversal in the temperature and relative humidity (RH) differences between event and nonevent tra-jectories: between 96 and 12 h back time, temperatures are lower and RH’s higher for event than nonevent trajectories and between 12 and 0 h vice versa. Boundary layer mixing is stronger along the event trajectories compared to nonevent trajectories.
15
The absolute humidity (AH) is similar for the event and nonevent trajectories between about 96 h and about 60 h back time, but after that, the event trajectories AH becomes lower due to stronger rain. We also studied transport of SO2 to SPC, and conclude
that although sources in Po Valley most probably dominate the measured concentra-tions, certain Central and Eastern European sources can also have a non-negligible
20
contribution.
1 Introduction
New particle formation in atmosphere draws considerable attention (Kulmala et al., 2004) due to the possible climate and health effects of aerosols. Although widely stud-ied, aerosol characterization is still hindered by our poor understanding of formation
25
processes of secondary aerosols, which are formed via gas phase condensation, and 11210
ACPD
6, 11209–11246, 2006
Relation of air mass history to nucleation events in Po Valley, Italy L. Sogacheva et al. Title Page Abstract Introduction Conclusions References Tables Figures ◭ ◮ ◭ ◮ Back Close Full Screen / Esc
Printer-friendly Version Interactive Discussion contribute to the relative abundance of primary aerosols formed via mechanical or
combustion processes. Sulphur, together with many nitrogen and carbon compounds, undergoes gas-to-particle transition, and they are ultimately removed from the atmo-sphere via aerosol deposition processes. Therefore, the lifetimes and concentrations of these species are defined by aerosol dynamics. Better understanding of new particle
5
formation will therefore contribute also to our comprehension of atmospheric chemistry in general.
The causes of air pollution and particle formation episodes are complex and depend on various factors including emissions of precursors, pre-existing aerosols, meteoro-logical parameters (in particular solar radiation, temperature and relative humidity),
10
topography, and photo-chemical processes (see, e.g. Kulmala et al., 2001, 2003). Air masses of different origins poses different meteorological and chemical characteristics, and therefore, from the Eulerian viewpoint, the probability of occurrence of new particle formation events at a given location and time depends not only on local emissions, but on airflows and long range transport (Sogacheva et al., 2005).
15
The Po Valley in Northern Italy, which is characterized by high industrial, urban and traffic emissions, has the country’s worst problems with air pollution, especially be-cause weather conditions, typical for that area, have a tendency to trap the pollutants, rather than to disperse them. This has an extremely negative impact on air quality. New particle formation is suppressed by high concentrations of pre-existing particles,
20
because of increased condensation sink for vapours that would otherwise nucleate to form new particles. It was therefore rather surprising to discover that intensive nucle-ation events actually occur frequently in the Po Valley (Laaksonen et al., 2005; Hamed et al., 2006). Here we investigate, by means of back-trajectory analysis, how new particle formation is affected by transport of air of different origin.
25
Long-range transport of photochemical gaseous air pollutants and particulate matter has been studied extensively in Europe during last decades under the framework of several national and international efforts. Many experimental research programs, e.g. EUROTRAC-2 (Kruger et al., 2000), PIPAPO (Steinbacher et al., 2005a, b),
MINA-ACPD
6, 11209–11246, 2006
Relation of air mass history to nucleation events in Po Valley, Italy L. Sogacheva et al. Title Page Abstract Introduction Conclusions References Tables Figures ◭ ◮ ◭ ◮ Back Close Full Screen / Esc
Printer-friendly Version Interactive Discussion TROC (Putaud et al., 2004; Van Dingenen et al., 2005), free Tropospheric campaign
(Balkanski et al., 2003) have been carried out over Alps, Apennines and Po Basin area. Several manuscripts have been published about the pollutants at high elevation Alpine sites. Pichlmayer et al. (1998) combined isotope analysis with back trajectories and found out the pre-industrial and modern origin for nitrates and sulfates,
respec-5
tively. Siebert et al. (1998) using the trajectory analysis concluded that the Po Valley contribute to about 15% of pollutants at Sonnblick (3106 m a.s.l.) and Jungfraujoch (3579 m a.s.l.) in summer and much less in winter. Bert `o et al. (2003) using back tra-jectories estimated the back-tracking water vapour contribution to a precipitation event over Trentino, Alpine target area, and concluded that most of precipitation seems to
10
be produced by air parcel residing over the Mediterranean Sea and the North African coast. Bonasoni et al. (2000) using trajectory statistics revealed that in warm season the highest background ozone concentration were related to air mass coming from northerly and easterly latitudes, while the highest ozone values for non-background conditions originated in Northern Italy and central Europe. Wotawa et al. (2000)
esti-15
mated ozone formation along trajectories crossing the Po Basin using measurements in the Alps and Apennines and 3-D backward trajectories. They concluded that both emissions from nearby areas and the European emission transported over the con-tinent have to be considered. Steinbacher et al. (2005a, b) presented the results of measurement of aromatic compounds, as well bimodal isoprene cycles during three
20
measurement campaigns.
The meteorological conditions causing air pollution episodes in the central Po Val-ley have been investigated by Finardi and Pellegrini (2004). They role of anticyclonic weather type have been emphasized along with weak winds and calms.
The aim of the present paper is to find out if there is any preferable direction for air
25
mass transport before the particle formation starts at SPC and what meteorological conditions along the air parcel trajectory dominate for cases when the formation of new particle occurs at SPC. We also investigate the transport directions for event and non-event days against the SO2sources over the Europe, using EMEP data, and calculated
ACPD
6, 11209–11246, 2006
Relation of air mass history to nucleation events in Po Valley, Italy L. Sogacheva et al. Title Page Abstract Introduction Conclusions References Tables Figures ◭ ◮ ◭ ◮ Back Close Full Screen / Esc
Printer-friendly Version Interactive Discussion the SO2potential emission sources.
2 Site description
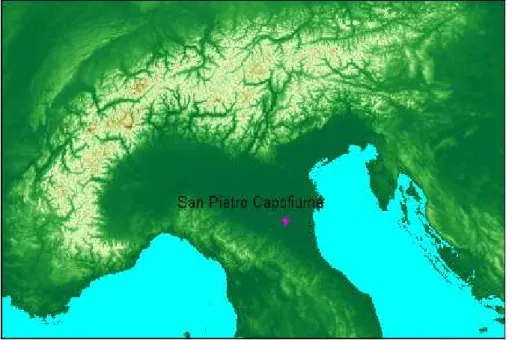
The San Pietro Capofiume (SPC) measurement station (44◦39′N, 11◦37′E) is located
at 11 m a.s.l., about 30 km northeast from the city of Bologna, in Po Valley (Fig. 1). The Po Valley lies between the Alps to the north and the Apennine Mountains to the
south-5
south-west. The Alp mountain chain, reaching elevations of well over 4000 m, extends from the west to east, acting as a protection barrier against the cold wind blowing from the north, giving rise to a climatic pattern different from that of Central Europe.
The Po Valley axis is prevalently oriented west-east: this maximizes the shading ef-fect of the mountains on the bottom of the valley, enhancing differences in radiation,
10
flow and turbulence over mountain slopes. The atmospheric circulation in the Po Val-ley is characterized by the strong modification of air flow due to high mountains (Alps and Apennines) that surround the valley on three sides. The dynamic effects of moun-tains also have a major impact on regional and local airflow patterns that impact the climate of adjacent regions. The surface properties and the presence of mountains
15
and sea in the area lead to the development of strong sea breezes, upslope winds, or the combination of the two, depending on mountain/coast orientation. The complex airflow configuration in the valley affects significantly the temporal and spatial variation of pollutant concentrations.
The local atmospheric circulation features, dominated by calm and weak winds, often
20
favour the development of critical pollution episodes (Finardi and Pellegrini, 2004). During winter the Westerlies are associated with the subpolar low pressure zone which is located over the oceans just to the south of Greenland and the Aleutian Is-lands. The depression activity causes a variety of circulation patterns over South Eu-rope. Some of these patterns, generally accompanied by vertical atmospheric stability,
25
corresponding to temperature inversions and poor vertical mixing, are responsible for the accumulation of air pollutants, while others, as the northerly flow, do not favour
ACPD
6, 11209–11246, 2006
Relation of air mass history to nucleation events in Po Valley, Italy L. Sogacheva et al. Title Page Abstract Introduction Conclusions References Tables Figures ◭ ◮ ◭ ◮ Back Close Full Screen / Esc
Printer-friendly Version Interactive Discussion high pollutant concentrations. The Western Mediterranean Basin is better ventilated
due to the increased passage of traveling low pressure and their frontal systems. How-ever, as soon as anticyclonic conditions develop, air pollution can be trapped within industrialized valleys or in large, but confined air sheds (Millan, 2002).
Po Valley is densely populated, highly industrialized and known to have a relatively
5
high level of anthropogenic pollution. High levels of pollutants are reported for the Po Valley region (“Provincia Bologna, Pianificazionee gestione della qualit `a dell’aria nella provincia di Bologna, parte prima: Valutazione della qualita‘ dell’aria, 2003”, available at http://www.provincia.bologna.it/ambiente/). Mineral dust transportation episodes during the air mass transport from the North African source region (Ansmann et al.,
10
2003; Bonasoni et al., 2004) often happen, increasing significantly the particle con-centration. Another natural particulate source, sea spray, is involved in heterogeneous reactions with anthropogenic gaseous pollutants and may modify the processes lead-ing to gas to particulate conversion (O’Dowd et al., 1997, 2004).
3 Measurements of particle size distribution, gas concentrations and
meteoro-15
logical parameters
The particle size distribution measurements at SPC have been ongoing since March 2002 and cover the period of three years up to March 2005. The measurements were carried out using a twin Differential Mobility Particle Sizer (DMPS) system: the first DMPS measures particle size distributions between 3–20 nm and the second one
be-20
tween 15–600 nm (for details, see Hamed et al., 2006). In addition to particle size measurements, several gas and meteorological parameters are being measured at SPC, including SO2, NO, NO2, NOx, O3, temperature, relative humidity, wind direction, wind speed, global radiation, precipitation, and atmospheric pressure (Hamed et al., 2006).
25
ACPD
6, 11209–11246, 2006
Relation of air mass history to nucleation events in Po Valley, Italy L. Sogacheva et al. Title Page Abstract Introduction Conclusions References Tables Figures ◭ ◮ ◭ ◮ Back Close Full Screen / Esc
Printer-friendly Version Interactive Discussion
4 Classification of the new particle formation events
The processes of particle formation and growth depend on a combination of different factors, causing the intensity nucleation events to be variable. When the formation of new aerosol particles starts at (or near) the lowest measurable particle size (diame-ter 3 nm) and subsequent growth of the newly formed particles is observed for several
5
hours, a day is considered as a nucleation event day. The nucleation event classifica-tion used here is based on event clarity, i.e. the number concentraclassifica-tions of the freshly formed particles, and their formation and growth rates (for more details see Hamed et al., 2006). The nucleation event classes 1, 2 and 3 refer to strong, intermediate, and weak events, respectively. To minimize the uncertainty of the classification
subjectiv-10
ity, the weak class 3 events were excluded from some calculations, as will be detailed below.
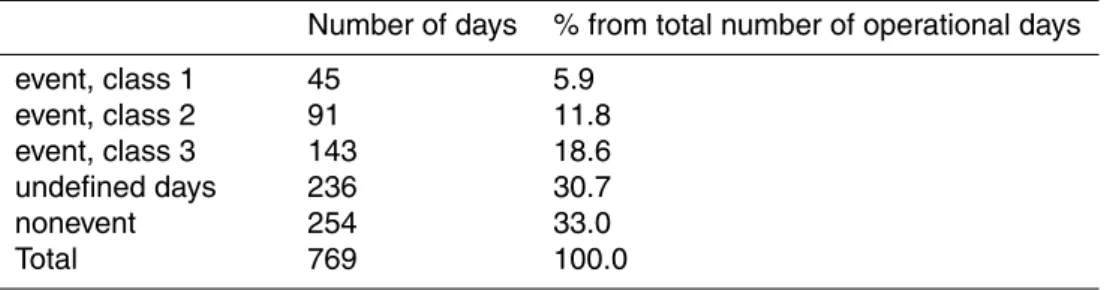
The days with no particle formation are classified as nonevent days. The days which do not follow strictly the event and nonevent classification are classified as class 0, or undefined days. Table 1 summarizes the numbers of nucleation event days (class 1,
15
2 and 3 events) undefined and nonevent days, as well as the frequencies (%) of the different types of days.
5 Backtrajectory analysis
To analyze the source and transport pathways of air masses arriving at SPC, a back tra-jectory analysis was done for the period of measurements using the HYSPLIT 4 model,
20
developed by NOAA/ARL (Draxler and Hess, 1998). HYSPLIT 4 is a single particle la-grangian trajectory dispersion model. The model runs were made using Global FNL meteorological archive with a spatial resolution of 191×191 km. The back trajectories were calculated typically 96 h backwards in time at 100-m arrival height above ground level between 08:00 and 20:00 UTC with 2-h resolution. However, in some calculations
25
ACPD
6, 11209–11246, 2006
Relation of air mass history to nucleation events in Po Valley, Italy L. Sogacheva et al. Title Page Abstract Introduction Conclusions References Tables Figures ◭ ◮ ◭ ◮ Back Close Full Screen / Esc
Printer-friendly Version Interactive Discussion start time (Hamed et al., 2006). Some trajectories were missing or shorter than 96 h in
duration, since the FNL archive data has some gaps when input meteorological data are not available.
Current literature suggest that the error accompanying HYSPLIT-generated trajecto-ries can be estimated to be anywhere from 15% to 30% of the travel distance (Stohl,
5
1998; Draxler and Hess, 2004). The uncertainty increases with the length of transport, and the horizontal uncertainty four days before the arrival at SPC can reach several hundreds of kilometers. However, individual trajectories may have much larger errors, especially since the model topography and the real topography do not match exactly. Another potential source of uncertainty is due to the regions of near-zero wind velocity
10
which were encountered in many of trajectories (Stohl et al., 1995). For the purposes of the present paper, the accuracy of back trajectory calculations is sufficient to reveal the differences in nucleation event frequencies for air masses of different types and history.
6 Air mass transport direction
15
To estimate the air mass main transport direction to SPC for different seasons and the whole year we calculated the frequency of the location of the reference (12, 24, 48, 76, and 96 h) back points in 60◦degree sectors: north-east (NE), east (E), south-east (SE),
south-west (SW), west (W), and north-west (NW). Also for each sector we calculated the mean traveling distance between reference back points to estimate the air mass
20
traveling distance at different path sections.
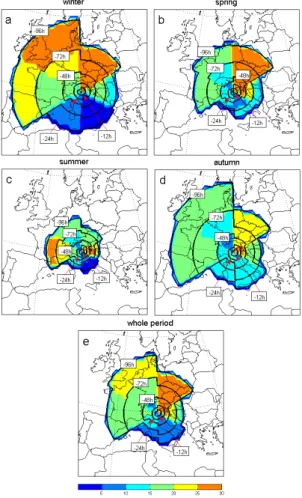
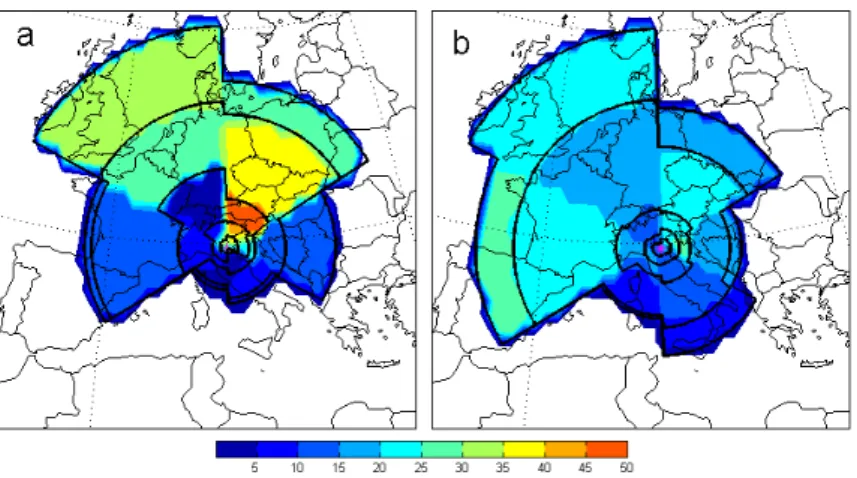
At SPC the prevailing W to NE atmospheric flows are clearly seen (Fig. 2). More than 40% of the air masses arriving at SPC in winter (Fig. 2a) have been originated or passed over Atlantic and Central Europe. The air mass transport distance is highest in that direction compared to other sectors. The velocity of air parcel decreases towards
25
arrival point due to the increasing influence of the surface roughness. The fraction of air flows originating from over the Western Europe was about 20–25%. The frequency
ACPD
6, 11209–11246, 2006
Relation of air mass history to nucleation events in Po Valley, Italy L. Sogacheva et al. Title Page Abstract Introduction Conclusions References Tables Figures ◭ ◮ ◭ ◮ Back Close Full Screen / Esc
Printer-friendly Version Interactive Discussion of trajectories coming from over Russia and the Central Europe was much lower and
the distance traveled is on average much shorter than for air masses coming from the NW. However, baric systems and consequently the transport directions at each specific moment can be essentially different from those estimated by averaging. Local wind directions can also differ from prevailing directions under the impact of the local
5
features.
In early spring, the high pressure conditions become more favourable, forcing the low pressure belt to the north. The amount of global radiation at SPC increases con-siderably compared to winter period (Hamed et al., 2006). Sahara brings forth dry hot air that expands across Mediterranean Sea northwards to the Alps and covers Italy.
10
However the frequencies of the SE to SW transport directions (Fig. 2b) remains low (up to 15%). The travel distance decreases in all directions but the NE, which remains to be the prevailing direction in air mass transport. More than 25% of trajectories arrive from that direction. Originating in the Eurasian land-mass, the predominant air mass contains little moisture, and as it passes from cooler to hotter regions the water carried
15
along is evaporated more rapidly than local cloud-forming eddies can condense it. Subtropical high pressure zone is dominated in summer. Subsiding air creates in anticyclonic circulation stable atmospheric conditions, suppressing cloud development and precipitation. The cloudless conditions commonly experienced during both the daytime and the night cause significant heat gain and loss over the course of day.
20
As a result the climate experiences a large daily temperature range during summer. The travel distance of air mass is shortest in summer (Fig. 2c) compared to other seasons in all the directions. The frequency of local wind low speed conditions (<2 m/s) is significant for that period (Hamed et al., 2006). The influence of the underlying territories to the air mass properties is strongest during that season.
25
In autumn the high pressure belts drift back towards the equator, and the weather becomes more dominated by the rain-bearing low/pressure depression. The transport distance increases in north-west direction, whereas the distribution of the trajectories in all sectors becomes more uniform (Fig. 2d). However, the west to northeast sectors
ACPD
6, 11209–11246, 2006
Relation of air mass history to nucleation events in Po Valley, Italy L. Sogacheva et al. Title Page Abstract Introduction Conclusions References Tables Figures ◭ ◮ ◭ ◮ Back Close Full Screen / Esc
Printer-friendly Version Interactive Discussion still have the highest (15 to 25%) frequency.
Thus, during the whole period of measurements (Fig. 2e) the W, NW and NE air mass directions prevail and make up from 15% to over 25% frequency. The frequency of SE and SW direction is lower (below 10%).
7 Meteorology along the trajectory
5
While meteorological conditions favouring the new particle formation at SPC are rel-atively well understood (Hamed et al., 2006), the air mass properties at the recipi-ent and along the trajectory for evrecipi-ent end nonevrecipi-ent days are much less well char-acterized. Vertical position of the air parcel, mixed layer depth, as well the air par-cel properties along the trajectory such as relative humidity, ambient temperature,
10
and rain were calculated by HYSPLIT trajectory model using the global FNL archive (http:www.arl.noaa.gov/ss/transport/archives.html). The 6-hourly FNL archive data are generated by the NCEP GDAS (National Centers for Environmental Prediction Global Data Assimilation System) wind field reanalysis. GDAS uses the spectral medium range forecast (MRF) model for the prognoses. The FNL database contains basic
15
fields such as the u- and v-wind components, temperature, and humidity at 13 vertical levels, from surface to 20 hPa.
For estimation of water content, which is an essential property affecting aerosol par-ticle condensation and deposition processes (e.g. Vesala et al., 1997), we calculated the absolute humidity along the trajectory for each back point. We also calculated the
20
vertical and horizontal speed of air parcel to estimate the influence of the underlying areas to air parcel properties.
The identification of the air mass properties favourable for the episodes of new particle formation is important for understanding the processes leading to that phe-nomenon. The air mass main properties, such as temperature and humidity, are
es-25
tablished while the air was originated over a particular region of the earth’s surface (airmass source region), and undergo specific modifications while it transits away from
ACPD
6, 11209–11246, 2006
Relation of air mass history to nucleation events in Po Valley, Italy L. Sogacheva et al. Title Page Abstract Introduction Conclusions References Tables Figures ◭ ◮ ◭ ◮ Back Close Full Screen / Esc
Printer-friendly Version Interactive Discussion the source region to the recipient. The acquired additional attributes, in turn, depend
on properties of the transition region and the duration the air mass spent over that re-gion. The specific character of the transition regions may result in drastic changes of air mass properties even if they were originated over the same region.
However, the vertical distributions of the meteorological parameters also influence
5
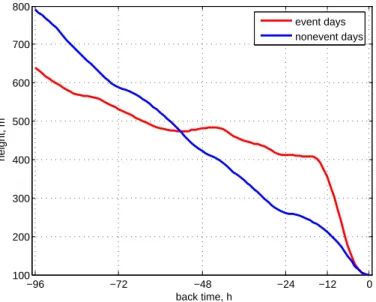
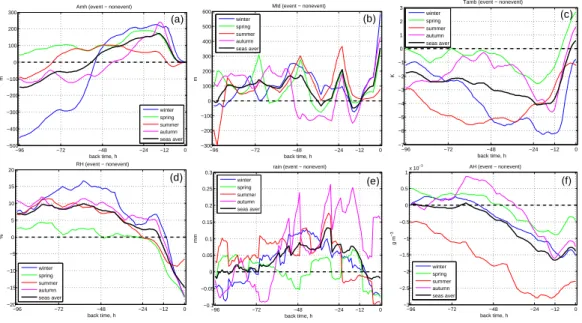
the air parcel properties. Stronger compare with nonevent cases subsidence of air parcel during on average last 12–18 h before the arrival at the SPC (Fig. 3) foregoes nucleation particle formation event and clarifies the difference in the behaviour of sev-eral meteorological parameters, such as air mass height (Amh), mixed layer depth (Mld), relative humidity (RH), rain (R), absolute humidity (AH), and ambient
tempera-10
ture (Tamb) (Fig. 4).
For all the seasons but for spring, the “event” air parcel , arrived at SPC during the event day, starts on average to subside at its point of origin (96 h back before the arrival) from lower height, compared to “nonevent” air parcel (Fig. 4a). The maximum (up to 450 m) difference between the event and nonevent air parcel height at point
15
of origin is observed in winter. However, event parcels have a lower vertical velocity compared to nonevent parcels up to approximately 12 h before the arrival, and therefore the average Amh difference reverses at some point (between 77 h back point in summer and 42 h back point in autumn) and event parcels travel further to SPC higher up than nonevent parcels. About 12 h before the arrival, a strong subsidence of the event air
20
parcel starts, which may correspond to post-frontal synoptic situation or anticyclone weather type, clear sky conditions, when the temperature vertical gradient if higher and as a consequence the velocity gradient increases. Subsidence warms the air by compression. Any clouds present quickly evaporate as the temperature of the air rises above its dew point. For this reason, anticyclones usually bring fine, dry and settled
25
weather, particularly in the summer.
Mixing in the boundary layer around noon is stronger along the event compared to nonevent trajectories. Except for summer, the amplitude of the difference in Mld between event and nonevent trajectories becomes higher on the way to recipient and
ACPD
6, 11209–11246, 2006
Relation of air mass history to nucleation events in Po Valley, Italy L. Sogacheva et al. Title Page Abstract Introduction Conclusions References Tables Figures ◭ ◮ ◭ ◮ Back Close Full Screen / Esc
Printer-friendly Version Interactive Discussion is about 350 m at SPC on seasonal average (Fig. 4b). In winter the difference in Mld
between event and nonevent days reaches at more than 600 m.
Ambient temperature of the air parcel (Fig. 4c) is lower for event trajectories along the whole air parcel path, except for several (up to 10) hours before arrival to SPC. This corresponds well to the strong subsidence of event air parcel during the last 12 h
5
of its way. On seasonal average, the air mass temperature during event days is about 0.5◦
higher compared to nonevent air mass temperature. The temperature difference reaches a maximum value in spring (2.7◦), whereas in winter and in summer the event
air mass is about 1◦colder compared to nonevent air masses.
Difference in relative humidity (Fig. 4d) behaves opposite to the ambient temperature
10
difference. It is about 5 to 10% higher along event trajectories on seasonal average. The difference in RH is smaller (less than 5%) in spring and a little higher in winter (up to 15%). As it was mentioned before, strong subsidence of air parcel together with the temperature increase makes the air parcel dryer during the event days. Note that the behavior of absolute humidity (see below) also affects RH.
15
The mean for event and nonevent days meteorological parameters, such as Tamb and RH, calculated by Hysplit 4 model at the recipient show a good agreement to the measurements of temperature and RH at the SPC station, however model calcu-lation may have significant deviation from the measured value mainly due to the low (190×190 km) resolution of the model. The temperature at the station at 10:00 UTC
20
was higher for event days in all the seasons but in summer, when no significant dif-ference between event and nonevent days was observed (Hamed et al., 2006). The RH at the station was much lower during event days in all the seasons but in summer, when the difference between event and nonevent days was much smaller. The same tendency is clearly seen in Fig. 4c.
25
The rain conditions leading to washout of water-soluble gases and aerosols (Floss-mann, 1985) are presented in Fig. 4e. Precipitation occurred more often along the event trajectories, whereas during the last 12 h of the path the precipitation along the event trajectories except for autumn was close to 0 (not shown here).
ACPD
6, 11209–11246, 2006
Relation of air mass history to nucleation events in Po Valley, Italy L. Sogacheva et al. Title Page Abstract Introduction Conclusions References Tables Figures ◭ ◮ ◭ ◮ Back Close Full Screen / Esc
Printer-friendly Version Interactive Discussion Being slightly higher for event trajectories at 96 h back point, absolute humidity
(Fig. 4f) decreases compared to nonevent cases at a distance, close to where the difference in rain along the back trajectory between event and nonevent days for dif-ferent seasons becomes positive. Minor decrease in difference is observed during the last 12 h before the arrival.
5
Thus, the meteorological conditions along the air parcel trajectory differ considerably during approximately two days before the arrival. The difference between event and nonevent trajectories, which can be explained by the distinction in air parcel subsidence intensity, becomes more significant during the last 12 h before the air parcel arrives to the measurement station. The subsidence causes sharp temperature increase and RH
10
decrease.
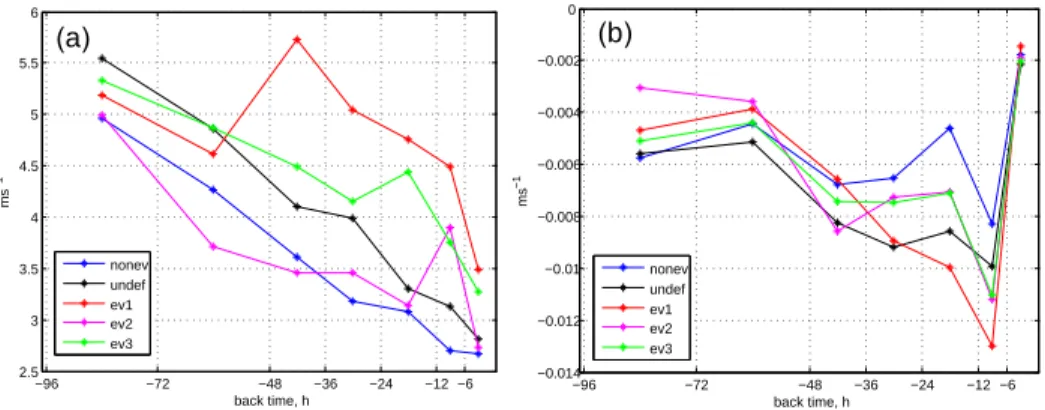
Having found the difference in traveled distance and in subsidence height between event and nonevent trajectories, we calculated the average horizontal and vertical ve-locities of air parcels for event classes 1 to 3, nonevent and undefined days trajectories to estimate if there is any dependence between intensity of particle formation and the
15
velocity of air parcel, which indicates how fast the air parcel properties change along the trajectory.
Median horizontal velocity (Fig. 5a) decreases in the direction to the recipient from the origin point of trajectory to one day before the arrival for all the groups of days but for event class 1 days, when the horizontal velocity increases from 4.6 m/s in time
20
sector 48–72 h before the arrival to 5.7 m/s in time sector 36–48 h before the arrival. The decreasing of the horizontal velocity is due to the increasing of surface roughness and friction velocity in the direction from the Atlantic and North Europe to the central part of Europe, which is the most favourable air mass transport direction. During the last day before the arrival the increasing of horizontal velocity is also observed for event
25
classes 2 and 3 trajectories, while air parcel velocity decreases monotonously along the nonevent and undefined trajectories.
Median vertical velocity (Fig. 5b) does not change a lot for the period between 48 and 96 h, but increases sharply during the last 6 to 48 h before the arrival which is due to the
ACPD
6, 11209–11246, 2006
Relation of air mass history to nucleation events in Po Valley, Italy L. Sogacheva et al. Title Page Abstract Introduction Conclusions References Tables Figures ◭ ◮ ◭ ◮ Back Close Full Screen / Esc
Printer-friendly Version Interactive Discussion air parcel subsidence. The strongest vertical velocity (−0.013 m/s) is observed in event
class 1 trajectories in a time period of 6–12 h, when event class 2 and 3 trajectories also show higher values than undefined and nonevent trajectories.
8 Probability of aerosol particle formation events
The analysis of the nucleation event probability at SPC as a function of the air mass
5
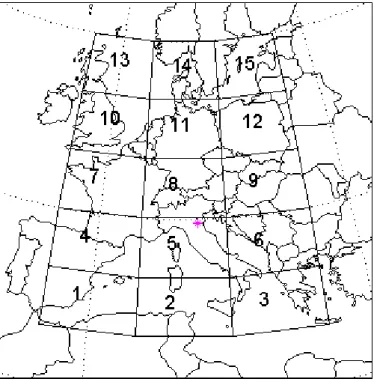
origin and history (48 h before arrival to the recipient) was done for the area limited by 35◦N and 60◦N in latitude and 5◦W and 25◦E in longitude. This area was divided into
15 sub-areas of 10◦
×5◦ in longitudinal and latitudinal direction, respectively (Fig. 6). We considered that the accuracy of the trajectory calculations is within the size of the sub-area. Such a division allows estimation of the influences of small scale regions
10
traversed by the air masses to nucleation events at SPC, and make conclusions on synoptic scale (Central Europe, Eastern Europe and Atlantic) regions impact to aerosol particle formation.
In the present investigation the air parcel passing over several sub-areas (s) has been registered in each sub-area where the trajectory passed. However the
contribu-15
tion of the sub-area to air mass properties depends on how long the air parcel traveled over the corresponding area. In Sogacheva et al. (2005), each passage of a trajectory through a given subarea was registered with equal weight. Here we refine this calcula-tion by weighting a trajectory passage through a subarea with the trajectory residence time (τe,s and τne,s) in that subarea, which provides an indication of the fractional time
20
spent in a specific sub-area relative to total time spent in the domain by air parcels for combined event classes 1 and 2 (evs) and for nonevent (nevs) trajectories, respectively:
evs = e X 1 1 τe,s (1) 11222
ACPD
6, 11209–11246, 2006
Relation of air mass history to nucleation events in Po Valley, Italy L. Sogacheva et al. Title Page Abstract Introduction Conclusions References Tables Figures ◭ ◮ ◭ ◮ Back Close Full Screen / Esc
Printer-friendly Version Interactive Discussion nevs= n X 1 1 τn,s, (2)
where e, n− are numbers of event and nonevent trajectories for sub-area s, respec-tively.
For each sub-area the probability Ps of event trajectories as a function of event and
nonevent trajectories has been calculated as:
5
Ps = evs
evs+ nevs. (3)
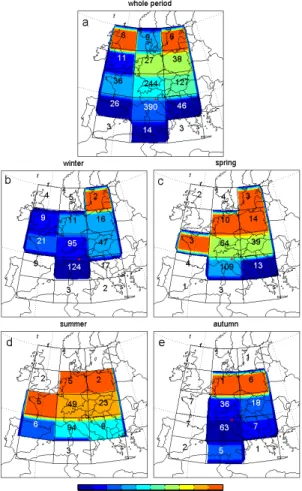
The probability of particle formation events as a function of the origin and history of air masses arrived at SPC is shown in Fig. 7. The numbers in the sectors indicate the total number of event (only classes 1 and 2 are included) and nonevent trajectories, passed over the corresponding sub-area. The number in sector 5 is the total number of event
10
class 1 and 2 and nonevent trajectories, arrived at SPC. On seasonal average (Fig. 7a) the highest (more than 0.9) probability of new particle formation events at the mea-surement station was observed in northern atmospheric flow, in air masses originated over the North Sea and Baltic Sea regions (sub-areas 13 and 15, respectively). A high probability (more than 0.6) is observed for air masses originated and passed over north
15
and north-eastern Europe, i.e. regions with a lot of anthropogenic sources of gaseous pollutants. In these areas the contribution of particles directly emitted by combustion processes and produced by photochemical reactions is very important (Bowman et al., 1995). The lowest probability of nucleation events (less than 0.1) is observed in air masses which reach SPC in other than northern atmospheric flows (sub-areas 1 to
20
4 and sub-area 6). However, southern transport of the air to SPC is observed sel-dom compared to other directions (Fig. 3). The northern atmospheric flow is the most favourable for new particle formation at SPC during all the seasons, though the portion of event trajectories in some sub-areas may changes considerably from winter-autumn to spring-summer seasons.
ACPD
6, 11209–11246, 2006
Relation of air mass history to nucleation events in Po Valley, Italy L. Sogacheva et al. Title Page Abstract Introduction Conclusions References Tables Figures ◭ ◮ ◭ ◮ Back Close Full Screen / Esc
Printer-friendly Version Interactive Discussion In winter, when the monthly frequency of nucleation events was the lowest compared
to other seasons (Hamed et al., 2006), the Baltic Sea was the single subarea, for which only event trajectories have been registered (Fig. 7b). The probability of event trajectories in other northern sub-areas was very low (less than 0.4). No nucleation events have been observed at SPC during southern air mass transport in winter.
5
In spring (Fig. 7c) all the trajectories originating over the Baltic Sea, Poland, Germany and north-west Spain were event trajectories. The portion of event trajectories passed over central Europe was also high (more than 0.6). In summer (Fig. 7d) the probability distribution was close to that in the spring, however the portion of event trajectories passed over central Europe was higher (up to 0.9).
10
In autumn (Fig. 7e), when the aerosol instrument at SPC has malfunctioned the most (47% operational days in autumn compared to 91% in winter, 76% in spring and 68% in summer), the probability of event trajectories in sub-areas 11 and 12 was the highest (equal to unity), whereas for the other sub-areas it was very low (less than 0.3). No event trajectories were observed in western air flow.
15
9 Sulphur dioxide potential sources
Hamed et al. (2006) reported that SO2 concentrations were observed to be higher on event days comparing with nonevent days. As sulphuric acid has been suggested to be the key species causing nucleation events (e.g. Kulmala et al., 2000, 2006), we decided to investigate the location of the distant and local emission sources which may
20
contribute to particle formation at SPC. Using back trajectories we aimed to estimate how big fraction of SO2from European emission sources can be transported to SPC.
Sulphur dioxide, which is the predominant anthropogenic sulphur-containing air pol-lutant, is released to the atmosphere by various anthropogenic and natural sources, the major ones being fuel combustion, industrial processes, volcanoes, and DMS oxidation
25
(Davidson et al., 1996). SO2 reacts under tropospheric conditions via both gas- and aqueous-phase processes and is also removed physically via dry and wet deposition
ACPD
6, 11209–11246, 2006
Relation of air mass history to nucleation events in Po Valley, Italy L. Sogacheva et al. Title Page Abstract Introduction Conclusions References Tables Figures ◭ ◮ ◭ ◮ Back Close Full Screen / Esc
Printer-friendly Version Interactive Discussion by the uptake of aerosols and clouds. With respect to gas-phase reaction, oxidation
of SO2 by OH radical is dominant (Stockwell and Calvert, 1983). The lifetime of SO2 based on the reaction with the OH radical, at typical atmospheric levels of OH, is about 10 days, while in cloud-phase reactions lifetime decreases to as low as several hours (Porter et al., 2002).
5
The combination of mesoscale circulations and local emissions strongly influence the spatial distribution of SO2. As shown in Figs. 8 and 9, before arrival to SPC, a large
fraction of event trajectories pass over Central Europe which remains a strong source of anthropogenic emissions. In our studies we focused on the estimation of how often the trajectories, divided to several groups according to event classification (nonevent,
10
classes 1 and 2), passed over the SO2 emission sources calculated by EMEP model (http://www.emep.int/).
The mean frequency and the mean travel distance for event class 1 and 2 trajectories and nonevent trajectories are shown on Fig. 8. The big fraction of event trajectories ar-rive at SPC from north-east direction, passing over Poland, Slovakia, Check Republic,
15
eastern part of Germany about three to four days before the arrival and passing over Slovenia at about one to two days before the arrival (Fig. 8a). The distribution of non-event trajectories on the directions limited by 60◦sectors is more uniform (Fig. 8a). The
fraction of north-eastern nonevent trajectories is less compared to event trajectories, whereas the fraction of western trajectories, which identify the transport of air masses
20
from Atlantic over France, increases.
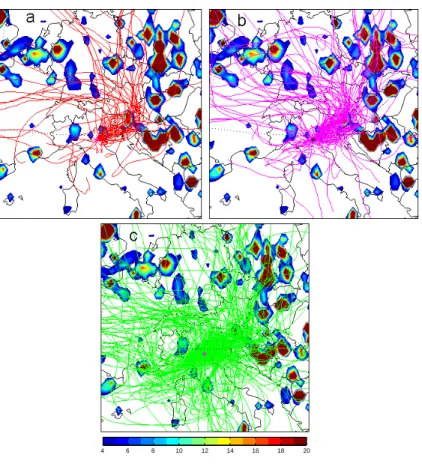
In the Fig. 9 we present the SO2 emissions and the air parcel trajectories for event
classes 1 and 2 (Figs. 9a and b, respectively) and nonevent days (Fig. 9c), observed at SPC. It is clearly seen that many of the event trajectories passed on their way to SPC the SO2 emission source over Slovenia, which has intensity more than 20 Tg year−1
25
and SO2emission source in Veneto(up to about 15 Tg year−1).
In order to investigate SO2transport to SPC, we calculated the potential (cumulative) SO2 concentration along the trajectory for periods the air parcel was within the mixed
ACPD
6, 11209–11246, 2006
Relation of air mass history to nucleation events in Po Valley, Italy L. Sogacheva et al. Title Page Abstract Introduction Conclusions References Tables Figures ◭ ◮ ◭ ◮ Back Close Full Screen / Esc
Printer-friendly Version Interactive Discussion
i, traveled by the air parcel, SO2 emission flux (Mg year−1) was converted to SO2
concentration ci (µg m−3), taking into account the residence time of the air parcel in
the corresponded grid area and mixed layer depth. To get the air parcel residence time in a 0.5◦
×0.5◦ grid area we interpolated the trajectory 1-hour back points to 0.5◦×0.5◦ grid, corresponding to EMEP emission data.
5
The cumulative SO2 concentration Ccum was calculated as a sum of ci concentra-tions over i areas, traveled by the air parcel during time ti. The effect of SO2 removal
from the air parcel on Ccum was taken into account using the parameter τ, which is
considered being an analog to SO2lifetime. Thus,
Ccum= i X 1 ci · exp−ti τ . (4) 10
In the initial calculations τ was considered as a lifetime due to dry and wet deposition processes (10 days and 1.8 days, respectively), but because other processes, which may influence SO2 concentration (especially dilution due to mixing with cleaner air)
were not taken into account, Ccum concentration differed from measured SO2 values
considerably. To improve the agreement we decided to treat τ as an adjustable
param-15
eter, describing the effective decay timescale of SO2 in the air parcel, in order to find
the best fit of Ccumto SO2concentration value measured at the station.
As expected, the correlation between modeled and measured SO2 concentrations was very low at all values of τ. Reasons for this includes the annual averaging of EMEP data, which conceals the well defined seasonal cycle with a winter maximum
20
and summer minimum. Moreover, the accuracy of the trajectory analysis decreases in case of difficult meteorological conditions and over the complex terrain, as discussed above. It should also be kept in mind that τ is a parameter that describes removal and dilution processes in an averaged and simplified manner. Thus, rather than trying to determine τ based on direct correlations, we looked for the τ value that best
repro-25
duces the statistical frequency distribution of the measured SO2 concentrations. The
ACPD
6, 11209–11246, 2006
Relation of air mass history to nucleation events in Po Valley, Italy L. Sogacheva et al. Title Page Abstract Introduction Conclusions References Tables Figures ◭ ◮ ◭ ◮ Back Close Full Screen / Esc
Printer-friendly Version Interactive Discussion best agreement was found with τ=24 h. As shown in Fig. 10, the modeled and
mea-sured distributions are reasonably similar for the most part. The meamea-sured distribution shows a tail of very high SO2 values absent from the modeled distribution. One
pos-sible explanation for these high values are instances when the measurement station is influenced by a plume from a local strong emission source directly upwind (Wang
5
et al., 2006). In any case, only a small minority of measured SO2 values represents
high concentrations larger than about 15 µg m−3, and we therefore believe that our
sim-ple transport modeling with τ=24 h reproduces the measured SO2concentration range
reasonably well.
Chin et al. (2000a) reported that in global models of atmospheric sulfur cycle
sim-10
ulation SO2lifetime is taken in the size range of 1.8 to 2.6 days that is about 2 to 2.5 times higher compared to the parameter τ in our calculations. However, the model agrees within 30% with the regionally averaged sulfate concentration measured over North America and Europe but overestimates the SO2 concentrations by more than a factor of 2 there (Chin et al., 2000b).
15
We also estimated how much of SO2can be transported to the recipient when τ is
taken to be 24. For each trajectory j we considered the traveled 0.5×0.5◦ area i with
concentration c0,i ,j, and calculated cr,i ,j, which is the concentration that remains in the
atmosphere after time ti ,j
cr,i ,j = c0,i ,j× exp(−ti ,j
24 ), (5)
20
where ti ,j is the travel time of the air parcel j from the source area i to the recipient. Afterwards we calculated c%,i ,j, which is a fraction of the transported concentration
to the concentration over the area i
c%,i ,j = cr,i ,j
c0,i ,j. (6)
For each area i we calculated c%,i, which is the mean fraction of the concentration,
ACPD
6, 11209–11246, 2006
Relation of air mass history to nucleation events in Po Valley, Italy L. Sogacheva et al. Title Page Abstract Introduction Conclusions References Tables Figures ◭ ◮ ◭ ◮ Back Close Full Screen / Esc
Printer-friendly Version Interactive Discussion transported from the area to the recipient
c%,i = j P 1 c%,i ,j j . (7)
The preliminary analysis of the contribution of different SO2 source areas to the
con-centration at SPC (Fig. 11) shows that more than 40% of the emissions over the Po Valley reach SPC, whereas the fraction of European SO2emissions which can be
ob-5
served at SPC is 10% to 30% on average. That means that the less distant SO2source
regions seem to be more important for the SO2 concentration measured at SPC than
the emission sources in the Central Europe. Also the increase (decrease) of SO2 emis-sions in Po Valley will change the concentration at the station considerably compared to the SO2emission changes over Europe.
10
However, the real contribution depends not only on how big fraction of the emission can be transported, but also on the initial concentration of SO2 in the source areas.
Having estimated the mean concentration for 0.5×0.5◦ area from EMEP emissions
fluxes data and mixing layer height (Hysplit 4 output for the trajectories), we calculated how much of SO2can be transported on average to the SPC from different areas. The
15
results (Fig. 12) show, that even if the fraction of SO2transported from the Central and
Eastern Europe is less than 20% (Fig. 10), the contribution of strong emission sources nevertheless remains noticeable (up to more than 2 µg m−3
from 0.5×0.5◦ area).
10 Conclusions
Air parcel trajectories have been analyzed to investigate the history of air masses and
20
possible link between the air masses history and new particle formation events at San Pietro Capofiume measurement station, Po Valley, Italy. By means of trajectory anal-ysis the SO2emission sources in Europe have been estimated as a potential sources
influencing SO2concentration at SPC.
ACPD
6, 11209–11246, 2006
Relation of air mass history to nucleation events in Po Valley, Italy L. Sogacheva et al. Title Page Abstract Introduction Conclusions References Tables Figures ◭ ◮ ◭ ◮ Back Close Full Screen / Esc
Printer-friendly Version Interactive Discussion Westerly to north-easterly air mass transport occurs more frequently in all the
sea-sons. Due to low pressure zone activity, horizontal transport is much stronger in winter compared to summer. The velocity of air parcel decreases towards arrival point due to the increasing influence of the surface roughness.
With rare exception, mixed layer depth is higher along the event trajectories.
How-5
ever, such parameters as temperature and relative humidity, which along with origin are determined by the elevation of the air parcel, have a reversal differences between event and nonevent trajectories. We found that, on average, event trajectories undergo stronger subsidence than nonevent trajectories during the last 12 h before the arrival at SPC; the amplitude of the increasing of vertical velocity for event class 1 trajectories
10
is the highest. Higher temperature, lower rain, relative and absolute humidity are also typical for event trajectories.
Nucleation events occur more frequently in air masses arriving form Central Europe, whereas event frequency is much lower in the air transported from both southern di-rections and the Atlantic Ocean. The SO2emission sources in Europe have been
con-15
sidered as potential sources influencing SO2 concentration at SPC. Trajectories often
pass over the polluted (SO2) Slovenia region and over the Veneto emission sources, east from the station.
Po Valley SO2 source regions seem to be more important in its contribution to the
concentration at SPC than the emission sources in the Central Europe. However,
con-20
tribution of strong emission sources over the Central and Eastern Europe nevertheless is non-negligible.
References
Ansmann, A., B ¨osenberg, J., Chaikovsky, A., Comer ´on, A., Eckhard, S., Eixman, R., Freuden-thaler, V., Ginoux, P., Komguem, L., Linn ´e, H., M ´arquez, M. ´A., Mattis, I., Mitev, V., M ¨uller,
25
D., Music, S., Nickovic, S., Pelon, J., Sauvaeg, L., Sobolevsky, P., Srivastsva, M. K., Stohl, A., Torre, O., Vaughan, G., Wandinger, U., and Wiegner, M.: Long-range transport of
Saha-ACPD
6, 11209–11246, 2006
Relation of air mass history to nucleation events in Po Valley, Italy L. Sogacheva et al. Title Page Abstract Introduction Conclusions References Tables Figures ◭ ◮ ◭ ◮ Back Close Full Screen / Esc
Printer-friendly Version Interactive Discussion
ran dust to northern Europe: The 1–16 October 2001 outbreak observed with EARLINET, J. Geophys. Res., 108, 4782, doi:10.1029/2003JD003757, 2003.
Balkanski, Y., Bauer, S. E., van Dingenen, R., Bonasoni, P., Shultz, M., Fisher, H., Gobbi, G. P., Hanke, M., Hauglustain, D., Putaud, J. P., Stohl, A., and Raes, F.: The Mt. Cimone, Italy, free Tropospheric campaign: principal characteristics of the gaseous and aerosol composition
5
from European pollutions, Mediterranean influence and during African dust events, Atmos. Chem. Phys. Discuss., 3, 1753–1776, 2003.
Bert `o, A., Buzzi, A., and Zardi, D.: Back-tracking water vapour contributing to a precipitation event over Trentino: a case study, Meteorologishe Zeitschrift, 13(3), 189–200, 2004.
Bonasoni, P., Stohl, A., Cristofanelli, P., Calzolari, F., Colombo, T., and Evangelisti, F.:
Back-10
ground ozone variations at Mt. Cimone station, Atmos. Environ., 34, 5183–5189, 2000. Bonasoni, P., Cristofanelli, P., Calzolari, F., Bonaf `e, U., Evangelisti, F., Stohl, A., Zauli Sajani,
S., van Dingenen, R., Colombo, T., and Balkanski, Y.: Aerosol-ozone correlation during dust transport episode, Atmos. Chem. Phys., 4, 1201–1215, 2004.
Bouman, F. M., Pilinis, C., and Seinfeld, J. H.: Ozone and aerosol productivity of reactive
15
organics, Atmos. Environ., 29, 579–589, 1995.
Chin, M., Rood, R. B., Lin, S.-J., M ¨uller, J.-F., and Thompson, A. M.: Atmospheric sulfur cycle simulated in the global model GOCART: Model description and global properties, J. Geo-phys. Res., 105(D20), 24 671–24 687, 2000a.
Chin, M., Savoie, D. L., Huebert, B. J., Bandy, A. R., Thronton, D. C., Bates, T. S., Quinn, P.
20
K., Saltzman, S. C., and De Bruyn, W. J.: Atmospheric sulfur cycle simulated in the global model GOCART: Comparison with field observation and regional budgets, J. Geophys. Res., 105(D20), 24 689–24 712, 2000b.
Davidson, B., O’Dowd, C., Hewitt, C. N., Smith, M. H., Harrison, R. M., Peel, D. A., Wolf, E., Mulvaney, R., Schwikowsky, M., and Baltensperger, U.: Diethyl sulfide and its oxidation
25
products in atmosphere of Atlantic and Southern oceans, Atmos. Environ., 30, 1895–1906, 1996.
Draxler, R. and Hess, G. D.: An overview of the HYSPLIT 4 modeling system for trajectories, dispersion and deposition, Australian Meteorological Magazine, 47, 295–308, 1998.
Draxler R. R. and Hess, G. D.: Description of the HYSPLIT 4 Modeling System, NOAA
Techni-30
cal Memorandum ERL ARL-224, 2004.
Finardi, S. and Pellegrini, U.: Systematic analysis of meteorological conditions causing severe urban air pollution episodes in the central Po Valley, 9t Int. Conf. on Harmonization within
ACPD
6, 11209–11246, 2006
Relation of air mass history to nucleation events in Po Valley, Italy L. Sogacheva et al. Title Page Abstract Introduction Conclusions References Tables Figures ◭ ◮ ◭ ◮ Back Close Full Screen / Esc
Printer-friendly Version Interactive Discussion
Atmospheric Dispersion Modeling for Regulatory Purposes, 250–254, 2004.
Flossmann, A. I.: A theoretical study of the wet removal of atmospheric pollutants. Part I: the redistribution of aerosol particles captured through nucleation and impaction scavenging by growing cloud drops, J. Atmos. Science, 42, 583–606, 1985.
Hamed, A., Joutsensaari, J., Mikkonen, S., Sogacheva, L., Dal Maso, M., Kulmala, M.,
Cav-5
ali, F., Facchini, M. C., Decesari, S., Mircea, M., Lehtinen, K. E. J., and Laaksonen, A.: Nucleation and growth of new particles in Po-Valley, Italy, Atmos. Chem. Phys. Discuss., 6, 9603–9653, 2006.
Kruger, B. C., Kroger, H., Wotawa, G., and Kromp-Kolb, H.: Lagrangian Photochemical Model calculations for the Milan area, in: Proc. EURTRAC-2 Symposium 2000, edited by: Midgley,
10
P. M., Reuther, M., and Williams, M., Springer Verlag, Berlin, 2000.
Kulmala, M., Rannik, ¨U., Pirjola, L., Dal Maso, M., Karim ¨aki, J., Asmi, A., J ¨appinen, A., Karhu, V., Korhonen, H., Malvikko, S.-P., Puustinen, A., Raittila, J., Rommakaniemi, S., Suni, T., Yli Koivisto, S., Paatero, J., Hari, P., and Vesala, T.: Characterization of atmospheric trace gas and aerosol concentrations at forest sites in southern and northern Finland using back
15
trajectories, Boreal Environ. Res., 5, 315–336, 2000.
Kulmala, M., Dal Maso, M., M ¨akel ¨a, J. M., Pirjola, L., V ¨akev ¨a, M., Aalto, P., Miikkulainen, P., H ¨ammeri, K., and O’Dowd, C.: On the formation, growth and composition of nucleation mode particles, Tellus 53B, 479–490, 2001.
Kulmala, M.: How particles nucleate and grow, Science, 302(7), 1000–1001, 2003.
20
Kulmala, M., Vehkam ¨aki, H., Pet ¨aj ¨a, T., Dal Maso, M., Lauri, A., Kerminen, V.-M., Birmili, W., and McMurry, P.: Formation and growth rates of ultrafine atmospheric particles: a review of observations, J. Aerosol Sci., 35, 143–176, 2004.
Kulmala, M., Lehtinen, K. E. J., and Laaksonen, A.: Cluster activation theory as an explana-tion of the linear dependence between formaexplana-tion rate of 3 nm particles and sulphuric acid
25
concentration, Atmos. Chem. Phys., 6, 787–793, 2006.
Laaksonen, A., Hamed, A., Joutsensaari, J., Hiltunen, L., Cavalli, F., Junkermann, W., Asmi, A., Fuzzi, S., and Facchini, M. C.: Cloud condensation nucleus production from nucleation events at a highly polluted region, Geophys. Res. Lett., 32, L06812, doi:10.1029/2004GL022092, 2005.
30
Millan, M. (Ed.): Ozone dynamics in the Mediterranean basin, Air Pollution Research Report 78, Collection of scientific papers resulting from MECAPIP, RECAPMA, and SECAP projects. European Commission and CEAM, La ImprentaComunication Grafica, Spain, 2002.
ACPD
6, 11209–11246, 2006
Relation of air mass history to nucleation events in Po Valley, Italy L. Sogacheva et al. Title Page Abstract Introduction Conclusions References Tables Figures ◭ ◮ ◭ ◮ Back Close Full Screen / Esc
Printer-friendly Version Interactive Discussion
O’Dowd, C. D., Smith, M. H., Consterdine, I. E., and Lowe, J. A.: Marine aerosol, sea-salt, and the marine sulphur cycle: a short review, Atmos. Environ., 31, 73–80, 1997.
O’Dowd, C. D., Facchini, M. C., Cavalli, F., Ceburnis, D., Mircea, M., Decesari, S., Fyzzi, S., Yoon, Y. J., and Putaud, J.-P.: Biogenically driven organic contribution to marine aerosol, Nature, 431, 676–680, 2004.
5
Pichlmayer, F., Sch ¨oner, W., Siebert, P., Stichler, W., and Wagenbach, D.: Stable isitipe analysis fro characterization of pollutants at high elevation Alpine sites, Atmos. Environ., 32, 4075– 4085, 1998.
Porter, J., Horton, K. A., Mouginis-Mark, P. J., Linert, B., Lau, E., Sutton, J., Elias, T., and Oppenheimer, C.: Sun photometer and lidar measurements of the plume from the Hawaii
10
Kilauea Volcano Pu’u ’O’o vent: Estimates of aerosol flux rates and SO2life time, Geophys. Res. Lett., 29, 16, doi:10.1029/2002GL014744, 2002.
Putaud, J.-P., Van Dingenen., R., Dell’Acqua, A., Raes, F., Matta, E., Decesari, S., Facchini, M. S., and Fuzzi, S.: Size-segregated aerosol mass closure and chemical composition in Monte Cimone (I) during MINATROC, Atmos. Chem. Phys., 4, 889–902, 2004.
15
Siebert, P., Kromp-Kolb, H., Kasper A., Kalina, M., Puxbaum, H., Jost, D. T., Schwikowski, M., and Baltensperger, U.: Transport of polluted boundary layer air from the Po valley to high alpine sites, Atmos. Environ., 32, 3953–3965, 1998.
Sogacheva, L., Dal Maso, M., Kerminen, V.-M., and Kulmala, M.: Probability of nucleation events and aerosol particle concentration in different air mass types arriving at Hyyti ¨al ¨a,
20
southern Finland, based on back trajectory analysis, Boreal Environ. Res., 10, 479–491, 2005.
Steinbacher, M., Dommen, J., Ordonez, C., Reimann, S., Gr ¨uebler, F. C., Staehelin, J., and Prevot, A. S. H.: Volatile organic compounds in the Po Basin. Part A: Anthropogenic VOC’s, J. Atmos. Chem., 51, 271–291, 2005a.
25
Steinbacher, M., Dommen, J., Ordonez, C., Reimann, S., Gr ¨uebler, F. C., Staehelin, J., Andtreani-Aksoyoglu, S., and Prevot, A. S. H.: Volatile organic compounds in the Po Basin. Part B: Biogenic VOC’s, J. Atmos. Chem., 51, 293–315, 2005b.
Stockwel, W. R. and Calvert, J. G.: The mechanism of the OH-SO2reactions, Atmos. Environ., 17, 2231–2235, 1983.
30
Stohl, A., Wotava, G., Siebert, P., and Kromp-Kolb, H.: Interpolation errors in wind fields as a function of spatial and temporal resolution and their impact on different types of kinematic trajectories, J. Appl. Meteorol., 34, 2149–2165, 1995.
ACPD
6, 11209–11246, 2006
Relation of air mass history to nucleation events in Po Valley, Italy L. Sogacheva et al. Title Page Abstract Introduction Conclusions References Tables Figures ◭ ◮ ◭ ◮ Back Close Full Screen / Esc
Printer-friendly Version Interactive Discussion
Stohl, A.: Computation, accuracy and applications of trajectories – a review and bibliography, Atmos. Environ., 32, 947–966, 1998.
Van Dingenen, R., Putaud, J.-P., Martin-Dos Santos, S., and Raes, F.: Physical aerosol proper-ties and their relation to air mass origin during the first MINATROC campaign, Atmos. Chem. Phys., 5, 2203–2226, 2005.
5
Vesala, T., Kulmala, M., Rudolf, R., Vrtala, A., and Wagner, P. E.: Models for condensational growth and evaporation of binary aerosol particles, J. Aerosol. Sci., 28(4), 565–598, 1997. Wang, P., Richter, A., Bruns, M., Burrows, J. P., Scheele, R., Junkermann, W., Heue, K.-P.,
Wagner, T., Platt, U., and Pundt, I.: Airbone multi-axis DOAS measurements of troposhperic SO2 plums in the Po-valley, Italy, Atmos. Chem. Phys., 6, 329–338, 2006.
10
Wotawa, G., Kr ¨oger, H., and Stohl, A.: Transport of ozone towards the Alps – results from tra-jectory analysis and photochemical model studies, Atmos. Environ., 34, 1367–1377, 2000.
ACPD
6, 11209–11246, 2006
Relation of air mass history to nucleation events in Po Valley, Italy L. Sogacheva et al. Title Page Abstract Introduction Conclusions References Tables Figures ◭ ◮ ◭ ◮ Back Close Full Screen / Esc
Printer-friendly Version Interactive Discussion
Table 1. Number of nucleation event days (class 1, 2 and 3), undefined and nonevent days, as
well as the frequencies (%) of the different types of days.
Number of days % from total number of operational days event, class 1 45 5.9 event, class 2 91 11.8 event, class 3 143 18.6 undefined days 236 30.7 nonevent 254 33.0 Total 769 100.0 11234
ACPD
6, 11209–11246, 2006
Relation of air mass history to nucleation events in Po Valley, Italy L. Sogacheva et al. Title Page Abstract Introduction Conclusions References Tables Figures ◭ ◮ ◭ ◮ Back Close Full Screen / Esc
Printer-friendly Version Interactive Discussion
ACPD
6, 11209–11246, 2006
Relation of air mass history to nucleation events in Po Valley, Italy L. Sogacheva et al. Title Page Abstract Introduction Conclusions References Tables Figures ◭ ◮ ◭ ◮ Back Close Full Screen / Esc
Printer-friendly Version Interactive Discussion
Fig. 2. Frequency (%, color) of the location of an air parcel in different direction sectors
be-tween the reference back time steps (contour line for −12 h, −24 h, −48 h, −72 h, −96 h) for the different seasons (a – winter, b – spring, c – summer, and d – autumn) and for the whole period of measurements (e). 11236
ACPD
6, 11209–11246, 2006
Relation of air mass history to nucleation events in Po Valley, Italy L. Sogacheva et al. Title Page Abstract Introduction Conclusions References Tables Figures ◭ ◮ ◭ ◮ Back Close Full Screen / Esc
Printer-friendly Version Interactive Discussion −96 −72 −48 −24 −12 0 100 200 300 400 500 600 700 800 back time, h height, m event days nonevent days
Fig. 3. Air parcel mean vertical height before the arrival at SPC for nucleation event (class 1
ACPD
6, 11209–11246, 2006
Relation of air mass history to nucleation events in Po Valley, Italy L. Sogacheva et al. Title Page Abstract Introduction Conclusions References Tables Figures ◭ ◮ ◭ ◮ Back Close Full Screen / Esc
Printer-friendly Version Interactive Discussion −96 −72 −48 −24 −12 0 −500 −400 −300 −200 −100 0 100 200 300
Amh (event − nonevent)
back time, h m winter spring summer autumn seas aver (a) −96 −72 −48 −24 −12 0 −300 −200 −100 0 100 200 300 400 500 600 Mld (event − nonevent) back time, h m winter spring summer autumn seas aver (b) −96 −72 −48 −24 −12 0 −7 −6 −5 −4 −3 −2 −1 0 1 2 3
Tamb (event − nonevent)
back time, h K winter spring summer autumn seas aver (c) −96 −72 −48 −24 −12 0 −20 −15 −10 −5 0 5 10 15 20 RH (event − nonevent) back time, h % winter spring summer autumn seas aver (d) −96 −72 −48 −24 −12 0 −0.1 −0.05 0 0.05 0.1 0.15 0.2 0.25 0.3
rain (event − nonevent)
back time, h mm winter spring summer autumn seas aver (e) −96 −72 −48 −24 −12 0 −3 −2.5 −2 −1.5 −1 −0.5 0 0.5 1x 10 −3 AH (event − nonevent) back time, h g m −3 winter spring summer autumn seas aver (f)
Fig. 4. Difference in meteorological parameters between event and nonevent trajectories for
different seasons (blue line – winter, green line – spring, red line – summer, magenta line – autumn) and seasonal average (black line). (a) Air mass height, (b) Mixed layer depth, (c) ambient Temperature, (d) Relative Humidity, (e) rain along the trajectory, (f) Absolute Humidity.
ACPD
6, 11209–11246, 2006
Relation of air mass history to nucleation events in Po Valley, Italy L. Sogacheva et al. Title Page Abstract Introduction Conclusions References Tables Figures ◭ ◮ ◭ ◮ Back Close Full Screen / Esc
Printer-friendly Version Interactive Discussion −96 −72 −48 −36 −24 −12 −6 2.5 3 3.5 4 4.5 5 5.5 6 back time, h ms −1 nonev undef ev1 ev2 ev3 (a) −96 −72 −48 −36 −24 −12 −6 −0.014 −0.012 −0.01 −0.008 −0.006 −0.004 −0.002 0 back time, h ms −1 nonev undef ev1 ev2 ev3 (b)
Fig. 5. Median horizontal (a) and vertical (b) velocity of air parcel averaged for different parts
of trajectory (96 – 72 – 48 – 36 – 24 – 12 – 6 – 0 h back) for different group of days (blue line – nonevent days, black line – undefined days, red line – event class1 days, magenta – event class 2 days, green – event class 3 days). The points are connected for clarity.
ACPD
6, 11209–11246, 2006
Relation of air mass history to nucleation events in Po Valley, Italy L. Sogacheva et al. Title Page Abstract Introduction Conclusions References Tables Figures ◭ ◮ ◭ ◮ Back Close Full Screen / Esc
Printer-friendly Version Interactive Discussion
Fig. 6. Schematic figure of the sub-areas used in the probability analysis.
ACPD
6, 11209–11246, 2006
Relation of air mass history to nucleation events in Po Valley, Italy L. Sogacheva et al. Title Page Abstract Introduction Conclusions References Tables Figures ◭ ◮ ◭ ◮ Back Close Full Screen / Esc
Printer-friendly Version Interactive Discussion
0.1 0.2 0.3 0.4 0.5 0.6 0.7 0.8 0.9 1
Fig. 7. Probability of nucleation events. Trajectories are normalized by the residence time in
each sector. Number in each sector is the number of event and nonevent trajectories, passed over that sector.
ACPD
6, 11209–11246, 2006
Relation of air mass history to nucleation events in Po Valley, Italy L. Sogacheva et al. Title Page Abstract Introduction Conclusions References Tables Figures ◭ ◮ ◭ ◮ Back Close Full Screen / Esc
Printer-friendly Version Interactive Discussion
Fig. 8. Frequency (%, color) of the location of an air parcel in different direction sectors between
the reference back time steps (contour line for −12 h, −24 h, −48 h, −72 h, −96 h) for event (a) and nonevent (b) for the whole period of measurements.
ACPD
6, 11209–11246, 2006
Relation of air mass history to nucleation events in Po Valley, Italy L. Sogacheva et al. Title Page Abstract Introduction Conclusions References Tables Figures ◭ ◮ ◭ ◮ Back Close Full Screen / Esc
Printer-friendly Version Interactive Discussion
4 6 8 10 12 14 16 18 20
Fig. 9. SO2 emission sources (Tg year −1, EMEP data base) and event class 1 (a), event
ACPD
6, 11209–11246, 2006
Relation of air mass history to nucleation events in Po Valley, Italy L. Sogacheva et al. Title Page Abstract Introduction Conclusions References Tables Figures ◭ ◮ ◭ ◮ Back Close Full Screen / Esc
Printer-friendly Version Interactive Discussion 0 1 2 3 4 5 6 7 8 9 10 12 14 16 18 20 25 30 100 101 102 103 SO2 range Frequency modeled measured
Fig. 10. Modeled cumulative (blue line) and measured (black line) SO2concentration along the trajectory (τ=24 h).
ACPD
6, 11209–11246, 2006
Relation of air mass history to nucleation events in Po Valley, Italy L. Sogacheva et al. Title Page Abstract Introduction Conclusions References Tables Figures ◭ ◮ ◭ ◮ Back Close Full Screen / Esc
Printer-friendly Version Interactive Discussion
Fig. 11. The fraction of the SO2 concentration (%) transported to SPC (modeled using back trajectories and EMEP emission data).
ACPD
6, 11209–11246, 2006
Relation of air mass history to nucleation events in Po Valley, Italy L. Sogacheva et al. Title Page Abstract Introduction Conclusions References Tables Figures ◭ ◮ ◭ ◮ Back Close Full Screen / Esc
Printer-friendly Version Interactive Discussion
Fig. 12. The contribution of the SO2emission sources (%) to the SO2concentration at SPC (modeled using back trajectories and EMEP emission data).