HAL Id: hal-00304785
https://hal.archives-ouvertes.fr/hal-00304785
Submitted on 1 Jan 2003HAL is a multi-disciplinary open access archive for the deposit and dissemination of sci-entific research documents, whether they are pub-lished or not. The documents may come from teaching and research institutions in France or abroad, or from public or private research centers.
L’archive ouverte pluridisciplinaire HAL, est destinée au dépôt et à la diffusion de documents scientifiques de niveau recherche, publiés ou non, émanant des établissements d’enseignement et de recherche français ou étrangers, des laboratoires publics ou privés.
and the river network downstream
C. J. von der Heyden, M. G. New
To cite this version:
C. J. von der Heyden, M. G. New. The role of a dambo in the hydrology of a catchment and the river network downstream. Hydrology and Earth System Sciences Discussions, European Geosciences Union, 2003, 7 (3), pp.339-357. �hal-00304785�
The role of a dambo in the hydrology of a catchment and the
river network downstream
Constantin J. von der Heyden and Mark G. New
School of Geography and the Environment, Mansfield Road, University of Oxford, OX1 3TB Email: [email protected]
Abstract
Dambos are shallow, seasonally inundated wetlands and are a widespread landform in Central and Southern Africa. Owing to their importance in local agriculture and as a water resource, the hydrology of dambos is of considerable interest: varied, and sometimes contradictory, hydrological characteristics have been described in the literature. The issues in contention focus on the role of the dambo in (i) the catchment evapotranspiration (ET) budget, (ii) flood flow retardation and attenuation, and (iii) sustaining dry season flow to the river down-stream. In addition, both rainfall and groundwater have been identified as the dominant source of water to the dambo and various hydrogeological models have been proposed to describe the hydrological functions of the landform. In this paper, hydrological and geochemical data collected over a full hydrological year are used to investigate and describe the hydrological functions of a dambo in north-western Zambia. The Penman estimate of wetland ET was less than the ET from the miombo-wooded interfluve and the wetland has been shown to have little effect on flood flow retardation or attenuation. Discharge of water stored within the wetland contributed little to the dry season flow from the dambo, which was sustained primarily by groundwater discharge. Flow in a perched aquifer within the catchment soils contributed a large portion of baseflow during the rains and early dry season. This source ceased by the mid dry season, implying that the sustained middle to late dry season streamflow from the wetland is through discharge of a deeper aquifer within the underlying regolith or bedrock. This hypothesis is tested through an analysis of groundwater and wetland geochemistry. Various physical parameters, PHREEQC model results and end member mixing analysis (EMMA) suggest strongly that the deep Upper Roan dolomite aquifer is the source of sustained discharge from the wetland.
Keywords: dambo, hydrology, hydrogeology, stormflow, evapotranspiration, baseflow, sponge effect, Zambia
Introduction
Dambos are a ubiquitous headwater feature throughout central and southern Africa. These shallow, seasonally inundated wetlands commonly form on crystalline basement lithology (Acres et al., 1985; Mäckel, 1985), although in central and north-western Zambia they are frequently associated with fractures or folds in a carbonate rich geology (Archer and Mäckel, 1973; Garlick, 1961b). Owing to their close association with the drainage network, to their diverse and specialised environment and to their role in local agriculture, these shallow depressions are of substantial importance in the natural and social environment (Debenham, 1948; Scoones and Cousins, 1994; Whitlow, 1985, 1990).
The role of the dambo in these environments is intricately associated with its hydrological characteristics. However, despite considerable attention over recent decades, a general
model explaining dambo hydrology and hydrogeology remains elusive, partly due to a lack of accurately comparable data and differences in the definition of dambo geomorphology and hydrogeology. Hence, some of the intrinsic hydrological functions leading to the perceived importance of the landform, such as the commonly held theory that dambos function as headwater sponges (Balek and Perry, 1973; Debenham, 1948) have been challenged (Bullock, 1992b; McCartney, 2000). Substantial contributions highlighting these differences are found in the reviews by Whitlow (1985), Boast (1990), Bullock (1992a) and von der Heyden (2003). The issues at the heart of the debate are the role of the dambo in: (i) the catchment evapotranspiration (ET) budget, (ii) augmentation of dry season flow, (iii) flood flow attenuation and retardation, and (iv) determining the dominant source of water to the dambo and the hydrogeological model. The divergence in the
literature regarding these hydrological functions and attributes is shown in Table 1 and in von der Heyden (2003). Dambo catchments show great variability with respect to climate, geology, vegetation and topography. The literature suggests that the effect of dambos on catchment ET loss depends principally on the vegetative characteristics of the interfluve, although soil characteristics may also be important. Augmentation of dry-season flow is primarily a function of groundwater discharge, although a substantial change in storage is described in some studies. The literature suggests that stormflow is attenuated during the early wet season through soil infiltration and dambo filling while, later in the wet season, the dambo has little influence over stormflow due to marked soil wetting and decreased soil infiltration. The unifying feature with respect to the dambo hydrogeological unit is a low permeability layer within the interfluve catena (McCartney and Neal, 1999; McFarlane, 1989). This layer is overlain within the interfluve subsoils by a perched aquifer which outcrops under the dambo (Chilton and Foster, 1995). Complex models proposing either significant flow (McFarlane, 1989), or no communication across this layer (McCartney and Neal, 1999) have been presented in the literature; both models are appropriate depending on the geological conditions.
In this paper, the hydrological budget of a north-western Zambian dambo and its catchment is described and hydrochemical data are used to explore the hydrological processes in the catchment and to discuss the role of the wetland in the catchment ET budget, in flood flow attenuation and retardation, and in augmentation of dry season streamflow. Analysis of the wetlands hydrological budget enables an assessment of the role of the wetland in catchment hydrology, while the geochemical investigation identifies the dominant source of water to the wetland and leads to the development of a hydrogeological model describing catchment hydrology.
Site description
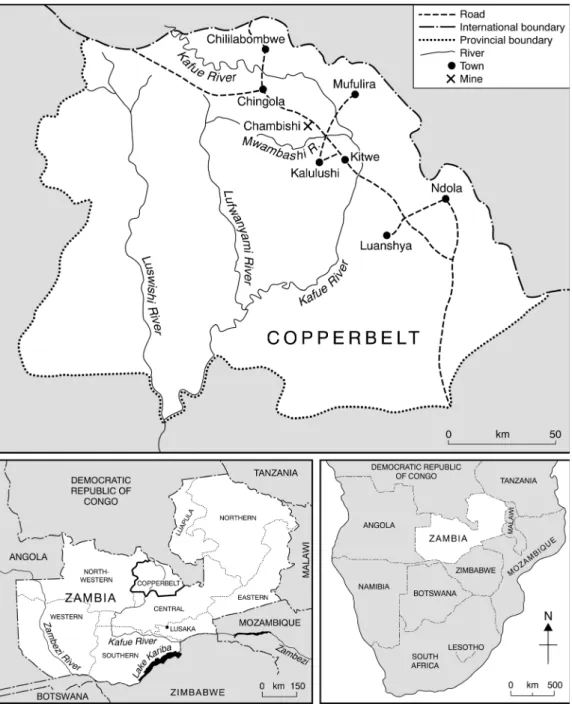
The study catchment (Chambishi) is located in the Zambian Copperbelt (Fig. 1), an extensive metalliferous deposit on the central Africa plateau, stretching across 13°S and 28°E (Mendelsohn, 1961). The catchment, at an elevation of around 1200 m, has daily temperatures ranging from 35oC
in summer to below 10oC in winter. Rainfall occurs almost
exclusively during the summer months (mid-November to early April) as high intensity, short duration thunderstorm events associated with the annual migration of the
Inter-Table 1. Summary of the role of dambos in catchment hydrological function as described in the literature.
DECREASED INCREASED
Reference Country Reference Country
Catchment ET (Balek and Perry, 1972) Zambia (Bell et al., 1987) Zimbabwe (Balek and Perry, 1973) Zambia (Bullock, 1992b) Zimbabwe
(Balek, 1977) Zambia (Drayton et al., 1980) Malawi
(Oyebande and Balek, 1989) Zambia (Faulkner and Lambert, 1991) Zimbabwe (Smith-Carrington, 1983) Malawi (Kimble, 1960) Southern Africa
(Stewart, 1989) Zimbabwe
(McCartney et al., 1998) Zimbabwe
Dry season flow (Bullock, 1992b) Zimbabwe (Balek and Perry, 1972) Zambia (Drayton et al., 1980) Malawi (Balek and Perry, 1973) Zambia
(Balek, 1977) Zambia
Flood response (Balek and Perry, 1972) Zambia (Bullock, 1992b)a Zimbabwe
(Balek and Perry, 1973) Zambia (Drayton et al., 1980) Malawi (Kanthack, 1945) South Africa (McCartney et al., 1998) Zimbabwe (McCartney and Neal, 1999) Zimbabwe (Mumeka and Mwasile, 1986) Zambia (Schulze, 1979) South Africa
Fig. 1. Location map showing Zambia, the Copperbelt Province and the Chambishi Mine.
Tropical Convergence Zone. The 30-year average annual rainfall of Ndola, 60km E of the Chambishi catchment is 1365 mm, with a 30-year range of 11302010 mm. Rainfall onto the Chambishi catchment during the study period was 1610 mm.
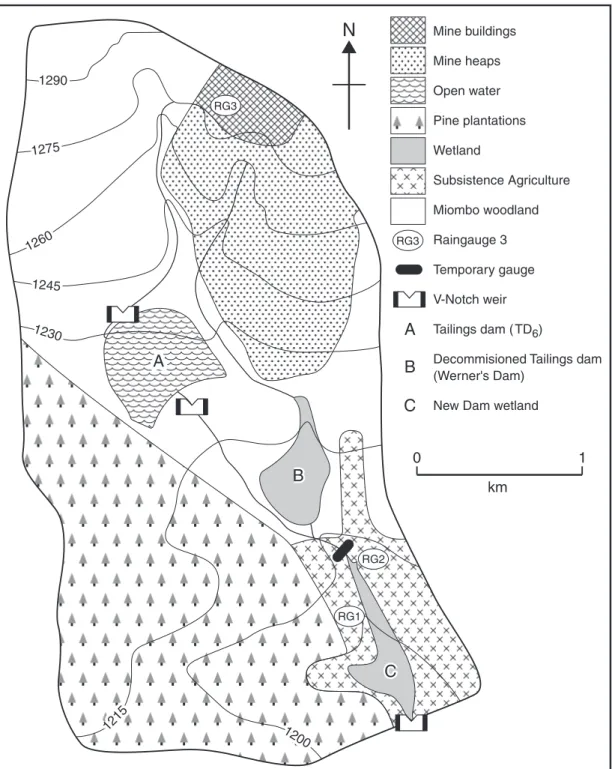
The history of mining at Chambishi dates to 1961. In the 1970s an earthen wall was constructed on a shale outcrop underlying the existing natural wetland outflow, thus forming New Dam wetland. Effluents from the mine and processing plant enter a large tailings dam (TD6) before
discharging into New Dam wetland through the influent
stream (Fig. 2). A decommissioned tailings impoundment (Werners Dam) lies upstream of the wetland; surface run-off from this occurs during the rainy season. Due to the extensive mining-related activity in the catchment, the system cannot be considered a pristine dambo. However, the impact on the hydrology of the catchment is restricted to input through the influent stream. Chambishi Metals PLC (CM) purchased the processing plant in 1997 and environmental monitoring data have since been collected throughout the catchment.
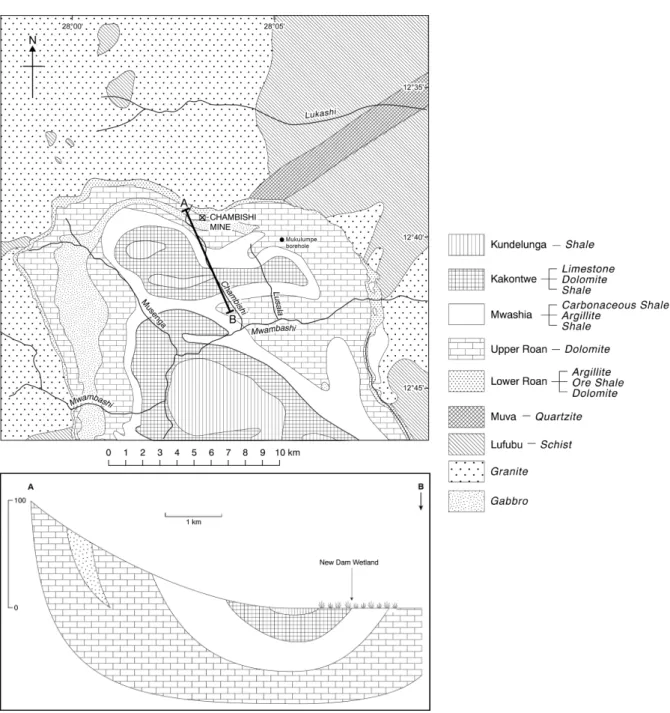
Fig. 2. Chambishi catchment, showing topographic contour lines, drainage network, rain gauges and main land-cover categories. by the argillaceous shale, carbonaceous shale, limestone and
dolomite of the Upper Roan, Mwashia, Kakontwe and Kundelungu formations (Fig. 3). The Kundelungu, Kakontwe and Mwashia formations are consolidated, with low porosity and transmissivity and, hence, form a barrier to groundwater flow. The Upper Roan dolomite comprises an extensive aquifer, holding the vast majority of the water within the various series (Mendelsohn, 1961). This aquifer
is recharged along the rim of the catchment, 5 km from the wetland outflow and outcrops 200 m upstream of the wetland outflow, with an approximate change in altitude of 100 m (Fig. 3). The New Dam wetland itself is located over an impermeable shale layer in the core of a synclinal structure. Catchment soils are poorly sorted sandy silts.
Surface discharge from the New Dam wetland occurred throughout the study period (June 2000May 2001). Effluent
N
1290 1290 1275 1275 1260 1260 1245 1245 1230 1230 1215 1215 120 0 1200 0 1 A A A A C C C C B B B B RG3 RG2 RG1 RG3 Mine buildings Mine heaps Open water Pine plantations Wetland Subsistence Agriculture Miombo woodland Raingauge 3 Temporary gauge V-Notch weir Tailings dam ( TD6)Decommisioned Tailings dam (Werner's Dam)
New Dam wetland
input to the wetland ceased in June 2000 due to low flows from TD6 and resumed only at the onset of the rains in
November. Several small springs occur along the verges of the wetland, most flowing only for a few months during the late rainy and early dry season. One large spring, located in the NE corner of the wetland flowed throughout the year (Fig. 4).
The catchment surface area is approximately 27 km2,of
which the New Dam wetland covers an area of 0.4 km2 or
1.5% (Fig. 2). The catchment areas upslope of TD6 outflow
and of New Dam inflow are 54% and 75% of the total
catchment area respectively. Catchment relief is low, with altitudes ranging from 1290 to 1185 m.a.s.l and slopes of 0.3o2.0o. Pine plantations cover 29% of the catchment
surface area (Fig. 2). The open pit and related mine structures occupy 19% and patches of subsistence agriculture comprise 8% of the catchment surface area. The remainder of the catchment is covered in mature and degraded miombo woodland (42%) and wetland vegetation (4%). The New Dam wetland itself is vegetated almost exclusively by reeds (Typha spp., Phragmites spp. and Cyperus spp.).
Fig. 3. Surface geology of the Northern Chambishi Basin showing cross section along cut-line AB, which includes the New Dam
0 200 400 600 800 1000 1200 1400 Ju n Ju l Aug Sep Oc t Nov Dec Ja n Fe b
Mar Apr May
Annual Monthly E T (m m ) 0 2000 4000 6000 8000 10000 12000 14000 Annua l E T (m m ) Wetland Pine Forest Open water Miombo Mine heaps Mine buildings Maize
Fig. 4. Schematic of the New Dam wetland showing Transects 1, 2, 4, 6 and 7, the piezometer grid, pre-existing wells
and surface water sampling sites.
Methods
The study period (June 2000May 2001) encompassed a full hydrological year (HY2000). Surface water sampling was conducted at the tailings dam outflow (TD6), the wetland
inflow (ND inflow 1), the perennial spring (ND inflow 2) and the wetland outflow (ND outflow). Piezometers were installed along five transects across the wetland. Transects were numbered (P1, P2, P4, P6 and P7) and lettered with a and b to denote the western and eastern interfluve respectively. A further 4 drinking wells (W1, W2, W3, W6) used by local subsistence farmers, were also used for hydrochemical and hydrological investigations (Fig. 4). Piezometer pipes, 2.5 cm in diameter, were slot-perforated for the lowest 2050 cm. Piezometer bases were plugged and the tops were capped. Piezometer holes were dug using a hand augur and the piezometer annuli were sealed to prevent rain infiltration. Relative positions were determined using a theodolite. All piezometers were sunk to 1m below the level of the water table in the middle of the dry-season, maximum piezometer depth was 4.5m and transects were 50m to 100m in length. Soil samples were collected every 20-40cm down auger holes and were analysed at 1-phi intervals by hand-sieving of the coarse fraction and Granulometer analysis of the fine fraction (Leeder, 1982; McLane, 1995).
Hydrology
SURFACE WATERFlow in the Chambishi Stream was gauged at the tailings dam (TD6) outflow, the New Dam outflow and the New
Dam inflow. Rating curves for all gauges (Table 2) were generated from stage-discharge measurements (US Department of the Interior, 1997). Chambishi Metals environmental monitoring personnel (CMEMP) measured effluent released from the processing plant at a V-notch weir above the tailings dam; the design curve was used to estimate discharge at this gauge. During field trips, stage readings were taken daily during the rains and three times weekly during the dry season. Discharge was measured once a week. In addition, CMEMP recorded daily stage measurements at
the V-notch weirs, although occasional days were not recorded. No automated discharge data logging was available. As daily wetland inflow discharge data throughout HY2000 was not available, a linear relationship was developed between the daily discharge measured at TD6 and
the New Dam inflow (Table 2).
This relationship was used to estimate wetland surface water inflow for periods without direct measurements. Although this extrapolation introduces some inaccuracies, this protocol is reasonable because of the tight fit of the data and the large number of days when direct measurements at the inflow were available.
Daily rainfall was measured at three sites in the catchment (RG1, 2 and 3) from 15/11/0010/01/01. The catchment-averaged rainfall was determined through inverse distance-weighted area averaging. For the remainder of the rainy season (11/0104/04/01), rainfall was measured at gauge RG3 maintained by CMEMP. This rain gauge was assumed to represent the entire catchment; comparison between rainfall timing and volume measured by (RG3) and the two sites adjacent to the wetland (RG1 and RG2) showed good agreement (R = 0.63, mean bias = 1.03, n = 43).ET was not measured in the field due to a lack of resources, but was estimated according to the Penman (1948) equation using the hydrological model ACRU (Schulze, 1995). The model uses daily climate data in calculating values of ET from various land cover types based on the soil water budget and vegetation characteristics (Table 3). Climate data not recorded in the Chambishi catchment were obtained from the Ndola Meteorological Station (45 km away). ET from New Dam wetland itself was estimated using a reeded-wetland simulation in ACRU (Smithers, 1991; Smithers and Schulze, 1993). The simulation was defined by a shallow A-horizon (1 m) with very slow infiltration into the B-horizon, which was used to model surface runoff from the waterlogged depression.
Groundwater
Hydrological monitoring was performed at all piezometers and at Well 1. Hydraulic conductivity was estimated according to the Hvorslev equation using slug tests
Table 2. Regression statistics for discharge-stage rating curves at the three gauging stations and the relationship between discharge at TD6 outflow and ND inflow. Discharge (Q) is in m3s1 and stage (h) is in cm
TD6 outflow New Dam inflow New Dam outflow TD6 - ND
Regression Q = 1.5
×
10-5 h2.5683 Q = 0.017h - 0.42Q = 2.2×
10-5 h2.4556 QND = 1.29QTD + 0.03
R2 0.997 0.97 0.991 0.714
Standard error 0.006 0.025 0.017 0.087
performed at nine piezometers (Domenico and Schwartz, 1990; Freeze and Cherry, 1979; Maidment, 1993). Hydraulic conductivity ranged from 5 to 30 m d1, approximating the
range predicted for silty-sand soils (Maidment, 1993). A mean hydraulic conductivity of 10 m d1 was used in the
groundwater flow calculations.
GEOCHEMISTRY
Groundwater samples were collected from Transects 1, 2 and 4 and W1throughout HY 2000. Von der Heyden and New (2003) have shown that groundwater at Transects 1 and 2 was polluted by a plume from the decommissioned tailings impoundment upstream so these transects were excluded from the catchment hydrochemical investigation. In addition to the groundwater sampled in the Chambishi catchment, two samples were collected from the 200 m-deep Mukulumpe borehole, which abstracts from the Upper Roan aquifer 4 km from the Chambishi catchment (Fig. 3). This borehole was sampled only twice as it was assumed that the geochemistry of the Upper Roan aquifer was relatively constant throughout the hydrological year. This assumption was reasonable as the chemistry of the two samples, collected at the beginning (April) and end (November) of the dry season, was very similar.
Surface water samples were collected from the ND inflow 1, ND inflow 2 and ND outflow (Fig. 4).
Sample collection and field analysis
All sample water was analysed in the field for temperature, electrical conductivity (EC) and pH using Hanna field meters, with pH readings verified using an Orion pH meter. Oxygen content was determined with an Orion dissolved oxygen (DO) meter and verified using a Merck oxygen titration kit. Alkalinity determination was conducted through titration past the point of inflection within 15 minutes of
sample collection (surface water) or on sample collection (groundwater). All sample bottles were washed and leached according to standard protocol and double flushed with sample water prior to collection (Horowitz et al., 1994; Koterba et al., 1995; Shelton, 1994). Samples were filtered (0.45 µm) and acidified to pH 1. Sample bottles were filled to overflowing and atmospheric contact was limited. All samples were stored at 4oC and analysed within 30 days of
collection.
l Surface water samples were collected through grab sampling, with the sample taken midway between the surface and the stream/wetland bed.
l Groundwater samples were drawn from piezometers using a peristaltic pump; groundwater was pumped to waste until pH, DO (and Eh) and EC readings on the inline meters stabilised.
Sample analysis
All Ca and Mg analyses were conducted at the Anglo American Research Laboratory (AARL) in Johannesburg, South Africa, using an Atomic Absorption Spectrometer (AAS). Duplicate and standard analyses were conducted to determine sampling and analysis error, which was always within 5%.
Geochemical models
Besides basic statistical analysis of the data, two models were used in analysing and interpreting the data. PHREEQC (Parkhurst and Appelo, 1999) was used with the thermodynamic database WATEQ4F (Ball and Nordstrom, 1991) to perform speciation and saturation-index (SI) calculations. Saturation of a mineral phase is defined as a SI of zero, under-saturation less than zero and super-saturation above zero.
Table 3. Land cover types, as described in Fig. 2, showing various characteristics utilised in modelling ET using ACRU. % of B-horizon rooting pertains to the end of the dry season, when the A-horizon is moisture depleted.
Land Cover Rooting depth B-horizon Characteristics
(m) rooting (%)
Maize 1 25 Growth and ET during 01/12/0030/04/01
Mine heaps 0.5 0 50100% rock surface with the remainder grassed
Mine buildings n/a n/a 20% lawn, 80% roads and buildings
Miombo 6 50 Mature and degraded woodland
Pine 3 50 Mixed age population
Open water n/a n/a Shallow open water surface on tailings dam
A mixing model based on principal component analysis: End Member Mixing Analysis EMMA (Hooper et al., 1990) was used to analyse the mixing of various potential end members within the surface- and groundwater. EMMA assumes that the chemistry of multi-component water is a function of the chemical constituents within distinctive source waters feeding into the system, when the constituents of the end members are conserved. EMMA describes mixing scenarios as the area defined by the lines joining end members in the U-space formed by principal components 1 and 2. Numerous papers have used EMMA to determine the possible end members in complex mixing problems (Burns et al., 2001; Foster et al., 2001; Wade et al., 2001). In the present paper, the six chemical determinants displaying the greatest variability (HCO3, SO4, Ca, Mg, Na,
K) were used as the variables in EMMA.
Results and discussion
CATCHMENT HYDROLOGICAL BUDGET
The catchment hydrological budget for HY2000 shows that mass balance is achieved (Table 4). The table shows rainfall (98% of input) and ET (83% of output) dominating the catchment budget. Mine effluent input to the catchment was relatively constant throughout the year and constituted a small percentage (1.5%) of the total input. The catchment surface water outflow, gauged at New Dam outflow, formed 17% of the catchment output budget. As the dominant gradient in the shallow groundwater is across the catchment (E W), most of this groundwater will discharge into the effluent stream or the wetland. However, a small down-catchment (N S) hydraulic gradient (0.005) was measured and groundwater output from the catchment (0.018 Mm3)
was estimated according to Darcys law. It is important to note that the mass balance is based on the assumption that groundwater input to the catchment is zero. Although this assumption could not be tested, it seems reasonable given the well-dissected nature of the surface geology and the generally low gradient environment of the Copperbelt. Accepting that the assumption is justified, the mass balance
suggests that ACRU parameterisation and the catchment ET budget are acceptable approximations of reality.
Simulated monthly and annual ET per land-cover type highlights the role of moisture availability and the vegetative characteristics in the ET budget (Fig. 6). The middle and late dry season (JulyOctober) has the lowest total ET due to low solar radiation energy and limited soil moisture availability. However, ET from miombo woodland remains relatively high during this period as the deep root-systems access the high moisture B-horizon. Although values for miombo ET during this period are consistent with late dry season measurements by Drew 1971 (reported in Balek and
Output 0.0 0.2 0.4 0.6 0.8 1.0 1.2 1.4 1.6 1.8 2.0
J-00 J-00 A-00 S-00 O-00 N-00 D-00 J-01 F-01 M-01 A-01 M-01
D is c harge (M m 3) Surfacewater ET Input 0.0 0.2 0.4 0.6 0.8 1.0 1.2 1.4 1.6 1.8 2.0
J-00 J-00 A-00 S-00 O-00 N-00 D-00 J-01 F-01 M-01 A-01 M-01
D is c harge (M m 3) Groundwater Storm-flow Streamflow Rainfall
Table 4. Annual hydrological budget for Chambishi catchment (HY2000). SW is surface water and GW is groundwater. ET is calculated using the hydrological model ACRU. Groundwater output is estimated from Darcian principles as the flow within the soil aquifer. All values are in Mm3.
Effluent SW Rainfall ET GW Sum
Input 0.734(2%) 43.830(98%) Assumed zero 44.564
Output 7.964(17%) 37.637(83%) 0.018(0%) 45.619
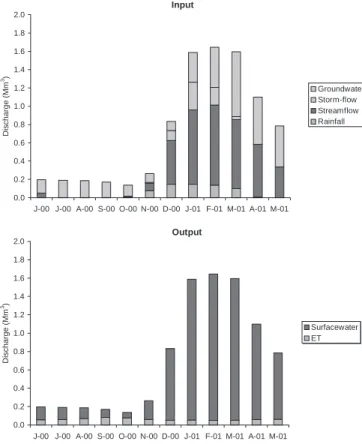
Fig. 6. Monthly hydrological input and output to the New Dam
wetland (HY 2000). Streamflow input includes flow from TD6 and
discharge into the effluent channel. Storm-flow into the wetland is from surface and sub-surface pathways. Groundwater discharge is calculated from the difference of other components.
Perry, 1973), ACRU may underestimate miombo woodland ET during the late dry season (September and October), as the model did not simulate the fresh growth of miombo during this period. Model results indicate that open water surfaces have the highest annual ET, while miombo woodland shows the greatest ET from the vegetated land-cover types.
Most of the surface and subsurface flow within the catchment passes through the wetland and, thus, the wetlands hydrological functions affect the hydrology of the entire catchment. In the sections to follow, the hydrological characteristics of the wetland itself are investigated thereby providing additional insight into the role of the wetland in the hydrological regime of the catchment.
WETLAND HYDROLOGICAL BUDGET
The wetland hydrological budget is calculated according to Eqn. (1) and the data are shown in Table 5. Field observations demonstrated that change in storage was not significant when assessed over a full hydrological cycle, while a positive hydraulic head in the soil aquifer throughout HY 2000 suggests negligible or no groudwater recharge from the wetland. Accordingly, these components of Eqn. (1) were assumed to be zero.
S ET Q Q P Q Q
Qinflow + gw+ sf + = outflow + recharge + +∆
( 1) where
Qinflow is streamflow gauged at the wetland inflow (m3)
Qgw is the groundwater discharge into the wetland (m3)
Qsf is the volume of storm-flow entering the wetland (m3)
P is the direct precipitation on the wetland surface (m3)
Qoutflow is streamflow gauged at the wetland outflow (m3)
Qrecharge is the volume of groundwater recharge from the
wetland (m3)
ET is evapotranspiration from the wetland surface (m3)
∆S is the change in wetland storage volume (m3)
The wetland input budget demonstrates the importance of Qinflow (46%), which comprises outflow from TD6 (75%)
and discharge into the effluent stream channel below TD6
(25%); P (7%), Qsf (7%) and Qgw (40%) into the wetland
itself constitute the remainder of the wetland input budget. Analysis on a monthly basis (Fig. 6) shows the expected increase in surface water and groundwater input to the wetland during the rainy season; the increase in groundwater discharge lags behind that of surface water discharge because of the delay in transport through the aquifer. Groundwater discharge reaches a maximum at the end of the rainy season and decreases rapidly following the rains, with discharge volume tailing off to form the sole input to the wetland by the middle to late dry season.
Qoutflow dominates the output budget (93%), with ET from
the wetland surface constituting the remainder (7%). 93% of the annual wetland outflow occurs during the rainy season (71%) and in the two months following the rains (22 %): wetland outflow during the remainder of the year is only 7%. This demonstrates the seasonal disparity in wetland discharge and, hence, supply to the downstream river network.
Stormflow
TD6 outflow, wetland inflow and wetland outflow all
increase with the onset of heavy rains in mid-November (Fig. 6) through a combination of storm-flow, increased baseflow and direct precipitation input. Daily discharge at the wetland inflow and outflow (r = 0.83, n = 217) and the wetland inflow and TD6 outflow (r = 0.90, n = 35) are well
correlated and peak flows are well correlated with rainfall (r = 0.67, n = 158). Correlations in discharge at the tailings dam outflow, the wetland inflow and wetland outflow during the early and middle rainy season (17/11/00-10/01/01) show that the correlation between tailings dam outflow and wetland inflow (r = 0.90) is slightly lower than that between the wetland inflow and outflow (r = 0.93). As the distance between TD6 and ND inflow, and between ND inflow to
outflow is approximately the same, these findings suggest that the wetland is indistinguishable from the effluent stream in its response to rainfall events and stormflow and hence that stormflow is not retarded much by the wetland itself. Moreover, in the absence of continuous discharge data, a more comprehensive assessment of flood retardation is not
Table 5. Annual hydrological budget for the New Dam wetland (HY 2000). ET is calculated using the hydrological model ACRU. Groundwater discharge into the wetland is estimated from difference of other components. All values are in Mm3.
Surface water Rainfall ET Storm-flow Groundwater
Input 3.977(46%) 0.626(7%) 0.645(7%) 3.446(40%)
0.0 0.2 0.4 0.6 0.8 1.0 1.2 1.4 1.6 1.8 2.0 31O ct - 05 Nov 06No v - 25 Nov 26No v - 13 Dec 14D ec 03 Jan 04Jan - 15J an 16Jan - 29J an 30J an - 02F eb 03F eb 27Fe b 28F eb 11M ar 12Ma r - 16 Mar 17Ma r - 23M ar 24Ma r - 27M ar 28M ar - 0 4Apr Storm-flow event D ischar ge (m3/d) 0.0 0.5 1.0 1.5 2.0 2.5 3.0 Qs /Q b Qs Qb Qs/Qb 0.00 0.02 0.04 0.06 0.08 0.10 0.12 0.14 Qs /P 0 100 200 300 400 500 600 700 R a inf a ll ( m m ) Qs/P Rainfall
possible and accordingly this conclusion could no be confirmed.
Hydrograph separation of daily discharge data from the New Dam inflow and outflow, and from TD6 outflow shows
stormflow constituted 61% and 31% of TD6 and ND total
rainy season surface flow respectively (Table 6). The stormflow coefficient (Qs/P), calculated as total stormflow
divided by total up-catchment rainfall, demonstrates a marked consistency between the three streamflow gauging sites, with mean values raging from 3.8% to 4.6% (Table 5). This implies that roughly the same proportion of rainfall forms stormflow throughout the catchment. Although it was not possible to quantify the effect of the wetland on stormflow volume, the stormflow coefficient implies that the wetland is indistinguishable from the remaining
catchment in the proportion of rainfall that forms stormflow. This suggests that the wetland does not markedly attenuate stormflow.
Evaluation of stormflow events at the wetland outflow (Fig. 7) shows that Qs/P is low during the early rainy season,
increases during the middle rains and then decreases towards the end of the rains. These findings can be explained by the saturation of the catchment soil related to the amount of preceding rainfall and the intensity of rainfall leading to the stormflow event evaluated. During the early rains (November) when rainfall events are of low volume and intensity and soils are dry, the soils absorb rainfall rapidly and little stormflow develops. Qs/P reaches a maximum by
the middle of the rainy season (January and February) when rainfall volume is greatest, rainfall intensity is highest and Fig. 7. Top: ratio of stormflow (Qs) to rainfall (P), and total rainfall for stormflow events during the HY2000 rainy season, measured at the
Table 6. Stormflow and baseflow during the rainy season (HY 2000). The stormflow coefficient (Qs/P) is the proportion of rainfall on the upslope catchment forming stormflow and is given as the mean and the range of measurements. Total wetland input (Qt) = gauged ND outflow + ET. Baseflow = Qt (stormflow + mine effluent). Wetland storage could not be quantified for the rainy season and thus baseflow incorporates the discharge of wetland storage.to:
QT Qs No. Events Qs/P QB QB/QT
EARLYRAINYSEASON (17/11/00 10/01/01)
TD6 outflow 0.696 0.405 6 0.042(0.031-0.054) 0.181 0.26
ND inflow 0.985 0.657 5 0.037(0.033-0.044) 0.218 0.22 ND outflow 1.471 0.74 5 0.040(0.025-0.069) 0.705 0.48
ENTIRE RAINYSEASON (NOV 00-APR 01)
TD6OUTFLOW 2.349 1.141 8 0.043(0.031-0.062) 0.908 0.39
ND outflow 5.775 1.786 10 0.044(0.025-0.069) 3.989 0.69
soils are most saturated. By March, daily rainfall decreases in volume and intensity and the Qs/P ratio decreases
accordingly.
Figure 8 also shows the ratio of baseflow to stormflow at the wetland outflow through the rainy season and demonstrates the increasing proportion of wetland outflow constituted by baseflow as the aquifer recharges through the rainy season. The comparison of Qs and Qb over the
rainy season enables insight into the nature of the dominant aquifer feeding the New Dam wetland during the rains: the aquifer is depleted at the onset of the rains but it recharges rapidly to maintain high volume discharge by the late rainy season. These characteristics are consistent with a local, shallow aquifer within the catchment saprolite.
Wetland stored water
The contribution of water stored within the wetland in sustaining streamflow at the wetland outflow is calculated from the change in wetland volume not accounted for by ET losses from the wetland surface:
1000 ) ( h ET SA Q wt st − ∆ × = ( 2) where
Qst is the discharge of stored water (m3d1)
SA is the wetland surface area (m2)
∆hwt is the daily change in wetland surface level (mm d-1)
ET is the daily evapotranspiration from the wetland
surface (mm d1)
Qst was calculated for the dry season, when a decrease in
daily wetland water-table height was attributable to wetland drainage and to ET from the wetland surface. From field observations and aerial photography, SA was estimated as
390000m2 during the dry season. ∆h
wt is measured as a
change in stage at the wetland outflow and daily ET was calculated in ACRU. ∆hwt was greatest following the rains
(5.5 mm d1 in April), displaying an exponential decrease
to the end of the dry season (2.8 and 0.8 mm d1 in June and
October respectively). The daily change in wetland water level is equivalent to daily ET losses by late July, implying that drainage of water stored within the wetland is no longer a net contributor to discharge at the wetland outflow from this time onwards. Overall, discharge of stored water accounted for 1.7% of total dry season wetland outflow. This figure is based on an approximate calculation, which does not take into account the hydraulic gradient of the wetland surface or the changing wetland surface area as the water body shrinks (latter is minor from field observations). However, the estimated discharge of stored water demonstrates that, although the wetland functions to some extent as a sponge in sustaining dry season flow, drainage of wetland volume does not sustain flow past the middle dry season and is only a small component of overall wetland dry season discharge.
Evapotranspiration
Wetland ET, calculated using the ACRU model, ranged from 2.37 mm d1 in winter to 5.63 mm d1 in summer, with an
annual mean of 3.92 mm d1. The model prediction, based
on potential ET, is likely to be a good representation of reality, as transpiration and surface water evaporation is not limited by water availability. The simulated wetland mean and range of ET agree with estimated and measured monthly values of mean and range of ET from wetlands in Zambia (0.164.13 mm, Balek and Perry, 1973), in Zimbabwe (1.53 mm, Lupankwe et al., 2000) and in Australia
(1.916.00 mm, Hughes et al., 2001).
Comparison of ET per land-cover type (Fig. 5) shows wetland ET was substantially greater than pine plantation, vegetated rock slopes and agricultural land ET during HY 2000. However, wetland ET was third highest in the catchment, following that of miombo woodland and open water surfaces. Limpitlaw (2002) and Mendelsohn (1961) describe the majority of pristine dambo catchments on the Copperbelt as vegetated by miombo woodland. Thus, ACRU modelling suggests ET is generally lower from Copperbelt wetlands than from their wooded interfluves, a conclusion consistent with the findings of Balek and Perry (1973). However, as the ET calculated here is based on model simulations, these conclusions require field verification.
GROUNDWATER
Evaluation of the wetland hydrological budget demonstrates a sustained dry season run-off from the wetland and suggests this run-off is due to the discharge of groundwater into the wetland (Fig. 6). Groundwater discharge was inferred to constitute 34% of the wetland input during the wet and early dry season (NovemberMay) and 100% of the wetland input during the middle and late dry season (JuneOctober). However, middle to late dry season groundwater discharge formed only 23% of annual groundwater discharge. Hence, groundwater discharge demonstrated two distinct seasonal characteristics, (i) a high-volume discharge during the rainy and early dry season and (ii) a sustained low-volume discharge during the middle to late dry season. These characteristics of groundwater flow could be attributed to discharge from the same aquifer, or to two separate systems as proposed by McFarlane (1989). The hydrology and hydrochemistry of the local, shallow soil aquifer are investigated in the next sections and compared with a deeper, bedrock aquifer to decipher the groundwater flow regime of the Chambishi catchment and the source of sustained dry season streamflow from the New Dam wetland.
Hydrology
Water table contours show the evolution of the soil aquifer through the year (Fig. 8). The shallow aquifer is responsive to rainfall input and the water table rises rapidly during the rainy season, when a positive hydraulic head develops across-catchment (EW) due to aquifer recharge on the interfluves. This hydraulic head persists through to the end of recharge (April) but, during the ensuing dry season, follows an exponential decline, returning to a quasi steady-state during the middle to late dry season.
Soil analyses from the New Dam interfluves showed clay content ranging from 8.5% to 14%, silt ranging from 43%
to 52% and sand ranging from 33% to 48%. Grain-size analysis reveals two important hydrological features of the shallow catchment aquifer: (i) the sandy nature of the interfluve soils and (ii) the general uniformity of size distribution with depth. Both characteristics support the application of a Darcian flow model in approximating groundwater flow through the soil matrix:
L H KA Q ∂ ∂ − = (3) where Q is groundwater discharge (m3d1)
K is the hydraulic conductivity (m d1)
A is the cross-sectional area of flow (m2)
L H ∂ ∂
is the hydraulic head
The New Dam wetland hydrological budget based on calculated groundwater discharge for the early to middle dry season (April, June), middle to late dry season (August, September) and late dry season to early rains (November) is shown in Table 7. The data show that calculated groundwater discharge does not result in mass balance during the dry season; the discrepancy between wetland input and output exceeds 80% in some months. This underestimation of groundwater discharge into the wetland is due primarily to the very low hydraulic gradient of the soil aquifer. The data in Table 7 and groundwater contours (Fig. 8) suggest that discharge from the shallow aquifer diminishes rapidly during the dry season; by June, most of the recharge has been depleted and by August steady-state is achieved. Thus, only a small proportion of the sustained dry season streamflow from the wetland can be attributed to discharge from this aquifer. Accordingly, it is proposed that the New Dam wetland is fed through a two-aquifer
Table 7. Wetland hydrological budget for selected months, with groundwater discharge calculated by Darcian flow. All values are in Mm3.
August September November April June
INPUT Qinflow 0.003 0.0020.178 0.651 0.183 Groundwater 0.021 0.021 0.017 0.102 0.060 Sum input 0.024 0.023 0.195 0.753 0.243 OUTPUT Sum output 0.187 0.171 0.264 1.099 0.548 Qinflow = streamflow at ND inflow + rainfall + stormflow + change
system, a shallow aquifer within the catchment soils and saprolite and a deeper aquifer within the underlying bedrock. Based on the geology of the catchment, this deeper aquifer is probably the Upper Roan formation. The contribution of the deeper aquifer, obscured during the wet season by the rapid discharge from the soil aquifer, becomes evident
during the middle to late dry season when it forms the sole hydrological input to the wetland.
Geochemistry
Comparison of the hydrochemistry of the Upper Roan aquifer and the catchment soil aquifer shows a marked Fig. 8. Contour map of the upper New Dam wetland showing land and groundwater contours and piezometer
transects. Late Dry 2000 = August November 2000, Early Wet 2001 = November 2000 January 2001, Later Wet 2001 = April 2001 and Mid Dry 2001 = June 2001.
difference in EC, pH, Ca, Mg and carbonate concentrations (Table 8). Wetland hydrochemistry during the middle to late dry season shows the lower dissolved solids, lower concentrations of Ca and Mg, and higher pH and carbonate alkalinity of the New Dam outflow compared to the wetland inflows (Table 8). The high Ca and Mg at the wetland inflows can be attributed to discharge of a plume of contaminated groundwater, localised within the immediate vicinity of the tailings dam. Besides its effect on Ca and Mg at the wetland inflow, the plume exerts no further effect on the water chemistry of the wetland (von der Heyden and New, 2003). The carbonate content at the wetland outflow cannot be ascribed to discharge of groundwater from the soil aquifer alone: the high carbonate concentrations concomitant with the generally dilute signature of the wetland outflow implies an input of groundwater with carbonate concentrations well in excess of those sampled from the soil aquifer, as it rules out simple evaporative concentration of carbonate within the wetland. The geochemistry of the Upper Roan aquifer neatly coincides with the hydrochemistry at the wetland outflow (Table 8). This conclusion is supported by saturation indices calculated in PHREEQC, which show that both the Upper Roan aquifer and the wetland outflow are saturated with respect to calcite and dolomite, while the soil
groundwater is markedly undersaturated in all carbonate minerals. In explaining the saturation indices at the wetland outflow, evaporative concentration of shallow groundwater entering the wetland is excluded, as a wetland retention time of approximately 450 days, far in excess of the measured 3640 hrs, would be required for the shallow groundwater to reach the concentrations required for carbonate mineral saturation.
The EMMA mixing model was employed to test the hypothesis that sustained dry season streamflow from the New Dam originated as discharge from the Upper Roan aquifer. The model was run with three end members, the two surface water inflows and either of the two groundwater sources. Although, during the dry season, both wetland inflows (ND inflow 1 and 2) originate as discharges from a perched aquifer, the inflow waters differ from the shallow groundwater in the catchment for two reasons: (i) both drained the portion of the perched aquifer affected by the pollution plume from the tailings dam (von der Heyden and New, 2003) and (ii) the waters were sampled in the wetland some distance from the source of groundwater discharge. Some dissolution of effluent precipitates forming within the wetland is likely to alter the chemistry of the wetland inflow water.
Table 8. Hydrochemistry of the groundwater from the Chambishi catchment soils and the Upper Roan aquifer (HY2000). EC is the electrical conductivity and alkalinity is given as CaCO3 equivalent.
EC pH Ca Mg Alkalinity
µS cm1 mg l1
SOILAQUIFER
P4a mean (range) 127.91 (97150) 6.21 (6.086.32) 13.5 (11.616) 8.2 (7.49.7) 70.5 (5783) P4b mean (range) 175.42 (39324) 5.83 (5.666.08) 3.6 (0.76.2) 9.9 (3.218) 67.7 (25154) P6a mean (range) 116 (112120) 6.60 (6.516.68) 10.3 (8.612) 6.7 (76.4) 55.0 (6347)
P6b 153.3 6.26 17.0 12.0 84.0
P7b 110.6 6.4216.1 9.265.0
Well 1 mean (range) 231.02 (124-331) 6.38( 5.976.58) 24.4 (1634) 17.9 (12.226) 105.6 (76139) Well 2mean (range) 167.8 6.32 20.3 (20.120.5) 15.6 (1516.1) 130.5 (129132)
Well 3 143 6.16 - - 58.0 Well 6 55.8 5.89 3.1 7.6 40.0 BEDROCKAQUIFER Upper Roan mean (range) 487 (475499) 7.53 (7.507.56) 60.0 (5862) 40.0 (3842) 248.0 (242254) SURFACEWATER ND inflow 1 mean (range) 845.4 (822902) 7.39 (7.267.51) 129.2 (109159) 66.8 (6571) 133.1(124142) ND inflow 2 mean (range) 728.5 (624834) 7.26 (7.127.41) 101.3 (98105) 67.7 (6569) 170.4 (130192) ND outflow mean (range) 608.3 (606610) 7.55 (7.57.59) 84.0 (8086) 50.7 (5052) 247.0 (229262)
Figure 9 shows the results of EMMA; the first two principal components account for 93% of the variability in the data set. EMMA shows the wetland outflow plotting within the space created by the Upper Roan aquifer and the wetland inflow end members; the outflow clusters along the mixing line connecting the Upper Roan aquifer and ND inflow 2. The wetland outflow plots well outside the mixing space created when the perched aquifer forms the third end member. During the dry period, flow at ND inflow 1 was low compared to that at ND inflow 2, supporting the conclusion that the mixing of ND inflow 2 and discharge from the Upper Roan aquifer dominate the chemistry at the
wetland outflow. Although the PCA analysis is not statistically robust due to the low number of samples, the plot does lend further credence to the hypothesis that Upper Roan aquifer discharge sustains dry season wetland outflow. Analysis of temperature and DO at the wetland are a third test of the hypothesis of Upper Roan aquifer discharge (Fig. 10). Both wetland inflows are fed by groundwater from the soil aquifer, although flow at ND inflow 1 originated substantially further upslope from the sampling point than that at ND inflow 2. Groundwater from both aquifers is anaerobic. The temperature of the deep aquifer (17°C) was markedly lower than that of the shallow groundwater (22°C) and of the surface water (25°C). Surface water at ND inflow 1 demonstrates a higher temperature and DO than that at ND inflow 2, because of longer exposure to surface conditions. The temperature and DO continue to increase as the water travels though the wetland, giving rise to the high values measured 550 m downstream from ND inflow 1. Contrary to this trend, the wetland outflow demonstrates lower DO and temperature than that measured at the inflows. In explaining the lower DO, stagnation of surface water within the wetland was ruled out, as flow within the wetland body leading up to the outflow is generally shallow (1m) and turbulent due to the dense vegetation. Moreover, sampling of deep, slow-flowing water in the middle portion wetland showed DO concentrations consistently >5mg l1.
Time of sampling might have explained the lower temperature at the wetland outflow, with early morning samples reflecting cooling of the water body during the night. However, the daily mean (25.7°C), average daily Fig. 9. End member mixing diagram: end members evaluated are ND
inflow 1, ND inflow 2 and groundwater from (i) the Upper Roan aquifer and (ii) the catchment soil aquifer.
10.0 12.0 14.0 16.0 18.0 20.0 22.0 24.0 26.0
ND inflow 1 ND inflow 2 250 m 350 m 550 m ND outflow
T e mp erat u re ( o C) 0.0 2.0 4.0 6.0 8.0 10.0 12.0 14.0 D isso lved o xyg en ( m g /l)
Temperature Dissolved Oxygen
Figure 10: Dissolved oxygen and temperature of surface water at the wetland inflow (ND inflow 1 and 2), intervals down the wetland (250, 350 and 550 m from ND inflow 1) and at the wetland outflow during the dry season (HY2000). Error bars represent the 95% confidence interval.
the middle to late dry season streamflow from the wetland. This conclusion is consistent with the outcropping of the Upper Roan formation 200m upstream from the wetland outflow.
Hydrogeology
The hydrogeological model shown in Fig. 11 is based on the hydrological and hydrochemical evidence from the Chambishi catchment and the New Dam wetland. The model incorporates a two-aquifer system: a shallow, soil aquifer perched on the low permeability carbonaceous/ argillaceous shale and impure dolomite of the Kundelungu and Mwashia formations, and a deeper aquifer within the underlying dolomite of the Upper Roan formation, which recharges along the rim of the Chambishi Basin. The outcropping of the Upper Roan formation in the lower extent of the wetland enables this aquifer to discharge 200 m upstream of the wetland outflow. The dolomite signature of the shallow groundwater originates primarily through weathering of the dolomite-containing bedrock, with some communication with the deep aquifer along peripheral faults, fractures and seepage zones possible. The model incorporates overland and subsurface storm-flow, and dual aquifer discharge during the wet season, with storm-flow and perched aquifer discharge dominating the wetland hydrology. However, discharge from the perched aquifer is minimal or absent during the dry season, when groundwater discharge from the Upper Roan aquifer controls the hydrology and hydrochemistry of the New Dam wetland.
Conclusions
This paper describes the hydrological budget of a catchment containing a wetland and the budget of the wetland itself. Most rainfall input (98% of catchment input budget), was lost to ET (83% of output budget) while 17% resulted in discharge from the catchment. Various hydrological attributes of the wetland are described.
l Hydrograph separation and stormflow coefficient analysis suggest that New Dam wetland does not substantially retard or attenuate storm-flow.
l Based on the ACRU model simulation, ET from the wetland (1503 mm) was lower than from that from miombo-vegetated interfluves (1646 mm), but higher than the ET calculated for various other land-cover types.
l Wetland drainage did not form a major component of sustained dry season streamflow at the wetland outflow, demonstrating that the New Dam does not function, substantially, as a sponge of water.
Figure 11: Hydrogeological model of the New Dam catchment for the wet season and the dry season. Deep aquifer lithology is primarily dolomite. A is deep aquifer recharge, B is deep aquifer discharge, C1 is soil aquifer discharge, C2 is the perched water-table, D is overland stormfow and E is sub-surface stormflow.
maximum (31.4°C) and minimum (14.8°C) air temperatures during the sampling period (Ndola Metereological Station, 2001) suggest that the wetland outflow water temperature (17°C) is too low to reflect night-time cooling of the water body. Moreover, the wetland outflow was always sampled later in the day than the upper wetland and samples were usually collected after 3pm. Thus, as the temperature and DO of the Upper Roan aquifer are consistent with those measured at the wetland outflow, the field data strongly support the hypothesis of deeper aquifer discharge sustaining
= Precipitation = Evapotranspiration DRY SEASON WET SEASON A A B B B B C2 C2 D D E E C1 C1
l Streamflow from the wetland was sustained throughout the dry season and, by the middle to late dry season, groundwater discharge into the wetland was the sole source of streamflow at the wetland outflow.
l Groundwater input to the wetland is probably through a two aquifers system: a perched aquifer in the soil and saprolite that recharges rapidly during the rains and declines, exponentially, in discharge following the rains, and a deeper bedrock or regolith aquifer that discharges low-volume baseflow and sustains this discharge throughout the year. This deeper aquifer forms the sole hydrological source to the wetland during the middle to late dry season. Surface and groundwater physical and chemical characteristics strongly support the deep Upper Roan aquifer as this deeper bedrock aquifer. Although the dambo is in a catchment substantially altered by mining activities and cannot be considered as a pristine system, the hydrological influences of mining at Chambishi are restricted to a surface input to the system. Accordingly, it is felt that the results and conclusions in this paper are transferable, with care, to other dambo systems within the region and further afield, especially as the results are consistent with the findings published from other studies.
Acknowledgements
This work was funded by the Rhodes Trust under a Rhodes Scholarship to C.J. von der Heyden. The authors wish to thank Chambishi Metals PLC and especially Ms Nerine Botes and Mr Neville Roberts for access to CMPLC monitoring data and to their land. They would also like to thank Mr Richie and Mrs Debbie Peters, and Mr Ronnie and Mrs Gaye Marais for their help and support during the fieldwork. Many thanks are due also to Ms Janet Smith (AARL), Prof. Mike Edmunds (BGS) and Prof. Warren Wood (USGS) for their assistance with sample analysis and to Prof. Warren Wood and Ms Sophie Herden for critical reviews of the paper.
References
Acres, B.D., Rains, A.B., King, R.B., Lawton, R.M., Mitchell, A.J.B. and Rackman, L.J., 1985. African dambos: their distribution, characteristics and use. Z. Geomorph., Supplementbande 52, 6368.
Archer, D.R. and Mäckel, R.M., 1973. Calcrete deposits on the Lusaka Plateau of Zambia. Catena, 1, 1930.
Balek, J., 1977. Hydrology and water resources in tropical Africa. Elsevier, Amsterdam, The Netherlands.
Balek, J. and Perry, J.E., 1972. Luano catchment reserve project. Water Resources Research Report WR20. National Council for Scientific Research, Lusaka, Zambia.
Balek, J. and Perry, J.E., 1973. Hydrology of seasonally inundated African headwater swamps. J. Hydrol., 19, 227249.
Ball, J.W. and Nordstrom, D.K., 1991. WATEQ4F - Users manual with revised thermodynamic database and test cases for calculating speciation of major, trace and redox elements in natural waters. Open-File Report 90-129, U. S. Geological Survey, Reston, Virginia, USA.
Bell, M., Faulkner, R., Hotchkiss, P., Lambert, R., Roberts, N. and Windram, A., 1987. The use of dambos in rural development with reference to Zimbabwe. Final Report of ODA Project R3869, Overseas Development Administration, London, UK. Boast, R., 1990. Dambos: a review. Prog. Phys. Geog., 14, 153
177.
Bullock, A., 1992a. Dambo hydrology in southern Africa - review and reassessment. J. Hydrol., 134, 373396.
Bullock, A., 1992b. The role of dambos in determining river flow regimes in Zimbabwe. J. Hydrol., 134, 349372.
Burns, D.A., McDonnell, J.J., Hooper, R.P., Peters, N.E., Freer, J.E., Kendall, C. and Beven, K., 2001. Quantifying contributions to storm runoff through end member mixing analysis and hydrological measurements at the Panola Mountain research watershed (Georgia, USA). Hydrol. Process., 15, 19031924. Chilton, P.J. and Foster, S.S.D., 1995. Hydrogeological
characterisation and water-supply potential of basement aquifers in tropical Africa. Hydrogeol J., 3, 3649.
Debenham, F., 1948. The water resources of Central Africa. Geogr. J., 111, 222234.
Domenico, P.A. and Schwartz, F.W., 1990. Physical and chemical hydrogeology. Wiley, New York, USA.
Drayton, R.S., Kidd, C.H.R., Mandeville, A.N. and Miller, J.B., 1980. A regional analysis of river floods and low flows in Malawi. Institute of Hydrology, Rept. No. 72, Wallingford, Oxon.,UK.
Faulkner, R.D. and Lambert, R.A., 1991. The effect of dambo irrigation on dambo hydrology: a case study. J. Hydrol., 123, 147161.
Foster, H.J., Lees, M.J., Wheater, H.S., Neal, C. and Reynolds, B., 2001. A hydrochemical modelling framework for combined assessment of spatial and temporal variability in stream chemistry: Application to Plynlimon, Wales. Hydrol. Earth Syst. Sci., 5, 4958.
Freeze, A.R. and Cherry, J.A., 1979. Groundwater. Prentice - Hall, New Jersey, USA.
Garlick, W.G., 1961a. Chambishi - Nkana Basin. In: The geology of the Northern Rhodesian Copperbelt, F. Mendelsohn (Ed). Macdonald and Co..Ltd., London, UK. 281296.
Garlick, W.G., 1961b. Geomorphology. In: The geology of the Northern Rhodesian Copperbelt, F. Mendelsohn (Ed.). Macdonald and Co..Ltd., London UK. 1115.
Hooper, R.P., Christophersen, N. and Peters, N.E., 1990. Modelling streamwater chemistry as a mixture of soilwater end-members - an application to the Panola Mountian Catchment, Georgia, USA. J. Hydrol., 116, 321343.
Horowitz, A.J., Demas, C.R., Fitzgerald, K.K., Miller, T.L. and Rickert, D.A., 1994. U.S. Geological Survey protocol for the collection and processing of surface-water samples for the subsequent determination of inorganic constituents in filtered water. U.S. Geological Survey, Open-File Rept. No. 94-539, United States Geological Survey, Reston, Virginia, USA. Hughes, C.E., Kalma, J.D., Binning, P., Willgoose, G.R. and
Vertzonis, M., 2001. Estimating evapotranspiration for a temperate salt marsh, Newcastle, Australia. Hydrol. Process.,
15, 957975.
Kanthack, F., 1945. Relationship between rainfall and run-off in central Southern Africa. Proc. S. African Civil Eng., 43. 2948.
Kimble, G.T., 1960. Tropical Africa, Volume 1. The Twentieth Century Fund, New York, USA.
Koterba, M.T., Wilde, F.D. and Lapham, W.W., 1995. Ground-water data-collection protocols and procedures for the national water-quality assessment program: collection and documentation of water-quality samples and related data. U.S. Geological Survey, Open-File Rept. No. 95-399, United States Geological Survey, Reston, Virginia,USA.
Leeder, M.R., 1982. Sedimentology: Process and Product. Allen and Unwin, London,UK.
Limpitlaw, D., 2002. An Assessment of Mining Impacts on the Environment in the Zambian Copperbelt. PhD Thesis, University of the Witwatersrand, Johannesburg, Republic of South Africa. Lupankwe, M., Stewart, J.B. and Owen, R.J., 2000. Classification of dambos using remotely sensed data. Phys. Chem. Earth B -Hydrol. Oceans Atmos., 25, 589591.
Mäckel, R.M., 1985. Dambos and related landforms in Africa -an example for the ecological approach to tropical geomorphology. Z. Geomorph., Supplementbande 52, 124. Maidment, D.R., 1993. Handbook of hydrology. McGraw - Hill.,
New York., USA
McCartney, M.P., 2000. The water budget of a headwater catchment containing a dambo. Phys. Chem. Earth B - Hydrol. Oceans Atmos., 25, 611616.
McCartney, M.P. and Neal, C., 1999. Water flow pathways and water balance within a headwater catchment containing a dambo: inferences drawn from hydrochemical investigations. Hydrol. Earth Syst. Sci., 3, 581591.
McCartney, M.P., Butterworth, J., Moriarty, P. and Owen, R., 1998. Comparison of the hydrology of two contrasting headwater catchments in Zimbabwe. In: Hydrology, water resources and ecology in headwaters, M.P. McCartney, J. Butterworth, P. Moriarty and R. Owen (Eds.) IAHS Publ. no. 248.
McFarlane, M.J., 1989. Dambos - their characteristics and geomorphological evolution in parts of Malawi and Zimbabwe, with particular reference to their role in the hydrogeological regime of surviving areas of African surface, Groundwater Exploration and Development in Crystalline Basement Aquifers Workshop. Commonwealth Science Council, Tech. Pap. 273. Commonwealth Science Council, Harare. 254302.
McLane, M., 1995. Sedimentology. Oxford University Press, New York, USA.
Mendelsohn, F., 1961. The geology of the Northern Rhodesian Copperbelt. Macdonald and Co. Ltd, London, UK.
Mumeka, A. and Mwasile, C., 1986. Some aspects of hydrology of dambos in Zambia, In: Proceedings The national workshop on dambos. Ministry of Agriculture and Water Development, Nanga, 111127.
Ndola Metereological Station, 2001. Metereological data. Ndola Metereological Station, Ndola, Zambia .
Oyebande, L. and Balek, J., 1989. Humid warm sloping land. In: Comparative hydrology: an ecological approach to land and water resources, M. Falkenmark and T.G. Chapman (Eds.), UNESCO, Paris, France.
Parkhurst, D.L. and Appelo, C.A.J., 1999. Users guide to PHREEQC (Version 2) - a computer program for speciation, batch-reaction, one-dimensional transport, and inverse geochemical calculations. Water-Resources Investigations Rept. No. 99-4259, United States Geological Survey, Reston, Virginia, USA.
Penman, H.L., 1948. Natural evaporation from open water, bare soil and grass. Proc. Roy. Soc. Lond. A, 193, 120145. Schulze, R.E., 1979. Hydrology and water resources of the
Drakensberg. Natal Town and Regional Planning Rept. 42, Pietermaritzberg, South Africa.
Schulze, R.E., 1995. Hydrology and Agrohydrology: A text to accompany the ACRU 3.00 agrohydrological modelling system. Water Research Commission Rept. No. TT69/95, Pretoria, South Africa.
Scoones, I. and Cousins, B., 1994. Struggle for control over wetland resources in Zimbabwe. Soc. Natl. Resour., 7, 579 594.
Shelton, L.R., 1994. Field guide for collecting and processing stream-water samples for the national water-quality assessment program. U.S. Geological Survey, Open-File Rept. No. 94-455, United States Geological Survey, Reston, Virginia, USA. Smith-Carrington, A.K., 1983. Hydrological bulletin for the Bua
Catchment: Water resource unit number five, Department of Lands, Valuation and Water, Lilongwe, Malawi.
Smithers, J.C., 1991. Modelling the Ntabamhlope wetland: Initial results. Agric. Eng. S. Afr., 23, 440449.
Smithers, J.C. and Schulze, R.E., 1993. The influence of wetlands on streamflow regulation and flood attenuation: A modelling approach. In: Advances in hydro-science and engineering, S.S.Y. Wang (Ed.), University of Mississippi, Mississippi, USA. Stewart, J.B., 1989. Estimation of aerial evaporation from dambos
in Zimbabwe using satellite data. In: The basement aquifer Res.Rept. 1984-1989 No. WD/89/15, British Geological Survey, Wallingford, Oxon, UK.
US Department of the Interior, 1997. Water Measurement Manual. Water Resources Research Laboratory.
von der Heyden, C.J., 2003. The hydrology and hydrogeology of dambos: a review. Prog. Phys. Geog. (in press).
von der Heyden, C.J. and New, M.G., 2003. Groundwater pollution on the Zambian Copperbelt: deciphering the source and the risk. Sci Total. Environ. (in press).
Wade, J.A., Neal, C., Soulsby, C., Langan, S.J. and Smart, R.P., 2001. On modelling the effects of afforestation on acidification in heterogeneous catchments at different spatial and temporal scales. J. Hydrol., 250, 149169.
Whitlow, J.R., 1985. Dambos in Zimbabwe: a review. Z. Geomorph., Supplementbande 52, 115146.
Whitlow, R., 1990. Conservation status of wetlands in Zimbabwe: past and present. Geog. J., 20, 191202.