HAL Id: hal-00301425
https://hal.archives-ouvertes.fr/hal-00301425
Submitted on 16 Sep 2004
HAL is a multi-disciplinary open access
archive for the deposit and dissemination of
sci-entific research documents, whether they are
pub-lished or not. The documents may come from
teaching and research institutions in France or
abroad, or from public or private research centers.
L’archive ouverte pluridisciplinaire HAL, est
destinée au dépôt et à la diffusion de documents
scientifiques de niveau recherche, publiés ou non,
émanant des établissements d’enseignement et de
recherche français ou étrangers, des laboratoires
publics ou privés.
Halogens and the chemistry of the free troposphere
D. J. Lary
To cite this version:
D. J. Lary. Halogens and the chemistry of the free troposphere. Atmospheric Chemistry and Physics
Discussions, European Geosciences Union, 2004, 4 (5), pp.5367-5380. �hal-00301425�
ACPD
4, 5367–5380, 2004Halogens and Free
Tropospheric
Chemistry
D. J. Lary Title Page Abstract Introduction Conclusions References Tables Figures J I J I Back CloseFull Screen / Esc
Print Version Interactive Discussion
© EGU 2004
Atmos. Chem. Phys. Discuss., 4, 5367–5380, 2004
www.atmos-chem-phys.org/acpd/4/5367/
SRef-ID: 1680-7375/acpd/2004-4-5367
© European Geosciences Union 2004
Atmospheric
Chemistry
and Physics
Discussions
Halogens and the chemistry of the free
troposphere
D. J. Lary
1,2,31
Global Modelling and Assimilation Office, NASA Goddard Space Flight Center, Greenbelt, MD, USA
2
GEST at the University of Maryland Baltimore County, Baltimore, MD, USA
3
Unilever Cambridge Centre, Dep. of Chemistry, University of Cambridge, Cambridge, UK Received: 20 August 2004 – Accepted: 30 August 2004 – Published: 16 September 2004 Correspondence to: D. J. Lary ([email protected])
ACPD
4, 5367–5380, 2004Halogens and Free
Tropospheric
Chemistry
D. J. Lary Title Page Abstract Introduction Conclusions References Tables Figures J I J I Back CloseFull Screen / Esc
Print Version Interactive Discussion
© EGU 2004
Abstract
The role of halogens in both the marine boundary layer and the stratosphere has long
been recognized, while their role in the free troposphere is often not considered in
global chemical models. However, a careful examination of free-tropospheric chemistry
constrained by observations using a full chemical data assimilation system shows that
5
halogens do play a significant role in the free troposphere. In particular, the chlorine
initiation of methane oxidation in the free troposphere can contribute more than 10%,
and in some regions up to 50%, of the total rate of initiation. The initiation of methane
oxidation by chlorine is particularly important below the polar vortex and in northern
mid-latitudes. Likewise, the hydrolysis of BrONO
2alone can contribute more than 35%
10
of the HNO
3production rate in the free-troposphere.
1.
Introduction
Halogens play a variety of roles in atmospheric chemistry. Most notable is their
involve-ment in catalytic ozone loss and the formation of the stratospheric ozone hole (
John-ston and Podolske,
1978
;
Cicerone et al.
,
1983
;
Farman et al.
,
1985
). Like OH, they are
15
also involved in the initiation and catalysis of hydrocarbon oxidation and consequently
also play a role in the partitioning of OH and HO
2. Similarly they are involved with
the partitioning of NO and NO
2. Some of the same reactions involved in ozone hole
chemistry also lead to the production of nitric acid, namely the hydrolysis of BrONO
2and ClONO
2on sulphate aerosols. These roles are well known and accepted when
20
stratospheric chemistry is being discussed (
DeMore et al.
,
2000
). The role of halogens
is also important in the marine boundary layer (
Vogt et al.
,
1996
;
Sander and Crutzen
,
1996
;
Richter et al.
,
1998
;
Dickerson et al.
,
1999
;
Sander et al.
,
2003
;
von Glasow and
Crutzen,
2004
). However, when the chemistry of the free troposphere is considered
the role of halogens is not normally considered important.
25
ACPD
4, 5367–5380, 2004Halogens and Free
Tropospheric
Chemistry
D. J. Lary Title Page Abstract Introduction Conclusions References Tables Figures J I J I Back CloseFull Screen / Esc
Print Version Interactive Discussion
© EGU 2004
1995
;
Lary et al.
,
2003a
,
1995
;
Lary
,
1996
;
Lary et al.
,
2003b
;
Lary
,
2003
) (
http:
//pdfcentral.shriver.umbc.edu/AutoChem/) starting in October 1991 reveals that
halo-gens are also playing a significant role in the chemistry of the free troposphere.
Com-prehensive results from the analysis are available online at
http://pdfcentral.shriver.
umbc.edu/CDACentral/. In this study sulphate aerosol observations from SAGE II (
Ack-5
erman,
1989
;
Oberbeck et al.
,
1989
;
Russell and McCormick
,
1989
;
Thomason
,
1991
,
1992
;
Bauman et al.
,
2003
) and HALOE (
Hervig et al.
,
1993
,
1996
;
Hervig and Deshler
,
1998
;
Massie et al.
,
2003
) were used, ozone observations from UARS (
Reber et al.
,
1993
) MLS v6 (
Froidevaux et al.
,
1996
;
Waters
,
1998
), HALOE v19 (
Russell et al.
,
1993
), POAM, ozone sondes and LIDAR, nitric acid observations from UARS MLS v6
10
(
Santee et al.
,
1997
,
1999
), CLAES, ATMOS, CRISTA (
O
ffermann and Conway
,
1999
)
and ILAS (
Wood et al.
,
2002
), hydrochloric acid observations from UARS HALOE and
ATMOS, water observations from UARS HALOE v19, ATMOS and MOZAIC (
Marenco
et al.,
1998
), methane observations from UARS HALOE v19, ATMOS and CRISTA
were used. All though the bulk of these observations were in the stratosphere a
signif-15
icant number of satellite observations were available for the free troposphere down to
5 km, and from sondes and aircraft data is also available below 5 km (e.g. Fig.
1
).
The analyses grid used in this study is cast in equivalent PV latitude, potential
tem-perature coordinates. With 32 latitudes between 80
◦S and 80
◦N, and 24 logarithmically
spaced isentropic surfaces between the earth’s surface and 2400 K. As the potential
20
temperature at the surface changes with time we use a fixed number of isentropic levels
between the surface potential temperature for a given day and equivalent latitude band
and 500 K, above 500 K the levels remain fixed with time. The isentropic levels
corre-spond approximately to the UARS surfaces spaced at 6 per decade in pressure (c.f.
the UARS reference atmosphere levels
http://code916.gsfc.nasa.gov/Public/Analysis/
25
UARS/urap/home.html).
The following sections examine some of the roles halogens play in tropospheric
chemistry.
ACPD
4, 5367–5380, 2004Halogens and Free
Tropospheric
Chemistry
D. J. Lary Title Page Abstract Introduction Conclusions References Tables Figures J I J I Back CloseFull Screen / Esc
Print Version Interactive Discussion
© EGU 2004
2.
Initiation of hydrocarbon oxidation
Methane and hydrocarbon oxidation are some of the most significant atmospheric
chemical processes. The hydroxyl radical (OH) is an important cleansing agent of
the lower atmosphere, in particular, it provides the dominant sink for CH
4and HFCs
as well as the pollutants NO
x, CO and VOCs. Once formed, tropospheric OH reacts
5
with CH
4or CO within a second. It is generally accepted that the local abundance of
OH is controlled by the local abundances of NO
x, CO, VOCs, CH
4, O
3, and H
2O as
well as the intensity of solar UV; and thus it varies greatly with time of day, season, and
geographic location (
IPCC
,
2001
).
Methane oxidation is usually initiated by hydrogen abstraction reactions such as
10
OH
+ CH
4−→ CH
3+ H
2O ,
(1)
O(
1D)
+ CH
4−→ CH
3+ OH ,
(2)
Cl
+ CH
4−→ CH
3+ HCl ,
(3)
Br
+ CH
4−→ CH
3+ HBr .
(4)
The rate at which hydrogen is abstracted from CH
4by OH and Cl is a
15
strong function of temperature, altitude, and the total reactive chlorine loading
(ClO
y=2Cl
2+Cl + ClO + 2Cl
2O
2+ HCl + HOCl + ClONO
2).
Initiation of methane oxidation by Cl is a strong function of ClO
y.
Burnett and Burnett
(
1995
) have inferred from their OH column measurements that chlorine is likely to be
involved in the initiation and oxidation of methane. In agreement with this, Figs.
1
and
20
2
show that significant initiation of methane oxidation is due to Cl.
However, the halogen initiation and catalysis of hydrocarbons is not usually
consid-ered in global chemistry models. This is not due to a lack of kinetic knowledge but
rather an assumption that halogens play a minor role outside of the boundary layer
(
Vogt et al.
,
1996
;
Sander and Crutzen
,
1996
;
Richter et al.
,
1998
;
Dickerson et al.
,
25
1999
;
Sander et al.
,
2003
;
von Glasow and Crutzen
,
2004
) and stratosphere (
Johnston
ACPD
4, 5367–5380, 2004Halogens and Free
Tropospheric
Chemistry
D. J. Lary Title Page Abstract Introduction Conclusions References Tables Figures J I J I Back CloseFull Screen / Esc
Print Version Interactive Discussion
© EGU 2004
that in the lower stratosphere and even in the free troposphere, halogen-catalyzed, and
halogen-initiated, methane oxidation can be important. Halogen-catalyzed methane
oxidation can play a significant role in the production of HO
x(
=H + OH+HO
2) radicals
in just the region where it is usually accepted that nitrogen-catalyzed methane oxidation
is one of the main sources of ozone (
IPCC
,
2001
). Aspects of methane oxidation by
5
halogens has been previously mentioned by
Crutzen et al.
(
1992
);
Burnett and Burnett
(
1995
) and the mechanism specifically described by
Lary and Toumi
(
1997
).
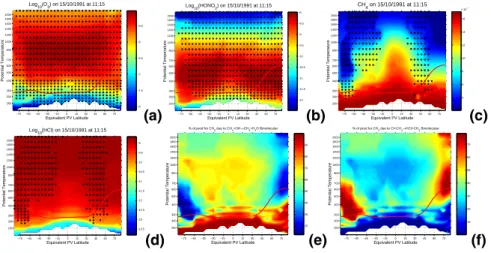
Figures
1
a–d show the global ozone, nitric acid, methane and hydrochloric acid
anal-yses from the surface up to the lower mesosphere produced by chemical data
assim-ilation for mid-October 1991. The analyses are presented as equivalent PV
latitude-10
potential temperature cross sections. The background colors show the log
10of the
volume mixing ratio and the overlaid color filled circles show the observations used.
The thick red line overlaid on the plots is the thermal tropopause diagnosed from the
UKMO analyses. The white space at the bottom of the plots is because the analysis
is terrain following and the surface potential temperature changes with time and
loca-15
tion. It can be seen that although the bulk of the observations are in the stratosphere
many observations are also available below the tropopause. Based on the analyses
produced by chemical data assimilation system Fig.
1
e shows the percentage of the
initiation of methane oxidation due to OH. At first glance it confirms the conventional
position that in the free-troposphere the initiation by OH is all that needs to be
consid-20
ered. However, on closer examination it can be seen that there are extensive regions
within the troposphere where the initiation of methane oxidation due to Cl (Fig.
1
f)
con-tributes more than 10% and some regions where it concon-tributes up to 50%. The regions
of significant initiation by Cl are, as would be expected, in the region below the polar
vortex, and more surprisingly in northern mid latitudes. The northern mid-latitude
fea-25
ture persists. For example, it can be seen that the mid-latitude role of chlorine initiation
is greater in February 1993 (Fig.
2
b).
ACPD
4, 5367–5380, 2004Halogens and Free
Tropospheric
Chemistry
D. J. Lary Title Page Abstract Introduction Conclusions References Tables Figures J I J I Back CloseFull Screen / Esc
Print Version Interactive Discussion
© EGU 2004
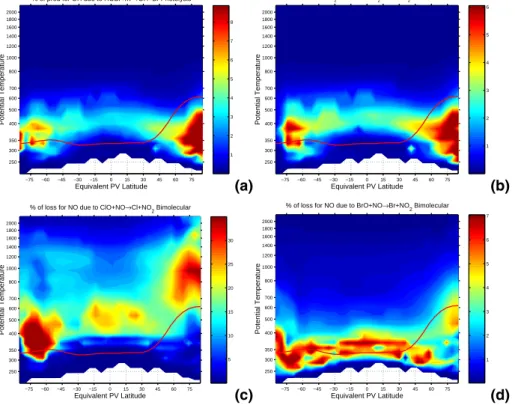
3.
Production of nitric acid
It is well known (
DeMore et al.
,
2000
) that two of the key nitric acid production channels
are the bimolecular reaction of OH with NO
2and the heterogeneous hydrolysis of N
2O
5on sulphate aerosols (please see Figs.
3
a and b). In the stratosphere the
heteroge-neous hydrolysis of ClONO
2and BrONO
2are also routinely considered (
DeMore et al.
,
5
2000
). However, as halogens are often normally not considered in models of the free
troposphere these channels are not normally considered in the troposphere. Figure
3
c
shows that the hydrolysis of BrONO
2alone can contribute more than 35% to the HNO
3production rate. Therefore excluding halogen chemistry from global chemical
mod-els can lead to a significant error in these regions, yet another reason for considering
10
halogen chemistry in the free troposphere.
4.
Partitioning of OH and HO
2HOBr is readily photolyzed in the visible and yields OH. Figure
4
a shows that HOBr
photolysis can contribute close to 10% of the total OH production rate at high latitudes
in the free-troposphere. Likewise Fig.
4
b shows that the production of HOBr by the
15
bimolecular reaction of BrO with HO
2contributes more than 5% to the total HO
2loss
rate at high latitudes in the free-troposphere.
5.
Partitioning of NO and NO
2The tropospheric partitioning of NO and NO
2is a
ffected by halogen interactions.
Fig-ure
4
c shows that there are large regions in northern mid-latitudes and below the
south-20
ern polar vortex where more than 10% of the loss of NO is due to reaction with ClO.
Figure
4
d shows that for much of the free-troposphere the reaction of NO with BrO
contributes more than 5% to the loss of NO.
ACPD
4, 5367–5380, 2004Halogens and Free
Tropospheric
Chemistry
D. J. Lary Title Page Abstract Introduction Conclusions References Tables Figures J I J I Back CloseFull Screen / Esc
Print Version Interactive Discussion
© EGU 2004
6.
Conclusions
A careful constraint of a photochemical modelling system using chemical data
assimi-lation and a variety of atmospheric observations has been conducted. A detailed
anal-ysis of the results shows that halogens are playing a role in the chemistry of the free
troposphere. In particular, methane oxidation is initiated by Cl as well as OH in the
5
troposphere. The Cl initiation of methane oxidation can contribute more than 10% to
the total rate of initiation below the polar vortex and in mid-latitudes. In addition, the
hydrolysis of BrONO
2alone can contribute more than 35% of the HNO
3production
rate in the free troposphere. The partitioning of NO and NO
2in the free troposphere is
also significantly a
ffected by halogen reactions.
10
Acknowledgements. It is a pleasure to acknowledge: NASA for a distinguished Goddard
Fel-lowship in Earth Science and for research support; The Royal Society for a Royal Society University Research Fellowship; The government of Israel for an Alon Fellowship; The NERC, EU, and ESA for research support.
References
15
Ackerman, M., Brogniez, C., Diallo, B. S., et al.: European validation of SAGE II aerosol profiles, J. Geophys. Res., 94, 8399–8411, 1989. 5369
Bauman, J. J., Russell, P. B., Geller, M. A., and Hamill, P.: A stratospheric aerosol climatology from SAGE II and CLAES measurements: 1. methodology, J. Geophys. Res.-Atmos., 108, AAC 6-1–AAC 6-3, 2003. 5369
20
Burnett, E. and Burnett, C.: Enhanced production of stratospheric OH from methane oxidation at elevated reactive chlorine levels in Northern midlatitudes, J. Atmos. Chem., 21, 13–41, 1995. 5370,5371
Cicerone, R. J., Walters, S., and Liu, S. C.: Non-linear response of stratospheric ozone column to chlorine injections, J. Geophys. Res.-Atmos., 88, 3647–3661, 1983. 5368,5370
25
Crutzen, P. J., Muller, R., Bruhl, C., and Peter, T.: On the potential importance of the gas-phase reaction CH3O2+ ClO−→ ClOO + CH3O and the heterogeneous reaction HOCl+ HCl−→ H2O+ Cl2in ozone hole chemistry, Geophys. Res. Lett., 19, 1113–1116, 1992. 5371
ACPD
4, 5367–5380, 2004Halogens and Free
Tropospheric
Chemistry
D. J. Lary Title Page Abstract Introduction Conclusions References Tables Figures J I J I Back CloseFull Screen / Esc
Print Version Interactive Discussion
© EGU 2004
DeMore, W. B., Howard, C. J., Sander, S. P., Ravishankara, A. R., Golden, D. M., Kolb, C. E., Hampson, R. F. Molina, M. J., and Kurylo, M. J.: Chemical kinetics and photochemical data for use in stratospheric modeling, supplement to evaluation 12: Update of key reactions, JPL Publ. 00-3, 2000. 5368,5372
Dickerson, R. R., Rhoads, K. P., Carsey, T. P., Oltmans, S. J., Burrows, J. P., and Crutzen,
5
P. J.: Ozone in the remote marine boundary layer: A possible role for halogens, J. Geophys. Res.-Atmos., 104, 21 385–21 395, 1999. 5368,5370
Farman, J. C., Gardiner, B. G., and Shanklin, J. D.: Large losses of total ozone in antarctica reveal seasonal ClOx/NOxinteraction, Nature, 315, 207–210, 1985. 5368,5370
Fisher, M. and Lary, D.: Lagrangian 4-dimensional variational data assimilation of
chemical-10
species, Q. J. R. Meteorol. Soc., 121, 1681–1704, 1995. 5368
Froidevaux, L., Read, W. G., Lungu, T. A., Cofield, R. E., Fishbein, E. F., Flower, D. A., Jarnot, R. F., Ridenoure, B. P., Shippony, Z., Waters, J. W., Margitan, J. J., McDermid, I. S., Stachnik, R. A., Peckham, G. E., Braathen, G., Deshler, T., Fishman, J., Hofmann, D. J., and Oltmans, S. J.: Validation of UARS microwave limb sounder ozone measurement, J. Geophys.
Res.-15
Atmos., 101, 10 017–10 060, 1996. 5369
Hervig, M., Russell, J., Gordley, L., Drayson, S., Stone, K., Thompson, R., Gelman, M., Mc-Dermid, I., Hauchecorne, A., Keckhut, P., McGee, T., Singh, U., and Gross, M.: Validation of temperature measurements from the halogen occultation experiment, J. Geophys. Res., 101, 10 277–10 285, 1996. 5369
20
Hervig, M. E. and Deshler, T.: Stratospheric aerosol surface area and volume inferred from HALOE, CLAES, and ILAS measurements, J. Geophys. Res.-Atmos., 103, 25 345–25 352, 1998. 5369
Hervig, M. E., Russell, J. M., Gordley, L. L., Park, J. H., and Drayson, S. R.: Observations of aerosol by the HALOE experiment onboard UARS – a preliminary validation, Geophys. Res.
25
Lett., 20, 1291–1294, 1993. 5369
IPCC: Climate Change 2001: The Scientific Basis, UNEP, 2001. 5370,5371
Johnston, H. S. and Podolske, J.: Interpretation of stratospheric photochemistry, Rev. Geo-phys., 16, 491, 1978. 5368,5370
Lary, D.: Gas phase atmospheric bromine photochemistry, J. Geophys. Res., 101, 1505–1516,
30
1996. 5369
Lary, D.: Representativeness uncertainty in chemical data assimilation highlight mixing barriers, Atmospheric Science Letters, 5, 35–41, 2003. 5369
ACPD
4, 5367–5380, 2004Halogens and Free
Tropospheric
Chemistry
D. J. Lary Title Page Abstract Introduction Conclusions References Tables Figures J I J I Back CloseFull Screen / Esc
Print Version Interactive Discussion
© EGU 2004
Lary, D. and Toumi, R.: Halogen-catalyzed methane oxidation, J. Geophys. Res., 102, 23 421– 23 428, 1997. 5371
Lary, D., Chipperfield, M., and Toumi, R.: The potential impact of the reaction OH+ClO−→HCl+ O2on polar ozone photochemistry, J. Atmos. Chem., 21, 61–79, 1995. 5369
Lary, D. J., Khattatov, B., and Mussa, H. Y.: Chemical data assimilation: A case study of solar
5
occultation data from the atlas 1 mission of the atmospheric trace molecule spectroscopy experiment (atmos), J. Geophys. Res.-Atmos., 108, 2003a. 5369
Lary, D. J., Khattatov, B., and Mussa, H. Y.: Chemical data assimilation: A case study of solar occultation data from the atlas 1 mission of the atmospheric trace molecule spectroscopy experiment (atmos), J. Geophys. Res.-Atmos., 108, 2003b. 5369
10
Marenco, A., Thouret, V., Nedelec, P., Smit, H., Helten, M., Kley, D., Karcher, F., Simon, P., Law, K., Pyle, J., Poschmann, G., Von Wrede, R., Hume, C., and Cook, T.: Measurement of ozone and water vapor by airbus in-service aircraft: The MOZAIC airborne program, an overview, JGRa, 103, 25 631–25 642, 1998. 5369
Massie, S., Randel, W., Wu, F., Baumgardner, D., and Hervig, M., Halogen occultation
experi-15
ment and stratospheric aerosol and gas experiment ii observations of tropopause cirrus and aerosol during the 1990s, J. Geophys. Res., 108(D7), 4222, doi:10.1029/2002JD002662, 2003. 5369
Oberbeck, V. R., Livingston, J. M., Russell, P. B., Pueschel, R. F., Rosen, J. N., Osborn, M. T., Kritz, M. A., Snetsinger, K. G., and Ferry, G. V.: SAGE-II aerosol validation – selected altitude
20
measurements, including particle micromeasurements, J. Geophys. Res.-Atmos., 94, 8367– 8380, 1989. 5369
Offermann, D. and Conway, R. R.: Crista/mahrsi – preface, J. Geophys. Res.-Atmos., 104, 16 309–16 310, 1999. 5369
Reber, C. A., Trevathan, C. E., Mcneal, R. J., and Luther, M. R., The upper-atmosphere
re-25
search satellite (UARS) mission, J. Geophys. Res.-Atmos., 98, 10 643–10 647, 1993. 5369
Richter, A., Wittrock, F., Eisinger, M., and Burrows, J. P.: Gome observations of tropospheric bro in northern hemispheric spring and summer 1997, Geophys. Res. Lett., 25, 2683–2686, 1998. 5368,5370
Russell, J. M., Gordley, L. L., Park, J. H., Drayson, S. R., Hesketh, W. D., Cicerone, R. J., Tuck,
30
A. F., Frederick, J. E., Harries, J. E., and Crutzen, P. J.: The halogen occultation experiment, J. Geophys. Res.-Atmos., 98, 10 777–10 797, 1993. 5369
ACPD
4, 5367–5380, 2004Halogens and Free
Tropospheric
Chemistry
D. J. Lary Title Page Abstract Introduction Conclusions References Tables Figures J I J I Back CloseFull Screen / Esc
Print Version Interactive Discussion
© EGU 2004
introduction and overview, J. Geophys. Res.-Atmos., 94, 8335–8338, 1989. 5369
Sander, R. and Crutzen, P. J.: Model study indicating halogen activation and ozone destruction in polluted air masses transported to the sea, J. Geophys. Res.-Atmos., 101, 9121–9138, 1996. 5368,5370
Sander, R., Keene, W. C., Pszenny, A. A. P., Arimoto, R., Ayers, G. P., Baboukas, E., Cainey,
5
J. M., Crutzen, P. J., Duce, R. A., Honninger, G., Huebert, B. J., Maenhaut, W., Mihalopoulos, N., Turekian, V. C., and Van Dingenen, R.: Inorganic bromine in the marine boundary layer: a critical review, Atmos. Chem. Phys., 3, 1301–1336, 2003. 5368,5370
Santee, M. L., Manney, G. L., Froidevaux, L., Zurek, R. W., and Waters, J. W.: MLS observa-tions of ClO and HNO3 in the 1996-97 arctic polar vortex, Geophys. Res. Lett., 24, 2713–
10
2716, 1997. 5369
Santee, M. L., Manney, G. L., Froidevaux, L., Read, W. G., and Water, J. W.: Six years of UARS microwave limb sounder HNO3 observations: Seasonal, interhemispheric, and interannual variations in the lower stratosphere, J. Geophys. Res.-Atmos., 104, 8225–8246, 1999. 5369
Thomason, L. W.: A diagnostic stratospheric aerosol size distribution inferred from SAGE-II
15
measurements, J. Geophys. Res.-Atmos., 96, 22 501–22 508, 1991. 5369
Thomason, L. W.: Observations of a new SAGE-II aerosol extinction mode following the erup-tion of Mt. Pinatubo, Geophys. Res. Lett., 19, 2179–2182, 1992. 5369
Vogt, R., Crutzen, P. J., and Sander, R.: A mechanism for halogen release from sea-salt aerosol in the remote marine boundary layer, Nature, 383, 327–330, 1996. 5368,5370
20
von Glasow, R. and Crutzen, P. J.: Model study of multiphase DMS oxidation with a focus on halogens, Atmos. Chem. Phys., 4, 589–608, 2004. 5368,5370
Waters, J. W.: Atmospheric measurements by the MLS experiments: Results from UARS and plans for the future, in CIRA Part III Reference Atmospheres – Trace Constituent Models – Comparison with Latest Data, vol. 21 of Advances in Space Research,1363–1372, 1998.
25
5369
Wood, S. W., Bodeker, G. E., Boyd, I. S., Jones, N. B., Connor, B. J., Johnston, P. V., Matthews, W. A., Nichol, S. E., Murcray, F. J., Nakajima, H., and Sasano, Y.: Validation of version 5.20 ILAS HNO3, CH4, N2O, O3, and NO2using ground-based measurements at Arrival Heights and Kiruna, J. Geophys. Res.-Atmos., 107, 2002. 5369
ACPD
4, 5367–5380, 2004Halogens and Free
Tropospheric
Chemistry
D. J. Lary Title Page Abstract Introduction Conclusions References Tables Figures J I J I Back CloseFull Screen / Esc
Print Version Interactive Discussion
© EGU 2004
−8 −7.5 −7 −6.5 −6 −5.5 −75−60−45−30−15 0 15 30 45 60 75 250 300 350 400 500 600 700 800 1000 1200 1400 1600 1800 2000 Equivalent PV Latitude Potential Temperature Log10(O3) on 15/10/1991 at 11:15 (a) −12 −11.5 −11 −10.5 −10 −9.5 −9 −8.5 −8 −75−60−45−30−15 0 15 30 45 60 75 250 300 350 400 500 600 700 800 1000 1200 1400 1600 1800 2000 Equivalent PV Latitude Potential Temperature Log 10(HONO2) on 15/10/1991 at 11:15 (b) 4 6 8 10 12 14 16 x 10−7 −75−60−45−30−15 0 15 30 45 60 75 250 300 350 400 500 600 700 800 1000 1200 1400 1600 1800 2000 Equivalent PV Latitude Potential Temperature CH 4 on 15/10/1991 at 11:15 (c) −13.5 −13 −12.5 −12 −11.5 −11 −10.5 −10 −9.5 −9 −75−60−45−30−15 0 15 30 45 60 75 250 300 350 400 500 600 700 800 1000 1200 1400 1600 1800 2000 Equivalent PV Latitude Potential Temperature Log10(HCl) on 15/10/1991 at 11:15 (d) 20 30 40 50 60 70 80 90 −75−60−45−30−15 0 15 30 45 60 75 250 300 350 400 500 600 700 800 1000 1200 1400 1600 1800 2000 Equivalent PV Latitude Potential Temperature% of prod for CH3 due to CH4+OH→CH3+H2O Bimolecular
(e) 10 20 30 40 50 60 70 −75−60−45−30−15 0 15 30 45 60 75 250 300 350 400 500 600 700 800 1000 1200 1400 1600 1800 2000 Equivalent PV Latitude Potential Temperature
% of prod for CH3 due to Cl+CH4→HCl+CH3 Bimolecular
(f)
Fig. 1. Panels (a–d) show the global ozone, nitric acid, methane and hydrochloric acid analyses
from the surface up to the lower mesosphere produced by chemical data assimilation for mid-October 1991. The analyses are presented as equivalent PV latitude – potential temperature cross sections. The background colors show the log10 of the volume mixing ratio and the overlaid color filled circles show the observations used. The thick red line overlaid on the plots is the thermal tropopause diagnosed from the UKMO analyses. The white space at the bottom of the plots is because the analysis is terrain following and the surface potential temperature changes with time and location. It can be seen that although the bulk of the observations are in the stratosphere many observations are also available below the tropopause. Based on the analyses produced by chemical data assimilation system panel(e) shows the percentage of the
initiation of methane oxidation due to OH. At first glance it confirms the conventional position that in the free-troposphere the initiation by OH is all that needs to be considered. However, on closer examination it can be seen that there are extensive regions within the troposphere where the initiation of methane oxidation due to Cl (panel(f)) contributes more than 10% and
some regions where it contributes up to 50%. The regions of significant initiation by Cl are, as would be expected, in the region below the polar vortex, and more surprisingly in northern mid latitudes. The northern mid-latitude feature persists. For example, it can be seen that the mid-latitude role of chlorine initiation is greater in February 1993 (Fig.2panel b).
ACPD
4, 5367–5380, 2004Halogens and Free
Tropospheric
Chemistry
D. J. Lary Title Page Abstract Introduction Conclusions References Tables Figures J I J I Back CloseFull Screen / Esc
Print Version Interactive Discussion
© EGU 2004
20 30 40 50 60 70 80 90 −75 −60 −45 −30 −15 0 15 30 45 60 75 250 300 350 400 500 600 700 800 1000 1200 1400 1600 1800 2000 2200 Equivalent PV Latitude Potential Temperature% of prod for CH3 due to CH4+OH→CH3+H2O Bimolecular
(a) 5 10 15 20 25 30 35 40 45 50 55 −75 −60 −45 −30 −15 0 15 30 45 60 75 250 300 350 400 500 600 700 800 1000 1200 1400 1600 1800 2000 2200 Equivalent PV Latitude Potential Temperature
% of prod for CH3 due to Cl+CH4→HCl+CH3 Bimolecular
(b)
Fig. 2. This is the analogue to Fig.1panels (e) and (f) for mid-February 1993. It can be seen that the northern mid-latitude role of chlorine initiation is slightly greater than for December 1991.
ACPD
4, 5367–5380, 2004Halogens and Free
Tropospheric
Chemistry
D. J. Lary Title Page Abstract Introduction Conclusions References Tables Figures J I J I Back CloseFull Screen / Esc
Print Version Interactive Discussion
© EGU 2004
10 20 30 40 50 60 70 80 90 −75 −60 −45 −30 −15 0 15 30 45 60 75 250 300 350 400 500 600 700 800 1000 1200 1400 1600 1800 2000 Equivalent PV Latitude Potential Temperature% of prod for HONO
2 due to OH+NO2→HONO2+m Trimolecular
(a) 0 10 20 30 40 50 60 −75 −60 −45 −30 −15 0 15 30 45 60 75 250 300 350 400 500 600 700 800 1000 1200 1400 1600 1800 2000 Equivalent PV Latitude Potential Temperature
% of prod for HONO
2 due to H2O+N2O5→HONO2+HONO2 (Heterogeneous SA)
(b) 0 5 10 15 20 25 30 35 −75 −60 −45 −30 −15 0 15 30 45 60 75 250 300 350 400 500 600 700 800 1000 1200 1400 1600 1800 2000 Equivalent PV Latitude Potential Temperature
% of prod for HONO
2 due to H2O+BrONO2→HOBr+HONO2 (Heterogeneous SA)
(c) 0 1 2 3 4 5 6 7 −75 −60 −45 −30 −15 0 15 30 45 60 75 250 300 350 400 500 600 700 800 1000 1200 1400 1600 1800 2000 Equivalent PV Latitude Potential Temperature
% of prod for HONO
2 due to H2O+ClONO2→HOCl+HONO2 (Heterogeneous SA)
(d)
Fig. 3. The contribution of four of the main HNO3 production channels. It is well known that two of the key nitric acid production channels in the troposphere are the bimolecular reaction of OH with NO2 (panel(a)) and the heterogeneous hydrolysis of N2O5 on sulphate aerosols (panel (b)). In the stratosphere the heterogeneous hydrolysis of ClONO2 (panel (c)) and
BrONO2(panel(d)) is also routinely considered. It can be seen that they are also significant
ACPD
4, 5367–5380, 2004Halogens and Free
Tropospheric
Chemistry
D. J. Lary Title Page Abstract Introduction Conclusions References Tables Figures J I J I Back CloseFull Screen / Esc
Print Version Interactive Discussion
© EGU 2004
1 2 3 4 5 6 7 8 −75 −60 −45 −30 −15 0 15 30 45 60 75 250 300 350 400 500 600 700 800 1000 1200 1400 1600 1800 2000 Equivalent PV Latitude Potential Temperature% of prod for OH due to HOBr+hν→OH+Br Photolysis
(a) 1 2 3 4 5 6 −75 −60 −45 −30 −15 0 15 30 45 60 75 250 300 350 400 500 600 700 800 1000 1200 1400 1600 1800 2000 Equivalent PV Latitude Potential Temperature % of loss for HO
2 due to BrO+HO2→HOBr+O2 Bimolecular
(b) 5 10 15 20 25 30 −75 −60 −45 −30 −15 0 15 30 45 60 75 250 300 350 400 500 600 700 800 1000 1200 1400 1600 1800 2000 Equivalent PV Latitude Potential Temperature
% of loss for NO due to ClO+NO→Cl+NO2 Bimolecular
(c) 1 2 3 4 5 6 7 −75 −60 −45 −30 −15 0 15 30 45 60 75 250 300 350 400 500 600 700 800 1000 1200 1400 1600 1800 2000 Equivalent PV Latitude Potential Temperature
% of loss for NO due to BrO+NO→Br+NO2 Bimolecular
(d)
Fig. 4. HOBr is readily photolyzed in the visible and yields OH. Panel (a) shows that HOBr
photolysis can contribute close to 10% of the total OH production rate at high latitudes in the free-troposphere. Likewise panel(b) shows that the production of HOBr by the bimolecular
reaction of BrO with HO2contributes more than 5% to the total HO2loss rate at high latitudes in the free-troposphere. The tropospheric partitioning of NO and NO2 is affected by halogen interactions. Panel(c) shows that there are large regions in northern mid-latitudes and below
the southern polar vortex where more than 10% of the loss of NO is due to reaction with ClO. Panel(d) shows that for much of the free-troposphere the reaction of NO with BrO contributes