HAL Id: hal-00301549
https://hal.archives-ouvertes.fr/hal-00301549
Submitted on 1 Jun 2005HAL is a multi-disciplinary open access
archive for the deposit and dissemination of sci-entific research documents, whether they are pub-lished or not. The documents may come from teaching and research institutions in France or abroad, or from public or private research centers.
L’archive ouverte pluridisciplinaire HAL, est destinée au dépôt et à la diffusion de documents scientifiques de niveau recherche, publiés ou non, émanant des établissements d’enseignement et de recherche français ou étrangers, des laboratoires publics ou privés.
Characterization and source apportionment of
atmospheric organic and elemental carbon during fall
and winter of 2003 in Xi’an, China
J. J. Cao, J. C. Chow, S. C. Lee, Y. Li, S. W. Chen, Z. S. An, K. Fung, J. G.
Watson, C. S. Zhu, S. X. Liu
To cite this version:
J. J. Cao, J. C. Chow, S. C. Lee, Y. Li, S. W. Chen, et al.. Characterization and source apportionment of atmospheric organic and elemental carbon during fall and winter of 2003 in Xi’an, China. Atmo-spheric Chemistry and Physics Discussions, European Geosciences Union, 2005, 5 (3), pp.3561-3593. �hal-00301549�
ACPD
5, 3561–3593, 2005 Characterization and source apportionment of Xi’an OC and EC J. J. Cao et al. Title Page Abstract Introduction Conclusions References Tables Figures J I J I Back CloseFull Screen / Esc
Print Version Interactive Discussion
EGU
Atmos. Chem. Phys. Discuss., 5, 3561–3593, 2005 www.atmos-chem-phys.org/acpd/5/3561/
SRef-ID: 1680-7375/acpd/2005-5-3561 European Geosciences Union
Atmospheric Chemistry and Physics Discussions
Characterization and source
apportionment of atmospheric organic
and elemental carbon during fall and
winter of 2003 in Xi’an, China
J. J. Cao1, J. C. Chow2, S. C. Lee3, Y. Li1, S. W. Chen4, Z. S. An1, K. Fung5, J. G. Watson2, C. S. Zhu1, and S. X. Liu1
1
State Key Laboratory of Loess & Quaternary Geology, Institute of Earth Environment, Chinese Academy of Sciences, Xi’an 710075, China
2
Desert Research Institute, Reno, USA 3
The Hong Kong Polytechnic University, Hong Kong, China 4
Tongji University, Shanghai 200 092, China 5
AtmAA Inc., Calabasas, CA, USA
Received: 14 March 2005 – Accepted: 7 April 2005 – Published: 1 June 2005 Correspondence to: J. J. Cao ([email protected])
ACPD
5, 3561–3593, 2005 Characterization and source apportionment of Xi’an OC and EC J. J. Cao et al. Title Page Abstract Introduction Conclusions References Tables Figures J I J I Back CloseFull Screen / Esc
Print Version Interactive Discussion
EGU
Abstract
Continuous observation of atmospheric organic and elemental carbon (OC, EC) were conducted at Xi’an during high pollution seasons from September 2003 to Febru-ary 2004. PM2.5 samples were collected on pre-fired quartz-fiber filters with battery-powered mini-volume samplers every day and PM10samples were collected every third 5
days. Three types of source samples (i.e., coal-combustion, motor vehicle exhaust, and biomass burning) were also collected during ambient sampling period. Ambient and source samples were analyzed for OC and EC by thermal/optical reflectance (TOR) fol-lowing the Interagency Monitoring of Protected Visual Environments (IMPROVE) pro-tocol. The average PM2.5 OC concentrations in fall and winter were 34.1±18.0 µg m−3 10
and 61.9±33.2 µg m−3, respectively, while EC were 11.3±6.9 µg m−3and 12.3±5.3 µg m−3, respectively. Most of OC and EC were associated with fine particle (PM2.5) mode. The OC and EC levels at Xi’an are higher than most urban cities in Asia. The OC and EC in fall were found to be strongly correlated (R2>0.9), with moderate correlation in
winter (R2=0.66). The carbonaceous aerosol accounted for 48.8±10.1% of the PM2.5 15
during fall and 45.9±7.5% during winter. Average OC/EC ratio was 3.3 in fall and 5.1 in winter with individual OC/EC ratios constantly exceeding 2.0. Elevated OC/EC ratios were found during heating seasons with increased coal combustion. The contribution of secondary organic carbon was not significant during winter. The time series of OC and EC showed periodic variability. Traffic contributes 5 and 7 day peaks in the spec-20
trum, precipitation appears as a 10 day periodicity and biomass burning can be iden-tified as a 24 day periodicity. Total carbon (TC) was apportioned by absolute principal component analysis (APCA) using the 8 carbon fraction data (OC1, OC2, OC3, OC4, EC1, EC2, EC3, and OP [a pyrolyzed carbon fraction]). TC attributes 73% to gasoline exhaust, 23% to diesel exhaust, and 4% to biomass burning during fall. However, TC 25
attributes 44% each to gasoline exhaust and coal burning, 9% to biomass burning, and 3% to diesel exhaust during winter.
ACPD
5, 3561–3593, 2005 Characterization and source apportionment of Xi’an OC and EC J. J. Cao et al. Title Page Abstract Introduction Conclusions References Tables Figures J I J I Back CloseFull Screen / Esc
Print Version Interactive Discussion
EGU
1. Introduction
Study of atmospheric organic carbon (OC) and elemental carbon (EC, also named black carbon, BC) in China has received intensive attentions in recent years due to the high emission of OC and EC and their impacts on global/regional climatic and environ-mental changes (IPCC, 2001; ACE-Asia, 1999, http://saga.pmel.noaa.gov/aceasia/; 5
Project Atmospheric Brown Clouds (ABC), 2003, http://www-abc-asia.ucsd.edu/). Roughly one-fourth of global BC emissions are estimated from China (Cooke et al., 1999). Control of emission of BC from China was considered as a most effective way for slowing global warming (Jacobson et al., 2002). Elevated OC and EC contributed to high particulate matter (PM) pollution in urban area (He et al., 2001; Ye et al., 2003; 10
Cao et al., 2003, 2004). In a regional scale, EC heats the air, alter atmospheric stabil-ity and vertical motions, and affect the large-scale circulation and hydrologic cycle with significant regional climate effects in China (Menon et al., 2002).
Several studies have been conducted on developed and coastal cities like Beijing, Shanghai, Guangzhou, and Hong Kong (He et al., 2001, Ye et al., 2003; Cao et al., 15
2003, 2004), but limited studies were available for inland cities in China. Xi’an situated in northwest China and it was selected as the city with high PM pollution in the United Nation Development Program (UNDP) pilot study during 1997 and 2001 (Zhang et al., 2001, 2002). Xi’an has been the capital city of 13 Chinese dynasties for more than a millennium. Since the discovery of terra-cotta warriors and horse, Xi’an became one of 20
the most popular tourist attractions in China. In addition to coal-combustion and vehicle exhaust, Xi’an is impacted by mineral dust and dust storm (Zhuang et al., 1992, 1993; Gao et al., 1997; Cao et al., 2005). Therefore, the primary objectives of the paper are to: 1) examine the temporal variations of PM2.5(particle diameter smaller than 2.5 µm) and PM10 (particle diameter smaller than 10 µm) OC and EC concentrations, and 2) 25
ACPD
5, 3561–3593, 2005 Characterization and source apportionment of Xi’an OC and EC J. J. Cao et al. Title Page Abstract Introduction Conclusions References Tables Figures J I J I Back CloseFull Screen / Esc
Print Version Interactive Discussion
EGU
2. Sampling and analysis
2.1. Sampling sites and descriptions
Xi’an (33◦290–34◦440N, 107◦400–109◦490E, population 5 million), the largest city in northwestern China, lies in the south margin of the Loess Plateau, China. The Xi’an monitoring site (400 m above the sea level) (Fig. 1) is situated ∼15 km south of down-5
town Xi’an. The site has an urban-scale zone of representation (Chow et al., 2002) with no major industrial activities or local fugitive dust sources in the surrounding area, which is mostly residential. PM2.5 and PM10 samples were obtained from the rooftop of the Institute of Earth Environment, Chinese Academy of Sciences, at 10 m above ground level. PM samples were collected during fall (13 September 2003 to 31 Octo-10
ber 2003) and winter (1 November 2003 to 29 February 2004). 2.2. Sample collection
Daily PM2.5 and every third days PM10 samples were collected using two battery-powered mini volume samplers (Airmetrics, Oregon, USA) operating at flow rates of 5 l min−1(Cao et al., 2003). Prior to field operations, calibrated mini-vol samplers were 15
collocated with low volume PM2.5and PM10Partisol samplers (model 2000, Rupprecht & Patashnick, Albany, New York, USA) at The Hong Kong Polytechnic University for data comparison. The difference between the two types of samplers was less than 5% for the PM2.5and PM10 mass.
PM samples were collected on 47 mm Whatman quartz microfiber filters (QM/A); 20
the filters were pre-heated at 900◦C for 3 h before sampling. The exposed filters were stored in a refrigerator at about 4◦C before chemical analysis to prevent the evapora-tion of volatile components. Quartz-fiber filters were analyzed gravimetrically for mass concentrations using a Sartorius MC5 electronic microbalance with a ±1 µg sensitivity (Sartorius, G ¨ottingen, Germany). These filters were weighed after 24-h equilibration 25
ACPD
5, 3561–3593, 2005 Characterization and source apportionment of Xi’an OC and EC J. J. Cao et al. Title Page Abstract Introduction Conclusions References Tables Figures J I J I Back CloseFull Screen / Esc
Print Version Interactive Discussion
EGU
45%. Each filter was weighed at least three times before and after sampling, and the net mass was obtained by subtracting the difference between the averaged pre- and post-sampling weights. Precisions of the weighings were <10 µg for blank filters and
<20 µg for filter samples. A total of 16 field blanks were collected to subtract the
posi-tive artifacts due to adsorption of gas-phase organic components onto the filter during 5
and/or after sampling. However, negative artifacts due to volatilization of particle-phase organics from particle sample were not quantified. A total of 165 PM2.5 and 53 PM10 samples were collected, respectively. Five PM2.5 source samples were collected from the coal-combustion of residential stoves, six samples collected from a major highway with heavy traffic, and five samples collected from a farmland when the maize residue 10
combusted after harvest during ambient sampling period.
Continuous meteorological data were monitored by HFY-IA Wind Speed/Wind Di-rection Instrument (Changchun Institute of Metrological Instruments, Changchun, Jilin Province, China).
2.3. Thermal/optical carbon analysis 15
The samples were analyzed for OC and EC using a Desert Research Institute (DRI) Model 2001 Thermal/Optical Carbon Analyzer (Atmoslytic Inc., Calabasas, CA, USA). A 0.5 cm2 punch from the filter was analyzed for eight carbon fractions following the IMPROVE (Interagency Monitoring of Protected Visual Environments) thermal/optical reflectance (TOR) protocol (Chow et al., 1993, 2001, 2004; Fung et al., 2002). This 20
produced four OC fractions (OC1, OC2, OC3, and OC4 at 120◦C, 250◦C, 450◦C, and 550◦C, respectively, in a He atmosphere); a pyrolyzed carbon fraction (OP, de-termined when reflected a transmittance laser light attained its original intensity after O2 was added to the analysis atmosphere); and three EC fractions (EC1, EC2, and EC3 at 550◦C, 700◦C, and 800◦C, respectively, in a 2% O2/98% He atmosphere). IM-25
PROVE OC is operationally defined as OC1+OC2+OC3+OC4+OP and EC is defined as EC1+EC2+EC3-OP. Inter-laboratory comparisons of samples between IMPROVE protocol with the DRI Model 2001 instrument and the TMO (thermal manganese
diox-ACPD
5, 3561–3593, 2005 Characterization and source apportionment of Xi’an OC and EC J. J. Cao et al. Title Page Abstract Introduction Conclusions References Tables Figures J I J I Back CloseFull Screen / Esc
Print Version Interactive Discussion
EGU
ide oxidation) method (done by AtmAA, Inc., Calabasas, CA) has shown difference
<5% for total carbon (TC) and 10% for OC and EC (Fung et al., 2002). Average
field blanks were 1.56 and 0.42 µg m−3 for OC and EC, respectively. Quality Assur-ance/Quality Control (QA/QC) procedures were described in Cao et al. (2003).
3. Results and discussion
5
3.1. Temporal variations of OC and EC
Monthly and seasonally averaged OC and EC concentrations are summarized in Ta-ble 1. PM2.5 OC and EC during winter are 1.8 and 1.1 times, respectively, of those during fall. PM10OC and EC during winter are 2.2 times and 1.5 times, respectively, of those during fall. Monthly average OC and EC were highest during December and low-10
est during September. In December OC in PM2.5 and PM10 were 81.7±36.2 µg m−3 and 124.8±54.8 µg m−3, respectively, and EC in PM2.5 and PM10 were 15.2±4.6 µg m−3 and 28.9±8.9 µg m−3, respectively. For PM2.5 and PM10, highest to lowest values of OC were 3.3 and 4.2 and EC were 1.8 and 2.6, respectively. High variability of OC concentrations may be due to the contributions of different emission sources.
15
Figure 2 shows that temporal variations of PM2.5 OC coincide with mass, and to a lesser extend, with EC. The Pearson correlation coefficients of these two series was as high as 0.96 (significant level 99%), pointing to OC is major contributor to PM2.5 mass. The Person correlation coefficients of PM2.5mass and EC also reached to 0.72 (significant level 99%), implying EC is a significant contributor to PM2.5 mass. PM2.5 20
OC increased gradually from September to November, and reached a maximum on 14 December 2003 (189.6 µg m−3). The PM variations at Xi’an have a winter maximum and summer minimum (Zhang et al., 2001), so this OC value is expected to be the highest value in the year. PM2.5 OC concentrations fluctuated from mid-December to earlier January. After the Chinese Spring Festival (22 January 2004 to 29 January 25
ACPD
5, 3561–3593, 2005 Characterization and source apportionment of Xi’an OC and EC J. J. Cao et al. Title Page Abstract Introduction Conclusions References Tables Figures J I J I Back CloseFull Screen / Esc
Print Version Interactive Discussion
EGU
of EC variation was found, but the EC concentration was lowest during the Chinese Spring Festival and fluctuated in low values from 22 January 2004 to 5 February 2004. The major emission sources of OC and EC in China includes coal-combustion, motor vehicle exhaust, and biomass burning (includes biofuels) (Streets et al., 2001). Previ-ous study showed that coal-combustion and motor vehicle exhaust were the two major 5
emission sources of TSP (Total Suspended Particle) (Zhang et al., 2001). During the study periods, the impact of biomass burning seems evident because Xi’an is located in the Guanzhong Plain, a major base of national rice/corn production. During the fall harvest season in mid-October, the residue of diverse crops like corn were mainly cleaned by field combustion. Residential combustion of biofuels is also a significant 10
contributor during wither because part of farmer around Xi’an use it as heating source. Therefore, coal-combustion, motor vehicle exhaust, and biomass burning constitute the major emission sources of carbonaceous pollution during fall and winter in Xi’an.
Wet deposition is the dominant mechanism to remove OC and EC. As shown in Ta-ble 2, the precipitation days in fall were 13 days, account for 27% of observational days, 15
however, compared to 6 days or 5% of total observational days in winter. During pre-cipitation, average OC and EC decreased to 16.2 µg m−3and 4.3 µg m−3, respectively, which may mirror the urban background values of OC and EC in high pollution seasons at Xi’an. Average OC and EC levels in winter precipitation days were two times of those in fall, i.e., with 34.7 µg m−3for OC and 8.6 µg m−3 for EC, reflecting the low quantity 20
and shorter duration of precipitation in winter. PM2.5 mass and carbon concentrations increased by two to three folds during normal day period for both seasons.
3.2. Relationship between OC and EC
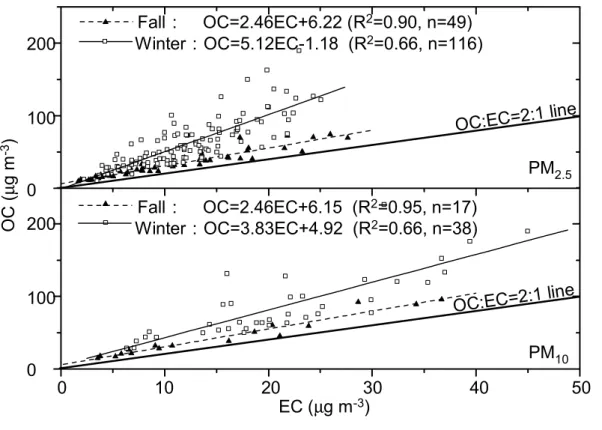
The origin of carbonaceous particles can be estimated on the basis of the relationship between OC and EC (Turpin and Huntzicker, 1991; Chow et al., 1996). As shown in 25
Fig. 3, strong OC-EC correlations (0.90–0.95) were found in fall, suggesting impacts from similar sources (e.g., motor vehicle exhaust and biomass burning). In contrast, the correlations (0.66) were low in winter, pointing to the complex of emission sources.
ACPD
5, 3561–3593, 2005 Characterization and source apportionment of Xi’an OC and EC J. J. Cao et al. Title Page Abstract Introduction Conclusions References Tables Figures J I J I Back CloseFull Screen / Esc
Print Version Interactive Discussion
EGU
Coal-combustion from residential heating in winter is the major emission sources of OC and EC. It contributes to more than 50% to TSP (1997 data, Zhang et al., 2001). Even though many residents in Xi’an replaced coal by natural gas, a large body of low-income families still use coal as major source of cooking and heating in winter. Coal-combustion boilers has been banned within the second beltway in the downtown 5
since 1998, but many middle- and small- scales coal-combustion boilers inside and outside Xi’an downtown are still in use due to its low cost.
The slopes of OC versus EC in winter were high, 5.12 for PM2.5and 3.83 for PM10, as compared to those in fall (2.46) (Fig. 3), implying the emission of OC increased largely relative to EC in winter. The difference may be ascribed to the change of emission 10
sources in two seasons.
3.3. Variability of OC/EC ratios
Atmospheric EC originates from primary anthropogenic sources and is not formed by reactions involving gaseous hydrocarbon precursors in the atmosphere. OC may be emitted directly from sources as primary particles, but secondary organic aerosols 15
(SOA) can also be formed in the atmosphere from the low vapor pressure products by atmospheric chemical reactions. The ratio of OC to EC concentrations has been used to study emission and transformation characteristics of carbonaceous aerosol.
As shown in Table 1, average OC/EC ratios in PM2.5and PM10ranged from 3.0 to 3.4 in fall, and increased to 3.6–6.4 in winter. Monthly averages of OC/EC ratios ranged 20
3.3–6.4 in PM2.5 and 3.0–5.1 in PM10with the highest ratios found in January.
Daily variations of PM2.5 OC/EC ratios in Fig. 2 showed lower ratios and less vari-ations in fall and higher ratios and more varivari-ations in winter. The ratios were around 8.0 during 13 December 2003 to 15 December 2003, and reached a peak value of 9.0 during 22 January 2004 to 29 January 2004. OC/EC ratios were normally affected by 25
three factors: 1) emission sources; 2) the formation of SOA in the atmosphere; 3) the removal of OC and EC. Since EC has higher washout efficiency than OC (Cachier et al., 1996), OC/EC ratio can be increased accordingly. From Table 2, average OC/EC
ACPD
5, 3561–3593, 2005 Characterization and source apportionment of Xi’an OC and EC J. J. Cao et al. Title Page Abstract Introduction Conclusions References Tables Figures J I J I Back CloseFull Screen / Esc
Print Version Interactive Discussion
EGU
ratios were 4.0 under precipitation days. Since the precipitation days were small (only 5%) in winter (116 days), the effect of OC/EC ratios during and 1–2 days after pre-cipitation are expected to be low. A long prepre-cipitation period during Chinese National Holiday (from 28 September 2003 to 4 October 2003) led to a peak OC/EC ratio of 6.0 in fall.
5
The OC/EC ratios exceeding 2.0 have been used to indicate the presence of SOA (Gray et al., 1986; Chow et al., 1996). Pandis’ study (Pandis, 2002) indicated that the formation of SOA in the ambient air was mainly controlled by temperature. The temperature at Xi’an ranged from −5◦C to 5◦C with dense haze and short duration of sunshine in winter. So the formation of SOA in Xi’an may be low. Cabada’s study 10
(Cabada, 2002) in western Pennsylvania also confirmed that the contribution of SOA in winter decreased to zero.
Average OC/EC ratio were 12.0 in coal-combustion samples, 4.1 in motor vehicle (from gasoline vehicles) exhaust samples, and 60.3 in biomass burning samples. For comparison, the OC/EC ratio was 2.7 for coal-combustion sample and 1.1 for motor 15
vehicle sample (Watson et al., 2001), and 9.0 for biomass burning (Cachier et al., 1989). The individual OC/EC ratios for this study exceeded 2.0 for both PM2.5 and PM10 fractions (Fig. 2), which may mirror the joint contributions from coal-combustion, motor vehicle exhaust, and biomass burning sources. Elevated OC/EC ratios (8.0) during 12 December 2003 to 14 December 2003 can be attributed to biomass burning. 20
High OC/EC ratios (6.0–9.0) during the Chinese Spring Festival (22 January 2004 to 5 February 2004) was owing to less contribution from motor vehicle during holiday and more contribution from residential coal-combustion.
3.4. Contributions to PM2.5and PM10 mass
The box plot in Fig. 4 showed that PM10was more scatter than PM2.5in both seasons. 25
Daily PM10 in winter varied by a factor of 5.7, ranging from 155 µg m−3 (6 November 2003) to 885 µg m−3(14 December 2003). The average PM2.5was 140.1 µg m−3in fall
ACPD
5, 3561–3593, 2005 Characterization and source apportionment of Xi’an OC and EC J. J. Cao et al. Title Page Abstract Introduction Conclusions References Tables Figures J I J I Back CloseFull Screen / Esc
Print Version Interactive Discussion
EGU
and 258.7 µg m−3in winter. The average PM10 was 261.9 µg m−3 in fall and 450.6 µg m−3 in winter. PM2.5 accounted for 55.6% of the PM10 in fall, ranging between 44.3% and 77.4%. In contrast, PM2.5 accounted for 60.4% of the PM10 in winter with a large range from 33.0% and 97.6%. For comparison, the order of the percentage of PM2.5 in the PM10 in Chinese urban cities was Shenzhen (73.3%, 2001) (Cao et al., 2003) > 5
Zhuhai (70.8%, 2001) (Cao et al., 2003) > Chongqing (65.1%, 1997) (Wei et al., 1999)
> Wuhan (60.5%, 1997) (Wei et al., 1999) > Xi’an (60.4%, 2003) > Lanzhou (51.9%,
1997) (Wei et al., 1999). In reference to Class 2 of the Chinese PM10standard (150 µg m−3) (GB 3905–1996), only 5 out of the PM10 sampling days in fall in compliance with the legislation and none of the days in winter. This implies a serious PM pollution in 10
Xi’an even with substantial efforts on pollution to control by local government.
As shown in Table 3, total carbonaceous aerosol (TCA), the sum of organic matter (OM=1.6×OC) and EC, contributed 48.8% of PM2.5 in fall and 45.9% in winter. The percentage of TCA in PM10 was lower than PM2.5, with an average of 34.5% in fall and 37.0% in winter, may due to an increased contributions of geological matter in 15
coarse particles. Taking into account the contributions of other sources such as ge-ological materials and secondary aerosol (sulfate, nitrate, and ammonium) to PM2.5, it is reasonable to speculate that TCA is the most important contributor to fine parti-cles. The material balance showed that TCA is the dominant components of PM2.5 (Li Y., 2004). It is thus that control measures should be aimed to the anthropogenic 20
combustion sources rather than fugitive dust.
From time series in Fig. 2, TCA% varied around the 45% level during the six months and it didn’t correlate with the changes of PM2.5 mass or the OC and EC concentra-tions. Level of TCA% is co-varied with the precipitant events and low PM periods. Dur-ing precipitation, OC and EC usually resided in sub-micron size ranges (0.01–1 µm), 25
leading to an increase in the percentage of OC and EC and resulted in elevated TCA% levels.
PM2.5OC accounted for 81.8% and 72.8%, respectively, of PM10OC, whereas PM2.5 EC accounted for 75.0% and 59.6% of PM10 EC in fall and winter, respectively
(Ta-ACPD
5, 3561–3593, 2005 Characterization and source apportionment of Xi’an OC and EC J. J. Cao et al. Title Page Abstract Introduction Conclusions References Tables Figures J I J I Back CloseFull Screen / Esc
Print Version Interactive Discussion
EGU
ble 1). Less than 60% of PM10 EC resided in PM2.5 in winter, reflecting the presence of coarse soot particles in the emission of incomplete coal-combustion.
3.5. The characterization of eight carbon fractions
The IMPROVE TOR protocol does not advance from one temperature to the next until a well-defined carbon peak has evolved (Chow et al., 1993, 2004). Carbon abundances 5
in each of these fractions differ by carbon source (Chow et al., 2003). 8 carbon fractions have been utilized for the source apportionment of carbonaceous aerosol (Kim et al., 2003a, 2004).
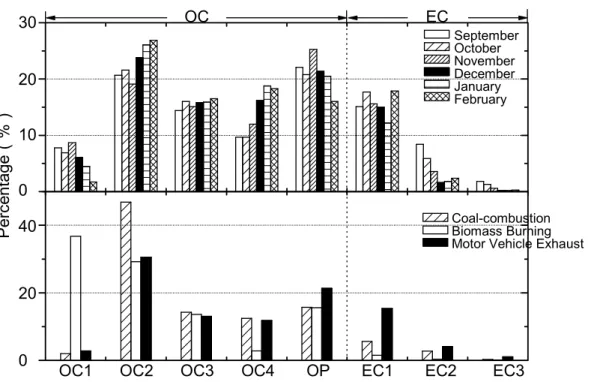
The average percentages of 8 carbon fractions in ambient and source samples are shown in Fig. 5. There are distinct differences among three sources samples for 8 car-10
bon fractions. OC2 accounted for 46.9% of TC in coal-combustion samples, higher than 29.2% in biomass burning samples and 30.5% in motor vehicle samples. OC1 con-tributed 36.8% to TC in biomass burning samples, higher than 2.0% in coal-combustion samples and 2.8% in motor vehicle exhaust samples. EC1 constituted 15.4% to TC, higher than 5.6% in coal-combustion samples and 0.4% in biomass burning samples. 15
Monthly variations of the 8 carbon fractions were related to the contributions of di ffer-ent emission sources. November experienced the highest contribution from biomass burning sources, with OC1 attaining 8.7%, which was the highest value in six months. It decreased to 1.7% in February. The variations of OC1 may point to the contribu-tions of biomass burning in different months. OC2 increased in six months (except 20
November), possible reflecting the increased contributions of coal-combustion from fall to winter. EC1 reached its lowest values in January, implying decreased contributions of motor vehicle exhaust. This may be due to the less activity of motor vehicles during the Chinese Spring Festival, consistent with the analysis of OC/EC ratios (Sect. 3.3). OP was 22.1%, 20.8%, 25.3%, 21.4%, 20.5%, and 16.0% in six months, with an av-25
erage of 21.0%. In contrast, the percentage of OP in TC varied between 8.0% and 17.8% during summer for Pearl River Delta Region in China (Cao et al., 2004).
ACPD
5, 3561–3593, 2005 Characterization and source apportionment of Xi’an OC and EC J. J. Cao et al. Title Page Abstract Introduction Conclusions References Tables Figures J I J I Back CloseFull Screen / Esc
Print Version Interactive Discussion
EGU
3.6. Periodic characteristics of OC and EC
Concentrations of OC and EC were influenced by emissions and dilution processes. The periodic features of emission sources and metrological conditions can be identified from the time series of OC and EC. Hies (2000) showed that domestic heating by coal combustion appears with a 365 day periodicity, traffic contributes 3.5, 4.6 and 7 day 5
peaks in the spectrum and elevated long range EC can be identified as characteristic peaks with periodicities in the range from 13 to 42 days in Berlin, Germany.
The comparison of periodicities of OC, EC, PM2.5 mass and daily average wind speed are illustrated in Fig. 6. These curves were obtained by AutoSignal 1.0 soft-ware (SPSS, USA). The common periodicities of OC, EC and PM2.5 were 24 days, 10
10 days, 7 days and 5 days. The periodicities of OC were same as PM2.5, implying they were controlled by similar process, consistent with correlation of OC with PM2.5. 7 days and 5 days were the periodicities of motor vehicle variations, in agreement with Hies’ study (Hies, 2000). Precipitation events had 10 days periodicity from September to November. This periodicity should reflect the impact of precipitation on OC and EC 15
concentrations. 24 days periodicity may point to the biomass burning events since the biomass burning events occurred about every 24 days. In addition, EC also had com-ponents of 60 days and 13 days peaks in the spectrum. 13 days periodicity was a major component in the spectrum of wind speed, which has been identified by Hies (2000). Wind speed also influences EC concentrations. 60 day peaks may be related to the 20
change of primary emission sources. From Fig. 2, September and October were the low period of EC, November and December were the high period of EC, January and February were also the low period of EC. In conclusion, 7 days and 5 days periodicities of OC and EC were controlled by motor vehicle exhaust, 10 days periodicities were related to precipitation, and 24 days periodicities were associated with the biomass 25
ACPD
5, 3561–3593, 2005 Characterization and source apportionment of Xi’an OC and EC J. J. Cao et al. Title Page Abstract Introduction Conclusions References Tables Figures J I J I Back CloseFull Screen / Esc
Print Version Interactive Discussion
EGU
3.7. Comparison of OC and EC with other Asian cities
At least 30 analytical methods existed for OC and EC in different labs, TC measures agree (Schmid et al., 2001) but differences can be found for OC and EC.
Table 4 lists the TC, OC and EC concentrations from Xi’an and other Asian cities. TC in fall and winter at Xi’an ranked the highest, reflecting serious carbonaceous pollution 5
in Xi’an. Comparing with the data from Beijing, Xi’an OC and EC were same as Bei-jing’s in fall. Xi’an EC was same as Beijing EC in winter, but Xi’an OC was two times of Beijing OC. From the analysis of OC and EC distributions in source samples, high OC contents in Xi’an could be ascribed to contributions from coal-combustion. More motor vehicles and less coal are used in Beijing (Yang et al., 2005). Winter OC levels in Xi’an 10
were 3.6, 6.4, 2.7, 4.7, and 5.1 times than those in Shanghai, Hong Kong, Guangzhou, Shenzhen and Zhuhai. Winter EC levels in Xi’an were 1.5, 2.6, 1.5, 2.0, and 2.5 times those of the coastal cities. The lower difference for EC may be attributed to the high emissions of motor vehicle exhaust in these coast cities and the larger difference of OC may be ascribed to the lower use of coal for residential heating. Winter OC and 15
EC levels in Xi’an were 12.4 and 2.9 times those in Chongju, South Korea (Lee et al., 2001).
3.8. Source apportionment of carbonaceous aerosol
8 carbon fractions of TC have been utilized to estimate sources attributions (Kim et al., 2003a, b, 2004). Absolute principal component analysis (APCA) (Thurston & Spengler, 20
1985) was used in this study.
The first step in APCA is the normalization of all carbon concentrations as Zi k; this is done through the addition of a zero concentration sample as case 0.
Zi k = (Ci k− Ci)/Si (1) where Ci k is the concentration of carbon fraction i in sample k, Ci is the arithmetic 25
ACPD
5, 3561–3593, 2005 Characterization and source apportionment of Xi’an OC and EC J. J. Cao et al. Title Page Abstract Introduction Conclusions References Tables Figures J I J I Back CloseFull Screen / Esc
Print Version Interactive Discussion
EGU
fraction i for all samples included in the analysis. The normalization process allows any continuous variables, such as wind speed to be included in future analyses along with the carbon data.
Regressing the TC data on these absolute principal component scores (APCS) gives estimates of the coefficients which convert the APCS into TC-contributions from each 5
source for each sample. For each source identified by the APCA, the weighted regres-sion of each carbon’s concentration on the predicted TC contributions yields estimates of the content of that carbon in each source, as follows:
Ci k = b +
n
X
j=1
ai jMj k (2)
where Ci k is the concentration of carbon fraction i in sample k; b is a constant; ai j 10
is the mean TC fraction of source j ’s particles represented by carbon fraction i , and
Mj k is the TC concentration of source j for observation k. By repeating this weighted least square regression for each of the i=1, 2,...n carbon fractions considered in this analysis, one can estimate the mean concentration of the carbon fractions in each factor.
15
The statistical results for fall and winter were summarized in Tables 5 and 6.
Factor 1 (F1) in fall was highly loaded with the following carbon fractions: OC2, OC3, OC4, OP, and EC1. This factor appears to represent gasoline motor vehicle exhaust. The second component (F2) was highly loaded with EC2 and EC3 and appears to rep-resent diesel vehicle exhaust because it contains lots of high temperature component 20
of EC particles (Watson et al., 1994). The high loading of OC1 in the factor 3 (F3) reflects the contribution of biomass burning. The interpretation of the first factor (F1) in winter is complicated because it is highly loaded with OC2, OC3, OC4, and EC1. This factor may represent the mixture of coal-combustion and motor vehicle exhaust because these two sources are correlated in winter by similar dispersion conditions for 25
surface-based emissions. Similar to the fall results, F2 and F3 in winter represents biomass burning and diesel vehicle exhaust, respectively.
ACPD
5, 3561–3593, 2005 Characterization and source apportionment of Xi’an OC and EC J. J. Cao et al. Title Page Abstract Introduction Conclusions References Tables Figures J I J I Back CloseFull Screen / Esc
Print Version Interactive Discussion
EGU
To simplify the estimation, we assumed there is no contribution of coal-combustion in fall and there are contributions from gasoline motor vehicle in fall and winter. The con-tribution of winter F1 to TC subtracted from the concon-tribution of fall F1 was considered as the contribution of coal-combustion to TC. Thus the source attributions can be resolved for the two seasons (Fig. 7). TC is composed of 73% from gasoline exhaust, 23% from 5
diesel exhaust, and 4% from biomass burning during fall. TC during winter receives 44% from gasoline exhaust, 44% from coal burning, 9% from biomass burning, and 3% from diesel exhaust. The TC source apportionments during fall and winter were consistent with the qualitative analysis of different sources in aforementioned sections.
4. Conclusions
10
Six-month continuous observations of OC and EC were conducted at Xi’an to gain in-sight into the characterization and source apportionment of OC and EC. Major findings are as follows.
1) Average PM2.5 OC concentrations during fall and winter were 34.1±18.0 µg m−3 and 61.9±33.2 µg m−3; and EC concentrations were 11.3±6.9 µg m−3and 12.3±5.3 µg 15
m−3, respectively. Carbonaceous aerosol accounted for 48.8±10.1% and 45.9±7.5% of PM2.5 and 34.5±9.3% and 37±8.9% of PM10 during fall and winter, respectively. This indicates that carbonaceous aerosol is the dominant component of fine particles in a typical city with high mineral dust pollution in north China like Xi’an.
2) All the OC/EC ratios exceeded 2.0 and average OC/EC ratio were 3.3 in fall and 20
5.1 in winter. Elevated OC/EC ratios were found during heating seasons with increased primary emission sources like coal combustion. PM2.5 OC and PM10 OC were highly correlated (R2=0.90–0.95) during fall, and moderately correlated (R2=0.66) during win-ter.
3) PM2.5 TC source apportionment by APCA attributes 73% to gasoline exhaust, 25
23% to diesel exhaust, and 4% to biomass burning during fall. PM2.5 TC source ap-portionment attributes 44% each to gasoline exhaust and coal burning, 9% to biomass
ACPD
5, 3561–3593, 2005 Characterization and source apportionment of Xi’an OC and EC J. J. Cao et al. Title Page Abstract Introduction Conclusions References Tables Figures J I J I Back CloseFull Screen / Esc
Print Version Interactive Discussion
EGU
burning, and 3% to diesel exhaust during winter. Therefore, motor vehicle exhaust and coal-combustion were the dominant sources for carbonaceous aerosol in Xi’an, which should be paid more attentions to control them.
Acknowledgements. This project is supported by the National Natural Science Foundation of
China (40205018, 40121303), National Basic Research Program of China (2004CB720203),
5
and Research Grants Council of Hong Kong (PolyU5038/01E, PolyU5145/03E), Area of Strate-gic Development on Atmospheric and Urban Air Pollution (A516) funded by The Hong Kong Polytechnic University.
References
Cabada, J. C., Pandis, S. N., and Robinson, A. L.: Sources of Atmospheric Carbonaceous
10
Particulate Matter in Pittsburgh, Pennsylvania, J. Air & Waste Manage. Assoc., 52, 732–741, 2002.
Cachier, H., Liousse, C., Pertuisot, M. H., et al.: African fire particulate emissions and at-mospheric influence, in: Biomass Burning and Global Change, edited by: Levine, J. S., 428–440, MIT Press, Cambridge, Mass., 1996.
15
Cachier, H., Bremond, M. P., and Buat-Menard, P.: Carbonaceous aerosols from different trop-ical biomass burning sources, Nature, 340, 371–373, 1989.
Cao, J. J., Lee, S. C., Ho, K. F., et al.: Characteristics of Carbonaceous Aerosol in Pearl River Delta Region, China during 2001 Winter Period, Atmos. Environ., 37, 1451–1460, 2003. Cao, J. J., Lee, S. C., Ho, K. F., et al.: Spatial and seasonal variations of atmospheric organic
20
carbon and elemental carbon in Pearl River Delta Region, China, Atmos. Environ., 38, 4447– 4456, 2004.
Cao, J. J., Lee, S. C., Zhang, X. Y., et al.: Characterization of airborne carbonate over a site on Asian Dust source regions during 2002 spring and its climatic and environmental significance, J. Geophys. Res., 110, D03203, doi:10.1029/2004JD005244, 2005.
25
Chow, J. C., Watson, J. G., Pritchett, L. C., et al.: The DRI thermal/optical reflectance carbon analysis system: description, evaluation and applications in US air quality studies, Atmos. Environ., 27A (8), 1185–1201, 1993.
ACPD
5, 3561–3593, 2005 Characterization and source apportionment of Xi’an OC and EC J. J. Cao et al. Title Page Abstract Introduction Conclusions References Tables Figures J I J I Back CloseFull Screen / Esc
Print Version Interactive Discussion
EGU
Chow, J. C., Watson, J. G., Lu, Z., et al.: Descriptive analysis of PM2.5 and PM10 at region-ally representative locations during SJVAQS/AUSPEX, Atmos. Environ., 30(12), 2079–2112, 1996.
Chow, J. C., Watson, J. G., Crow, D., et al.: Comparison of IMPROVE and NIOSH Carbon Measurements, Aerosol Sci. Technol., 34, 23–34, 2001.
5
Chow, J. C., Engelbrecht, J. P., Watson, J. G., et al.: Designing monitoring networks to repre-sent outdoor human exposure, Chemosphere, 49(9), 961–978, 2002.
Chow, J. C., Watson, J. G., Kuhns, H. D., et al.: Source profiles for industrial, mobile, and area sources in the Big Bend Regional Aerosol Visibility and Observational (BRAVO) Study, Chemosphere, 54(2), 185–208, 2003.
10
Chow, J. C., Watson, J. G., Chen, L. W., et al.: Equivalence of elemental carbon by ther-mal/optical reflectance and transmittance with different temperature protocols, Environ. Sci. Technol., 38(16), 4414–4422, 2004.
Cooke, W. F., Liousse, C., Cachier, H., et al.: Construction of a 1◦× 1◦ fossil fuel data set for carbonaceous aerosol and implementation and radiative impact in the ECHAM4 model, J.
15
Geophys. Res., 104, 22 137–22 162, 1999.
Dan, M., Zhuang, G. S., Lia, X. X., et al.: The characteristics of carbonaceous species and their sources in PM2.5in Beijing, Atmos. Environ., 38, 3443–3452, 2004.
Duan, F. K., Liu, X. D., Yu, T., et al.: Identification and estimate of biomass burning contribution to the urban aerosol organic carbon concentrations in Beijing, Atmos. Environ., 38, 1275–
20
1282, 2004.
Fung, K. K., Chow, J. C., and Watson, J. G.: Evaluation of OC/EC speciation by thermal man-ganese dioxide oxidation and the IMPROVE method, J. Air Waste Manage. Assoc., 52 (11), 1333–1341, 2002.
Gao, Y., Arimoto, R., Duce, R. A., et al.: Temporal and spatial distributions of dust and its
25
deposition to the China Sea, Tellus, Ser. B, 49, 172–189, 1997.
Gray, H. A., Cass, G. R., Huntzicker, J. J., et al.: Characteristics of atmospheric organic and elemental carbon particle concentrations in Los Angeles, Environ. Sci. Technol., 20 (6), 580– 589, 1986.
Hansen, A. D. A., Bodhaine, B. A., Dutton, E. G., et al.: Aerosol black carbon measurements
30
at the south pole: initial results, 1986–1987, Geophys. Res. Lett., 15, 1193–1196, 1988. He, K. B., Yang, F. M., Ma, Y. L., et al.: The characteristics of PM2.5 in Beijing, China, Atmos.
ACPD
5, 3561–3593, 2005 Characterization and source apportionment of Xi’an OC and EC J. J. Cao et al. Title Page Abstract Introduction Conclusions References Tables Figures J I J I Back CloseFull Screen / Esc
Print Version Interactive Discussion
EGU
Hies, T., Treffeisen, R., Sebald, L., et al.: Spectral analysis of air pollutants, Part 1: elemental carbon time series, Atmos. Environ., 34, 3495–3502, 2000.
Holler, R., Tohnoa, S., Kasaharaa, M., et al.: Long-term characterization of carbonaceous aerosol in Uji, Japan, Atmos. Environ., 36, 1267–1275, 2002.
IPCC, Intergovernmental Panel on Climate Change, 2001: Climate Change 2001: The
Scien-5
tific Basis, 5. Aerosols, their Direct and Indirect Effects, edited by: Houghton, J. T., Ding, Y., Griggs, D. J., Noguer, M., van der Linden, P. J., and Xiaosu, D., Cambridge University Press, London, 289–348, 2001.
Jacobson, M. Z.: Control of fossil-fuel particulate black carbon and organic matter, possibly the most effective method of slowing global warming, J. Geophys. Res., 107(D19), 4410,
10
doi:10.1029/2001JD001376, 2002.
Kim, E., Hopke, P. K., and Edgerton, E. S.: Source identification of Atlanta aerosol by positive matrix factorization, J. Air & Waste Manage. Assoc., 53, 731–739, 2003a.
Kim, E., Hopke, P. K., and Edgerton, E. S.: Improving source identification of Atlanta aerosol using temperature resolved carbon fractions in positive matrix factorization, Atmos. Environ.,
15
37, 5009–5021, 2003b.
Kim, E. and Hopke, P. K.: Improving source identification of fine particles in a rural northeastern U.S. area utilizing temperature-resolved carbon fractions, J. Geophys. Res., 109, D09204, doi:10.1029/2003JD004199, 2004.
Lee, H. S. and Kang, B. W.: Chemical characteristics of principal PM2.5species in Chongju,
20
South Korea, Atmos. Environ., 35, 739–746, 2001.
Li, Y.: Characterization and source apportionment of atmospheric organic and elemental car-bon in Xi’an, China, Master thesis of Institute of Earth Environment, (in Chinese), 2004. Lin, J. J. and Tai, H. S.: Concentrations and distributions of carbonaceous species in ambient
particles in Kaohsiung City, Taiwan, Atmos. Environ., 35, 2627–2636, 2001.
25
Menon, S., Hansen, J., Nazarenko, L., et al.: Climate effects of black carbon aerosols in China and India, Science, 297, 2250–2253, 2002.
Ohta, S., Hori, M., Yamagata, S., and Murao, N.: Chemical characterization of atmospheric fine particles in Sapporo with determination of water content, Atmos. Environ., 32(6), 1021–1025, 1998.
30
Pandis, S. N.: Secondary organic aerosol: precursors, composition, chemical mechanisms, and environmental conditions. Secondary Organic Aerosols Research Strategy to Appor-tion Biogenic/Anthropogenic Sources: An Outcome of the First Secondary Organic Aerosols
ACPD
5, 3561–3593, 2005 Characterization and source apportionment of Xi’an OC and EC J. J. Cao et al. Title Page Abstract Introduction Conclusions References Tables Figures J I J I Back CloseFull Screen / Esc
Print Version Interactive Discussion
EGU
Workshop, February 4–5, 2002, Desert Research Institute, Reno, Nevada, Fort Lewis Col-lege, Durango, CO, 2002.
Schmid, H., Laskus, L., Abraham, H. J., et al.: Results of the “carbon conference” international aerosol carbon round robin test stage I, Atmos. Environ., 35, 2111–2121, 2001.
Streets, D. G., Gupta, S., Waldho, S. T., et al.: Black carbon emissions in China, Atmos.
Envi-5
ron., 35, 4281–4296, 2001.
Thurston, G. D. and Spengler, J. D.: A quantitative assessment of source contributions to inhalable particulate matter of pollution in metropolitan Boston, Atmos. Environ., 19, 9–25, 1985.
Turpin, B. J. and Huntzicker, J. J.: Secondary formation of organic aerosol in the Los
Ange-10
les Basin: a descriptive analysis of organic and elemental carbon concentrations, Atmos. Environ., 25A, 207–215, 1991.
Turpin, B. J. and Lim, H. J.: Species contributions to PM2.5mass concentrations: revisting com-mon assumptions for estimating organic mass, Aerosol Sci. Technol., 35, 602–610, 2001. Watson, J. G., Chow, J. C., and Houck, J. E.: PM2.5chemical source profiles for vehicle exhaust,
15
vegetative burning, geological material, and coal burning in Northwestern Colorado during 1995, Chemosphere, 43, 1141–1151, 2001.
Watson, J. G., Chow, J. C., Lowenthal, D. H., et al.: Differences in the carbon composition of source profiles for diesel- and gasoline-powered vehicles, Atmos. Environ., 28, 2493–2505, 1994.
20
Wei, F., Teng, E., Wu, G., et al.: Ambient concentrations and elemental compositions of PM10 and PM2.5in four Chinese cities, Environ. Sci. Technol., 33, 4188–4193, 1999.
Yang, F., He, K., Ye, B., et al.: One-year record of organic and elemental carbon in fine particles in downtown Beijing and Shanghai, Atmos. Chem. Phys. Discuss., 5, 217–241, 2005,
SRef-ID: 1680-7375/acpd/2005-5-217.
25
Ye, B. M., Jia, X. L., Yang, H. Z., et al.: Concentration and chemical composition of PM2.5 in Shanghai for a 1-year period, Atmos. Environ., 37, 499–510, 2003.
Zhang, X. Y., Cao, J. J., Li, L. M., et al.: Characterization of Atmospheric Aerosol over XiAn in the South Margin of the Loess Plateau, China, Atmos. Environ., 36, 4189–4199, 2002. Zhang, X. Y., Cao, J. J., Su, G. L., et al.: Particulate Pollution Control in Xi’an, in: United Nations
30
Development Program & China International Center of Economic and Technology Exchange, Urban Air Pollution Control in China, China Science & Technology Press, (In Chinese), 222– 293, 2001.
ACPD
5, 3561–3593, 2005 Characterization and source apportionment of Xi’an OC and EC J. J. Cao et al. Title Page Abstract Introduction Conclusions References Tables Figures J I J I Back CloseFull Screen / Esc
Print Version Interactive Discussion
EGU
Zhang, X. Y., Arimoto, R., An, Z. S., et al.: Atmospheric trace elements over source regions for Chinese dust: Concentrations, sources and atmospheric deposition on the loess plateau, Atmos. Environ., 27(13), 2051–2067, 1993.
Zhuang, G. S., Zhen, Y., Duce, R. A., and Brown, P. R.: Link between iron and sulphur cycles suggested by detection of Fe (II) in remote marine aerosols, Nature, 355, 537–539, 1992.
ACPD
5, 3561–3593, 2005 Characterization and source apportionment of Xi’an OC and EC J. J. Cao et al. Title Page Abstract Introduction Conclusions References Tables Figures J I J I Back CloseFull Screen / Esc
Print Version Interactive Discussion
EGU
Table 1. Average of the concentrations of OC and EC during September 2003 to February
2004 at Xi’an, China.
Season Month Sample numbers OCa EC OC/EC
PM2.5 PM10 PM2.5 PM10 PM2.5 PM10 PM2.5 PM10 September 18 6 24.9±10.3b 29.6±11.2 8.3±4.5 11.0±6.4 3.3 3.0 Fall October 31 11 39.4±19.4 50.7±30.6 13.1±7.5 17.2±12.2 3.4 3.3 Average 49 17 34.1±18.0 43.2±27.1 11.3±6.9 15.0±10.7 3.3 3.2 November 27 8 52.4±27.1 67.5±25.7 12.1±5.1 19.8±8.2 4.3 3.6 December 29 8 81.7±36.2 124.8±54.8 15.2±4.6 28.9±8.9 5.3 4.3 Winter January 31 11 63.9±36.0 80.3±42.4 10.1±5.8 16.1±8.8 6.4 5.1 February 29 9 48.6±21.7 98.7±87.6 12.0±4.4 26.8±18.2 4.1 3.5 Average 116 36 61.9±33.2 93.0±58.4 12.3±5.3 22.7±12.3 5.1 4.2
ACPD
5, 3561–3593, 2005 Characterization and source apportionment of Xi’an OC and EC J. J. Cao et al. Title Page Abstract Introduction Conclusions References Tables Figures J I J I Back CloseFull Screen / Esc
Print Version Interactive Discussion
EGU
Table 2. Distribution of PM2.5mass, OC, EC, total carbonaceous aerosol (TCA)a% and OC/EC ratios under precipitation and non precipitation days.
Type Sample numbers PM2.5mass (µg m −3
) OC(µg m−3) EC(µg m−3) TCA% OC/EC precipitation days
Fall 13 (27%b) 65.3c 16.2 4.3 50.0 4.0
(26.3–129.1)d (9.5–28.2) (1.7–9.0) (35.2–80.9) (3.1–6.2)
Winter 6 (5%) 128.4 34.7 8.6 50.6 4.0
(74.5–168.7) (19.0–49.6) (6.8–11.9) (38.1–57.7) (2.8–5.3) non precipitation days
Fall 36 (73%) 165.0 40.2 13.7 48.9 3.1
(51.2–327.6) (16.4–74.2) (3.3–27.6) (30.9–69.8) (2.2–4.9)
Winter 110 (95%) 250.0 63.3 12.5 45.7 5.1
(40.4–663.9) (9.9–189.6) (2.2–25.1) (23.7–72.9) (2.8–9.4)
ACPD
5, 3561–3593, 2005 Characterization and source apportionment of Xi’an OC and EC J. J. Cao et al. Title Page Abstract Introduction Conclusions References Tables Figures J I J I Back CloseFull Screen / Esc
Print Version Interactive Discussion
EGU
Table 3. Statistical summary of the percentage of OC, EC and TCA% in PM2.5and PM10.
Season Month TCA (%) OC (%) EC (%)
PM2.5 PM10 PM2.5/PM10 PM2.5 PM10 PM2.5/PM10 PM2.5 PM10 PM2.5/PM10 September 45.0±7.6a 26.4±1.5 83.0±6.4 23.5±4.3 13.6±1.0 84.9±5.8 7.3±1.6 4.7±0.8 74.8±13.4 Fall October 51.0±10.7 38.8±8.8 79.4±6.2 26.6±5.5 20.4±4.8 80.2±6.1 8.4±2.7 6.3±1.6 75.0±10.1 Average 48.8±10.1 34.5±9.3 80.7±6.3 25.5±5.3 18.0±5.1 81.8±6.3 8.0±2.4 5.7±1.6 75.0±11.0 November 44.8±7.4 35.7±4.6 69.8±11.8 24.3±3.9 18.9±2.5 71.8±12.2 5.9±1.7 5.4±0.9 58.7±12.0 December 50.3±5.5 42.4±7.7 65.9±13.3 27.9±2.8 23.0±4.5 67.6±14.0 5.6±1.5 5.6±1.3 55.2±10.6 Winter January 44.0±8.1 37.0±11.7 75.0±9.1 24.9±4.6 20.6±7.1 77.0±9.6 4.0±1.1 4.1±0.8 61.4±7.3 February 44.8±7.5 32.4±7.4 72.2±11.9 24.2±4.4 17.2±4.3 74.0±13.1 6.1±1.4 4.9±0.8 63.2±9.4 Average 45.9±7.5 37.0±8.9 71.0±11.5 25.4±4.2 20.0±5.3 72.8±12.1 5.4±1.6 5.0±1.1 59.6±9.8
ACPD
5, 3561–3593, 2005 Characterization and source apportionment of Xi’an OC and EC J. J. Cao et al. Title Page Abstract Introduction Conclusions References Tables Figures J I J I Back CloseFull Screen / Esc
Print Version Interactive Discussion
EGU
Table 4. Comparison of PM2.5OC, EC at Xi’an with other Asian cities.
City Period TC OC EC OC/EC Measurement method Reference
(µg m−3)
Xi’an Fall, 2003 45.4 34.1±18.0 11.3±6.9 3.3 IMPROVE-TOR This study
Winter, 2003 74.2 61.9±33.2 12.3±5.3 5.1 IMPROVE-TOR This study
Beijing1 Fall, 1999 39.0 28.8 10.2 2.8 IMPROVE-TOR He et al. (2001)
Winter, 1999 42.6 31.5 11.1 2.8 IMPROVE-TOR
Beijing2 2002.12 51.9 36.7±19.4 15.2±11.1 3.5 Elemental analyzer Dan et al. (2004) Beijing3 1997.11–1998.10 41.54 No data Elemental analyzer Duan et al. (2003)
Shanghai5 Fall, 1999 23.2 16.3 6.9 2.4 IMPROVE-TOR Ye et al. (2003)
Winter, 1999 25.1 17.0 8.1 2.1 IMPROVE-TOR
Hong Kong 2002.1–2 14.4 9.6±4.5 4.7±2.9 2.3 IMPROVE-TOR Cao et al. (2003)
Guangzhou 2002.1–2 31.0 22.6±18.0 8.3±5.6 2.7 IMPROVE-TOR Cao et al. (2003)
Shenzhen 2002.1-2 19.2 13.2±4.1 6.1±1.8 2.2 IMPROVE-TOR Cao et al. (2003)
Zhuhai 2002.1–2 17.3 12.2±4.4 5.0±1.6 2.4 IMPROVE-TOR Cao et al. (2003)
Kaohsiung 1998.11–1999.4 14.5 10.4 4.0 2.6 Elemental analyzer Lin and Tai (2001)
Chongju, Korea Fall, 1995 12.4 6.0 6.4 0.9 IMPROVE-TOR Lee and Kang (2001)
Winter, 1995 9.3 5.0 4.3 1.2 IMPROVE-TOR
Sapporo, Japan 1992.9–10 9.1 4.1 5.0 0.8 Elemental analyzer Ohta et al. (1998)
1992.1–2 9.0 3.9 5.1 0.8 Elemental analyzer
Uji, Japan 1998.9–10 6.4 1.8 4.6 0.4 R&P 5400 Holler et al. (2002)
1998.11–12 10.2 2.5 7.7 0.3 R&P 5400
Note: 1 Chegongzhuang site; 2 average of 3 sites: Beijing Normal University, Capital Steel Plant, Yihai Garden;
ACPD
5, 3561–3593, 2005 Characterization and source apportionment of Xi’an OC and EC J. J. Cao et al. Title Page Abstract Introduction Conclusions References Tables Figures J I J I Back CloseFull Screen / Esc
Print Version Interactive Discussion
EGU
Table 5. PCA results of fall Samples.
PC1 PC2 PC3 OC1 0.32 0.12 0.91 OC2 0.96 0.16 0.17 OC3 0.89 0.11 0.38 OC4 0.95 0.19 0.19 OP 0.88 0.25 0.13 EC1 0.88 0.21 0.39 EC2 0.62 0.65 −0.28 EC3 0.12 0.94 0.23 Variance 68% 14% 10% Eigenvalue 5.60 1.10 0.80
Gasoline Diesel Biomass
ACPD
5, 3561–3593, 2005 Characterization and source apportionment of Xi’an OC and EC J. J. Cao et al. Title Page Abstract Introduction Conclusions References Tables Figures J I J I Back CloseFull Screen / Esc
Print Version Interactive Discussion
EGU
Table 6. PCA results of winter samples.
PC1 PC2 PC3 OC1 0.09 0.98 0.06 OC2 0.97 0.03 0.05 OC3 0.87 0.44 0.07 OC4 0.96 0.05 −0.01 OP 0.60 0.67 0.24 EC1 0.73 0.50 0.17 EC2 −0.05 0.12 0.90 EC3 0.17 0.06 0.88 Variance 55% 21% 13% Eigenvalue 4.40 1.60 1.10
Coal combustion Biomass burning Diesel exhaust
ACPD
5, 3561–3593, 2005 Characterization and source apportionment of Xi’an OC and EC J. J. Cao et al. Title Page Abstract Introduction Conclusions References Tables Figures J I J I Back CloseFull Screen / Esc
Print Version Interactive Discussion EGU N China 20N 30N 40N
80E 100E 120E
0 1000 km Xi’an N Sampling site Downtown Highway Railway Xi’an 0 5Km Beijing Shanghai Guangzhou Hong Kong Figure 1
Fig. 1. Location of the sampling site at Xi’an, China.
ACPD
5, 3561–3593, 2005 Characterization and source apportionment of Xi’an OC and EC J. J. Cao et al. Title Page Abstract Introduction Conclusions References Tables Figures J I J I Back CloseFull Screen / Esc
Print Version Interactive Discussion EGU 0 300 600 0 100 200 0 20 40 0 2 4 6 8 10 30 60 OC EC Mass OC/EC TCA% Sampling Date (% ) OC ( µ g m -3) Ma ss ( µ g m -3) EC ( µ g m -3)
September October November December January February
13/09/0301/10/03 01/11/03 01/12/03 01/01/04 01/02/04 29/02/04
Figure 2
Fig. 2. Time series of PM2.5Mass, organic carbon (OC), elemental carbon (EC), TCA%, and OC/EC ratios at Xi’an from 13 September 2003 to 29 February 2004 (TCA is total carbonaceous aerosol, sum of organic matter (1.6×OC, Turpin and Lim, 2001) and EC).
ACPD
5, 3561–3593, 2005 Characterization and source apportionment of Xi’an OC and EC J. J. Cao et al. Title Page Abstract Introduction Conclusions References Tables Figures J I J I Back CloseFull Screen / Esc
Print Version Interactive Discussion EGU 0 10 20 30 40 50 200 100 0 200 100 0 EC (µg m-3) OC ( µ g m -3) PM2.5 PM10 Fall: OC=2.46EC+6.22 (R2=0.90, n=49) Winter:OC=5.12EC-1.18 (R2=0.66, n=116) Winter:OC=3.83EC+4.92 (R2=0.66, n=38) Fall: OC=2.46EC+6.15 (R2=0.95, n=17) OC:EC=2:1 line OC:EC=2:1 line
Figure 3
Fig. 3. Relationship between OC and EC concentrations in PM2.5and PM10.
ACPD
5, 3561–3593, 2005 Characterization and source apportionment of Xi’an OC and EC J. J. Cao et al. Title Page Abstract Introduction Conclusions References Tables Figures J I J I Back CloseFull Screen / Esc
Print Version Interactive Discussion EGU
PM
2.5PM
10PM
2.5PM
10800
600
400
200
0
800
600
400
200
0
Mas
s(
µ
g m
-3)
Mas
s(
µ
g m
-3)
Fall
Winter
Figure 4
Fig. 4. Distribution of PM2.5 and PM10 mass concentrations during fall and winter (The valid paired samples were 17 in fall and 36 in winter. The points in the figure were measured data and the curves were the normal fitting curve of these data.)
ACPD
5, 3561–3593, 2005 Characterization and source apportionment of Xi’an OC and EC J. J. Cao et al. Title Page Abstract Introduction Conclusions References Tables Figures J I J I Back CloseFull Screen / Esc
Print Version Interactive Discussion EGU Per ce ntage ( % )
OC1 OC2 OC3 OC4 OP EC1 EC2 EC3 30 20 10 0 40 20 0 September October November December January February Coal-combustion Biomass Burning Motor Vehicle Exhaust
OC EC
Figure 5
Fig. 5. Percentage of total carbon contributed by eight carbon fractions in ambient air and three
major source samples.
ACPD
5, 3561–3593, 2005 Characterization and source apportionment of Xi’an OC and EC J. J. Cao et al. Title Page Abstract Introduction Conclusions References Tables Figures J I J I Back CloseFull Screen / Esc
Print Version Interactive Discussion EGU 0 0.1 0.2 0.3 0.4 0 1.5e+05 3e+05 0 1.5e+05 3e+05 PM2.5Mass 0 0.1 0.2 0.3 0.4 0 7500 15000 0 7500 15000 0 0.1 0.2 0.3 0.4 0 2 4 0 2 4 0 0.1 0.2 0.3 0.4 0 300 600 0 300 600 PS D T ISA PS D T IS A Frequency(day-1) Frequency(day-1) OC EC
Daily average wind speed 24 10 7 5 60 7 40 7 24 13 10 5 24 10 7 5 13 6 4 3 3 Figure 6
Fig. 6. Periodicity of PM2.5OC, EC, mass, and daily average wind speed. (PSD TISA refers to Power as Time-Integral Squared Amplitude.)
ACPD
5, 3561–3593, 2005 Characterization and source apportionment of Xi’an OC and EC J. J. Cao et al. Title Page Abstract Introduction Conclusions References Tables Figures J I J I Back CloseFull Screen / Esc
Print Version Interactive Discussion EGU
Fall: TC=45.1
µ
g m
-3Winter: TC=74.2
µ
g m
-3 Gasoline Vehicle Exhaust Diesel Vehicle Exhaust Biomass Burning Coal-combustion73%
23%
4%
44%
44%
9%
3%
Figure 7Fig. 7. Relative contributions of major sources to PM2.5TC during fall and winter, 2003.