HAL Id: hal-00298833
https://hal.archives-ouvertes.fr/hal-00298833
Submitted on 23 May 2007HAL is a multi-disciplinary open access
archive for the deposit and dissemination of sci-entific research documents, whether they are pub-lished or not. The documents may come from teaching and research institutions in France or abroad, or from public or private research centers.
L’archive ouverte pluridisciplinaire HAL, est destinée au dépôt et à la diffusion de documents scientifiques de niveau recherche, publiés ou non, émanant des établissements d’enseignement et de recherche français ou étrangers, des laboratoires publics ou privés.
Riverine transport of biogenic elements to the Baltic
Sea ? past and possible future perspectives
C. Humborg, C.-M. Mörth, M. Sundbom, F. Wulff
To cite this version:
C. Humborg, C.-M. Mörth, M. Sundbom, F. Wulff. Riverine transport of biogenic elements to the Baltic Sea ? past and possible future perspectives. Hydrology and Earth System Sciences Discussions, European Geosciences Union, 2007, 4 (3), pp.1095-1131. �hal-00298833�
HESSD
4, 1095–1131, 2007
Scenarios on riverine tranport to the Baltic
C. Humborg et al. Title Page Abstract Introduction Conclusions References Tables Figures ◭ ◮ ◭ ◮ Back Close Full Screen / Esc
Printer-friendly Version Interactive Discussion
EGU
Hydrol. Earth Syst. Sci. Discuss., 4, 1095–1131, 2007 www.hydrol-earth-syst-sci-discuss.net/4/1095/2007/ © Author(s) 2007. This work is licensed
under a Creative Commons License.
Hydrology and Earth System Sciences Discussions
Papers published in Hydrology and Earth System Sciences Discussions are under open-access review for the journal Hydrology and Earth System Sciences
Riverine transport of biogenic elements
to the Baltic Sea – past and possible
future perspectives
C. Humborg1, C.-M. M ¨orth2, M. Sundbom1, and F. Wulff3
1
Dept. of Applied Environmental Science, Stockholm University, 10691 Stockholm, Sweden
2
Dept. of Geology & Geochemistry, Stockholm University, 10691 Stockholm, Sweden
3
Dept. of Systems Ecology, Stockholm University, 10691 Stockholm, Sweden Received: 24 April 2007 – Accepted: 24 April 2007 – Published: 23 May 2007 Correspondence to: C. Humborg ([email protected])
HESSD
4, 1095–1131, 2007
Scenarios on riverine tranport to the Baltic
C. Humborg et al. Title Page Abstract Introduction Conclusions References Tables Figures ◭ ◮ ◭ ◮ Back Close Full Screen / Esc
Printer-friendly Version Interactive Discussion
EGU
Abstract
The paper reviews critical processes for the land-sea fluxes of biogenic elements (C, N, P, Si) in the Baltic Sea catchment and discusses possible future scenarios as a con-sequence of improved sewage treatment, agricultural practices, increased hydropower demand and global warming, i.e., changes in hydrological patterns. These most
sig-5
nificant drivers will not only change the total amount of nutrient inputs and fluxes of organic and inorganic forms of carbon to the Baltic Sea, their ratio (C:N:P:Si) will alter as well with consequences for phytoplankton species composition in the Baltic Sea. In summary, we propose that N fluxes will increase due to higher live stock densities in those countries recently acceded to the EU, whereas P and Si fluxes will decrease due
10
to an increase in sewage treatment in these new EU member states and with further damming and still eutrophic states of many lakes in the entire Baltic Sea catchment. This might eventually decrease cyanobacteria blooms in the Baltic but increase the potential for other nuisance blooms. Dinoflagellates will be substituting diatoms that even today grow below their optimal growth conditions due to low Si concentrations in
15
some regions of the Baltic Sea. C fluxes will probably increase from the boreal part of the Baltic Sea catchment due to the expected higher temperatures and heavier rainfall. However, it is not clear whether both dissolved organic carbon and alkalinity, that have opposite feedbacks to global warming will increase in similar amounts, since the spring flow peak will be smoothed out in time due to higher temperatures that cause less snow
20
cover and deeper soil infiltration.
1 Introduction
The Baltic Sea is a semi enclosed basin with water residence time of some 30 years which makes this estuarine system highly susceptible to changes in riverine loads of biogenic elements (C, N, P, Si). Two major drivers, i.e., the changes in life style in the
25
HESSD
4, 1095–1131, 2007
Scenarios on riverine tranport to the Baltic
C. Humborg et al. Title Page Abstract Introduction Conclusions References Tables Figures ◭ ◮ ◭ ◮ Back Close Full Screen / Esc
Printer-friendly Version Interactive Discussion
EGU
and global warming, will significantly alter the transport of biogenic elements to the Baltic Sea in the near future. These changes can be expected to be much more severe compared to the variations in riverine fluxes observed over the last 35 years (HELCOM, 2004), since changes in life style translates directly into anthropogenic nutrient emis-sions and riverine fluxes (Nixon, 1995; Howarth et al., 1996; Boyer et al., 2002) and the
5
foreseen changes in temperatures and rainfall will alter the hydrological patterns in the catchment fundamentally (Graham, 2004). The aim of this paper is first to summarize the current knowledge on riverine nutrient and carbon fluxes in the Baltic Sea catch-ment, i.e., to describe leading environmental variables that drive these fluxes, and sec-ondly to give future projections on possible changes in nutrient land-sea fluxes as result
10
of the adoption of EU life styles and climate change. In contrast to regional assess-ments using national data sets with varying quality and evaluation tools summarized by the HELCOM pollution load compilations (HELCOM, 2004)we will use a more con-sistent data set and modelling tools compiled by the MARE project. This will facilitate a comparison of riverine nutrient transports between Baltic Sea sub-catchments that
dif-15
fer substantially both in terms of climate, hydrology and human impacts. We will briefly summarize these tools, however, for detailed information on data used and the mod-elling approach the reader is referred to the MARE website (http://www.mare.su.se) and recent publications by (M ¨orth et al., 2007) and (Wulff et al., 2007).
The drainage basin of the Baltic Sea can be divided into a northern boreal part
20
that drains into the Gulf of Bothnia (Bothnian Bay=BB and Bothnian Sea=BS) and a south eastern part that drains into the rest of the Baltic Sea (Baltic proper=BP, Gulf of Finland =GF, Gulf of Riga=GR, Danish Sounds=D, Kattegat=KT; Figs. 1 and 2). The northern watersheds are generally densely populated and less eutrophic compared with the cultivated and eutrophic watersheds of the southeast. The dominating land
25
cover in the north is boreal forest and wetlands. The watersheds of the southeast are dominated by agriculture (Table 1; Fig. 2). River nutrient loads, especially from the Oder, Vistula, Daugava and Nemunas Rivers, contribute most to riverine eutrophication of the central and southern basins of the Baltic Sea (St ˚alnacke et al., 1999b). Coastal
HESSD
4, 1095–1131, 2007
Scenarios on riverine tranport to the Baltic
C. Humborg et al. Title Page Abstract Introduction Conclusions References Tables Figures ◭ ◮ ◭ ◮ Back Close Full Screen / Esc
Printer-friendly Version Interactive Discussion
EGU
point sources are more significant for coastal eutrophication of the northern basins and the northeastern Gulf of Finland. The most significant coastal point sources are major cities such as St. Petersburg, Helsinki and Stockholm (HELCOM, 2004). The largest mass fluxes of nutrients come from the rivers Oder and Vistula, draining Poland and its 38 million inhabitants, about half of the population of the entire Baltic Sea catchment
5
(Hannerz et al., 2006).
In contrast to the north-south division of the watersheds, based on natural settings and landscape variables, an east-west distinction can be made for the socio-political characteristics of the watersheds. Most riparian countries are now members of the Eu-ropean Union, although the entry of Poland, Lithuania, Latvia and Estonia is relatively
10
recent and their economies can be described as transitional. Russia has also shifted from a centralised economy. These socio-political changes are likely to have an impact on nutrient land-sea fluxes, primarily through effects on agriculture, since the demand of animal protein will probably increase with economical growth that is indicated by relationship between animal protein consumption and the gross national productivity
15
(Fig. 3).
2 Results and discussion
2.1 Past and possible future changes in N and P fluxes
The overall nutrient load to the Baltic Sea has increased by a factor 2.4 and 3.1 for total nitrogen (TN) and total phosphorus (TP), respectively, over the last 100 years
20
(Schernewski et al., 2005). Significant changes in nutrient loads could be expected especially from transitional countries (Poland and the Baltic States, Czech Republic, Belarus and Russia) due to dramatic socio-economical changes. The use of fertilizer and livestock densities decreased dramatically following the economic breakdown in 1990 (Fig. 4a and b; L ¨ofgren et al., 1999; St ˚alnacke et al., 2003; Vagstad et al., 2004).
25
dur-HESSD
4, 1095–1131, 2007
Scenarios on riverine tranport to the Baltic
C. Humborg et al. Title Page Abstract Introduction Conclusions References Tables Figures ◭ ◮ ◭ ◮ Back Close Full Screen / Esc
Printer-friendly Version Interactive Discussion
EGU
ing the last 30 years (Fig. 5; HELCOM, 2004, and references therein; St ˚alnacke et al., 1999a) although recently decreasing trends in N and P concentrations of several minor rivers have been reported (Iital et al., 2005; Kronvang et al., 2005). Interestingly, rivers draining countries with a large N-surplus – that is all N added to a hectare sown area such as fertilizer and manure, atmospheric deposition and agricultural imports as
5
feed minus all outputs such as agricultural export and human consumption (L ¨ofgren et al., 1999; Campling et al., 2005) –, showed indeed decreasing TN and TP river concentrations after the collapse of the agricultural sector. Iital et al. (2005) reported decreasing trends in N concentrations of 20 Estonian rivers immediately after the drop in inorganic and organic fertilizer use from about 200 kg ha yr−1 to <50 kg ha yr−1. In
10
these parts of the Baltic Sates agricultural production was intense due to meat pro-duction that was exported to the former Soviet Union (L ¨ofgren et al., 1999). However, these rivers are not significant in terms of nutrient mass flux to the Baltic Sea, since all Estonian rivers draining into the Baltic Sea contribute with some 4% to the TN and TP load (Table 2). Similarly, reductions in N surplus of the Danish agriculture from
15
about 130 to 80 kg ha yr−1 and subsequent decrease in river nutrient concentrations (Kronvang et al., 2005) will not lead to a significant lower nutrient inputs into the Baltic Sea, since Danish rivers contribute only with 8% to the riverine TN fluxes and 5% to the riverine TP fluxes, respectively (Table 2). Larger rivers that are more significant for the nutrient land sea fluxes to the Baltic as for example the Odra and Vistula, drain
20
cultivated landscapes where often less N and P was used in agriculture. In Poland, that stands for about 30–40% of the riverine TN and TP fluxes, respectively (Table 2), most agricultural land belonged to private landowners and, livestock was more evenly dis-tributed over the country and inorganic fertilizer use was low during the last 50 years, i.e., between 30–80 kg N ha−1yr−1and 10–50 kg P ha−1yr−1 (Sapek, 1997), which was
25
about half the amount used in Denmark or Germany (FAO 2005). Note that in Fig. 4a total amounts of fertilizers (N, P, K and potash) is given as an overview over the general trend; N and P fertilizer were used much less in Poland, the Baltic States and Russia compared to Denmark, Germany, Sweden and Finland (L ¨ofgren et al., 1999). However,
HESSD
4, 1095–1131, 2007
Scenarios on riverine tranport to the Baltic
C. Humborg et al. Title Page Abstract Introduction Conclusions References Tables Figures ◭ ◮ ◭ ◮ Back Close Full Screen / Esc
Printer-friendly Version Interactive Discussion
EGU
for the Vistula River no decrease in river loads has been reported until 1998 (Witek et al., 2003), i.e., almost ten years after the drop in fertilizer use. This lack of a response pattern might be related to leakage thresholds (Oenema et al., 1998), i.e., that agri-cultural soils start to leak significant more amounts of nutrient when nutrient surpluses become higher than a certain amount agricultural soils can buffer due to storage and
5
denitrification. In addition, inertia of the watershed may be of relevance, since ground-water residence times may last some decades in the major ground-watersheds. However, as will be evaluated below in more detail, a decrease in N and P fertilizer use appears not very likely in those countries with transitional economies since a prospective growth in economy as indicated by the gross national product per capita is directly related to the
10
consumption of animal proteins (Fig. 3) and this translates directly to the application of nutrients in the agricultural sector (Nixon, 1995).
A much more promising strategy to reduce riverine nutrient loads from transitional countries might be to connect more people to MWWTPs (Municipal Waste Water Treat-ment Plants). MWWTPs with tertiary treatTreat-ment were built for example in the 1990ies
15
in Poland and the percentage of the population connected to urban MWWTP increase gradually from 4% in 1995 to 34% in 2004 (Table 3). However, as indicated in Table 3 there is still an enormous potential to connect people to modern sewage cleaning in the transitional countries. Although the emissions from animals that contribute significantly to the diffusive sources are several fold higher than human emissions (Table 4),
im-20
proved cleaning of these point sources is still a huge potential for the reduction in river loads, since point sources are emitted directly into stream waters whereas emissions from manure are significantly retained in the soils (>80%) before entering the aquatic conduit (Johnes et al., 1996).
To summarize the current situation on riverine TN and TP fluxes to the Baltic Sea,
25
there are hot spots of diffuse sources as for example the Estonian or Danish agriculture where indeed reductions in nutrient loads have been observed as a result of a reduction in nutrient surpluses in agricultural areas. These hot spots are probably less significant for the nutrient mass fluxes to the Baltic Sea. A probably much larger part of the
agri-HESSD
4, 1095–1131, 2007
Scenarios on riverine tranport to the Baltic
C. Humborg et al. Title Page Abstract Introduction Conclusions References Tables Figures ◭ ◮ ◭ ◮ Back Close Full Screen / Esc
Printer-friendly Version Interactive Discussion
EGU
culture in transitional countries around the Baltic is more likely Polish agriculture, still with relatively low N and P use (Sapek, 1997) and consequently low nutrient leakage to the environment. In many transitional countries bordering the Baltic Sea there is a huge potential to reduce nutrient loads by connecting more people to MWWTPs with tertiary cleaning. However, this decrease in nutrient load might be compensated by a
5
change in life styles and application of more TN and TP in the agriculture. To estimate the potential effects of these drivers on riverine TN and TP fluxes to the Baltic Sea, we simulated the following three scenarios: i) better sewage treatment in transitional countries, ii) the application of P-free detergents in all Baltic Sea riparian countries and iii) a more intensive livestock in transitional countries caused by an increase in animal
10
protein consumption.
The decision support system NEST (Johansson et al., 2007) has been developed to analyse the effect of different management actions of the Baltic Sea. It consists of a marine biogeochemical model of the entire Baltic Sea linked to a drainage basin model, which handles the various nutrient emissions from land and describes the net
15
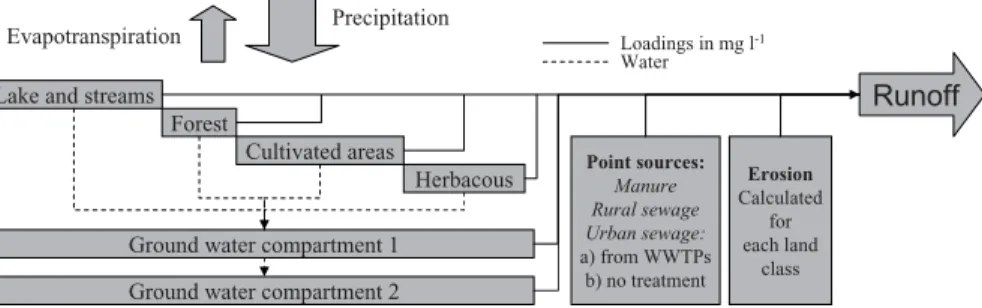
export to the sea. The latter model was linked to an emission database, which allows the formulation of alternative scenarios for remedial actions. To date, such a model has been lacking on the Baltic Sea scale and a detailed description of the model, which is called CSIM model, is given in M ¨orth et al. (2007). CSIM, is a lumped hydrologic model (Fig. 6) based on the generalized watershed loading function model (Haith et al., 1987)
20
originally developed to simulate streamflow, sediment, and nutrient fluxes from mixed-use watersheds in the United States. The model was applied to the entire Baltic Sea drainage basin divided into separate watersheds (Fig. 1). This division was necessary to handle this complex ecosystem, but it required a consistent handling of emission data from more than 100 watersheds draining into the Baltic Sea. TN and TP fluxes
25
were described by means of the water flows through various landscape types of a wa-tershed, including surface and ground water transports. In short, the model simulates the annual water balance for all 105 major Baltic watersheds as well as their nutrient loads from natural and anthropogenic sources. The effect of better cleaning of point
HESSD
4, 1095–1131, 2007
Scenarios on riverine tranport to the Baltic
C. Humborg et al. Title Page Abstract Introduction Conclusions References Tables Figures ◭ ◮ ◭ ◮ Back Close Full Screen / Esc
Printer-friendly Version Interactive Discussion
EGU
sources which were estimated in scenario i) were addressed using information on the proportion of the watershed population connected to sewage treatment and information on the degree of treatment, i.e. primary, secondary or tertiary treatment (Table 3). To simulate the effect of using P-free detergents (scenario ii) we used the information on the distribution of urban vs. rural population in a given watershed and applied a fixed
5
amount of emission reductions per capita. The effect of using P-free detergence by the urban population is generally higher, since soil retention of rural emissions (Johnes et al., 1996) was assumed higher than P retention in sewage treatment (see below). The effect of diffusive emissions influenced by man that were estimated in scenario iii) was parameterized as increased nutrient inputs from manure due to higher livestock
10
that enter the streamwater after significant soil retention (83% for TN and 97% for TP; (Johnes et al., 1996).
2.1.1 Scenario i
The first scenario runs on the effects of improved sewage treatment (Wulff et al., 2007) were based on averaged national data on people connected to sewage
sys-15
tems for the period 1996–2000 retrieved from official statistics from EUROSTAT (http:
//europa.eu.int/comm/eurostat/) except for Belarus and Russia where it was assumed that as low as 10% of the population had sewage treatment (M ¨orth et al., 2007). Ef-forts by the HELCOM member countries made it possible to update this information with more recent and accurate data. In the current analysis we have updated data on
20
levels of sewage treatments until 2004 (Table 3). Primary treatment was assumed to reduce the N and P loads by 19% and 15%, respectively, while secondary treatment reductions were assumed with 37.5% for N and 35% for P. Finally, tertiary treatment was assumed to remove 80% and 90% of N and P, respectively (values are taken from EUROSTAT). We have also through informal discussions with Russian and Belarusian
25
scientists updated these data, assuming that 50% of the populations in the Baltic Sea drainage basins of these countries are now connected to secondary sewage treatment. In our scenario calculations, we have assumed that no further improvement will occur in
HESSD
4, 1095–1131, 2007
Scenarios on riverine tranport to the Baltic
C. Humborg et al. Title Page Abstract Introduction Conclusions References Tables Figures ◭ ◮ ◭ ◮ Back Close Full Screen / Esc
Printer-friendly Version Interactive Discussion
EGU
the Nordic countries or Germany, compared to 2004. The other countries will have an improvement in sewage treatment, corresponding to the current situation in Sweden. The drainage basin model (M ¨orth et al., 2007) yields the following 5-year mean load reductions to the different basins from each country into the corresponding drainage basins. The overall TN load (Table 2) according this scenario will be reduced by 5%
5
(minus 34 000 tons yr−1; Table 5) and the TP loads by 35% (minus 12 000 tons yr−1; Table 5). The higher relative effect (%) of improved sewage treatment on TP fluxes compared to TN fluxes to the Baltic Sea can be explained by the dominance of diffu-sive sources for the TN fluxes that stand for roughly 60% of the total emissions (M ¨orth et al., 2007; HELCOM 2004) and a more drastic decrease in TP fluxes (minus 90%)
10
from point sources compared to TN fluxes (minus 80%) using tertiary cleaning. No reductions occur in the Bothnian Bay or Bothnian Sea, the Danish Sounds or Kattegat since direct loads to these basins originate only from the Nordic countries and Ger-many (Danish Sounds). The largest reduction of both TP and TN load with improved sewage treatment is from Poland (43%; 39%), followed by Russia (31%) and Belarus
15
(16%; 16%) (Table 5). 2.1.2 Scenario ii
P contributions from the use of phosphates in detergents are largely dependent on use patterns, marketing conditions and the adoption of specific conditions on the use of phosphates in detergents either through regulatory or voluntary agreements. It is
20
likely that these numbers will vary between countries. The annual contribution from detergents range from 0.13 to 0.22 kg per person (Zessner et al., 2005) and we have chosen to run the scenario where P emissions are reduced by 0.2 kg per person and year. The total P load reductions to the Baltic Sea amount to about 3200 tons P yr−1 and the highest effects will be achieved in Poland (minus 1300 tons P yr−1; Table 5) that
25
HESSD
4, 1095–1131, 2007
Scenarios on riverine tranport to the Baltic
C. Humborg et al. Title Page Abstract Introduction Conclusions References Tables Figures ◭ ◮ ◭ ◮ Back Close Full Screen / Esc
Printer-friendly Version Interactive Discussion
EGU
2.1.3 Scenario iii
In the last scenario we estimated the effects of a denser livestock in those counties re-cently assessed to the EU. During the last century, agricultural practices have changed dramatically. New technologies, crops, animal breeding and, particularly, the introduc-tion of artificial fertilizers, have increased productivity enormously. At the same time,
5
consumer preferences have changed dramatically towards a large proportion of meat in human consumption. These changes have been most pronounced in the western countries (Fig. 3) but similar changes are now occurring in the new EU member states, as well as in Russia and Belarus. Higher living standards and EU agricultural subsi-dies are driving this development. In this scenario we have assumed that all countries
10
around the Baltic Sea will develop their agriculture to the same state as in Denmark, the country that is leading in terms of agricultural development. More specifically, we assume that each country will have the same number of milk cow and other cattle, sows and slaughter pigs per agricultural areas as in Denmark (Table 6). This would imply a massive increase in livestock densities in the transitional countries as expressed in
15
animals per hectare, i.e., for pigs and increase between a factor of 4–30 and for cattle between a factor of 1.6–5 (Table 6). Moreover, the productivity, in term of meat and milk per animal will increase to Danish levels, which also means that nutrient excretion per unit animal will increase (Table 4). In this ‘pessimistic’ scenario we also assumed that sewage treatment will remain at the 2004 levels and no further restriction in the use
20
of P in detergents will be implemented. The effect of this massive life stock increase could result in an increase of the order of 16 000 tons TP and 340 000 tons TN (Table 5) which corresponds to roughly a 50% increase in total river loads (Table 2).
2.2 Past and possible future changes in Si fluxes
From several studies in boreal and sub arctic Swedish watersheds we hypothesized
25
that perturbed surface water-groundwater interactions as a consequence of the hydro-logical alterations in the rivers of the northern watershed of the Baltic lead to changes
HESSD
4, 1095–1131, 2007
Scenarios on riverine tranport to the Baltic
C. Humborg et al. Title Page Abstract Introduction Conclusions References Tables Figures ◭ ◮ ◭ ◮ Back Close Full Screen / Esc
Printer-friendly Version Interactive Discussion
EGU
in weathering conditions. Thus, less weathering may be the major reason for the re-duced DSi loads observed in these oligothrophic boreal rivers .(Humborg et al., 2000; Humborg et al., 2002; Humborg et al., 2006b). Particle trapping of biogenic silica (BSi) – that is mainly diatom shells – behind dams is the main reason for the reduced Si loads in the cultivated watersheds of the southern catchment of the Baltic (Humborg et
5
al., 2006b). Thus, the main processes behind the reduced DSi loads to the Baltic were described, but an overall estimate on the effects of both processes for the reduction of the overall Si load to the Baltic Sea is still missing.
DSi yields of the major rivers were about double as high in the northern boreal and sub arctic part of the Baltic catchments compared to the agriculture dominated and
10
eutrophied southeastern catchments (Table 7). Expressed in concentrations the rivers of the BB, BS, GF, GR and BP showed median concentrations of 106, 100, 91, 70 and 79 µM (Fig. 7), all far below the world average DSi concentration of 156 µM (Treguer et al., 1995). In fact, they show the opposite patterns to what is expected, since it is well known that chemical weathering rates of silicate minerals is related to
tempera-15
ture (Meybeck, 1979; Berner et al., 1995). Many watersheds of the northern part are affected mainly by damming and the area weighted sub catchment yields are much less than observed in unperturbed rivers of the area. The extreme low DSi yield of the Gulf of Finland catchment is caused by the disproportional large River Neva draining the eutrophied Lake Ladoga (Rukhovets et al., 2003) that probably sequester DSi
effi-20
ciently. Lowest yields were also observed for those rivers of the eutrophied catchments of the Gulf of Riga and the Baltic proper that have high percentages in lake area and/or are dammed. The effects of BSi particle trapping occurring in the south-eastern rivers together with the massive hydrological alterations in the northern rivers have lead to a DSi load reduction by approximately one third from 1.2 million tons in the early 1900s
25
to about 0.8 million tons today (Table 7).
These estimates are based on monthly measurements (1980–2000) on DSi loads from 83 major rivers (Fig. 1) running into the Baltic Sea that have been used to calcu-late DSi yields (kg DSi km2yr−1) to the various Baltic Sea basins. To calculate
unper-HESSD
4, 1095–1131, 2007
Scenarios on riverine tranport to the Baltic
C. Humborg et al. Title Page Abstract Introduction Conclusions References Tables Figures ◭ ◮ ◭ ◮ Back Close Full Screen / Esc
Printer-friendly Version Interactive Discussion
EGU
turbed potential DSi yields for all these watersheds we assumed pristine yields for each geological sub region of the Baltic catchment: Both Sweden and Finland have acid vol-canic and plutonic acid rocks and we chose the Rivers Kalix ¨alven (1261 kg km2yr−1) for Swedish Rivers and Kiiminkijokki (1266 kg km2yr−1) for Finnish rivers as unperturbed backgrounds. Sedimentary rocks dominate the southern and eastern part of the Baltic
5
Sea catchment. We calculated a potential yield of 704 kg km2yr−1 for the southern part (non to semi consolidated sedimentary rocks) based on bimonthly observations (2003–2004) of DSi and biogenic silica (BSi). BSi is a substantial part of the total Si load (median of about 50 µM; Humborg et al., 2006) in the undammed Oder River and was included in the calculations of Si yields. For the eastern part (consolidated
sedi-10
mentary rocks), we chose the River Gauja and a potential yield of 668 kg km2yr−1was estimated based on actual DSi observations and assumed contribution of BSi as in the similar eutrophied River Oder. Thereafter, we normalised each watershed yield against the specific runoff and temperature differences to the pristine yield of the geologic area:
DSipot= DSinorm∗ runoffobs
runoffnorm
∗ 1.08(tobs−tnorm) (1)
15
where DSipot is the potential unperturbed DSi yield [kg km−2yr−1] of the watershed,
DSinormis the pristine yield of the geologic area, runoffobs, runoffpristand tobs, tnormare the specific runoff [l m−2yr−1] and average annual temperature [◦C] of the watershed and the pristine watershed, respectively. The temperature differences between the wa-tersheds were multiplied by a factor 1.08, taking into account an increase in weathering
20
of about 8% per degree Celsius for plagioclase (Lasaga, 1998), a representative sili-cate mineral for the entire area. The catchments with eutrophied large lakes namely the Rivers Neva, Motalastr ¨om and Norrstr ¨om we assumed a decrease in DSi loads by a factor 4 similar as has been observed in the Great Lakes (Schelske et al., 1983); a more conservative estimate than would have resulted from normalization. Finally, we
25
subtracted the observed DSi yield (Table 7) from the potential unperturbed DSi yield of all watersheds to calculate the missing DSi loads (Table 7) to the Baltic Sea that were
HESSD
4, 1095–1131, 2007
Scenarios on riverine tranport to the Baltic
C. Humborg et al. Title Page Abstract Introduction Conclusions References Tables Figures ◭ ◮ ◭ ◮ Back Close Full Screen / Esc
Printer-friendly Version Interactive Discussion
EGU
further aggregated to sub catchment scale.
Future perspectives on DSi fluxes are difficult to estimate in terms of quantitative estimates with the current information on future energy demands at hand, however, DSi loads to the Baltic Sea will probably continue to decrease, since many more dams might be erected due to an increasing demand of hydropower (Lehner et al., 2005).
5
Highest effects of hydropower can be foreseen in Sweden and Finland that constitute the major part of the boreal catchment of the Bothnian Bay and Bothnian Sea, since the specific discharge is much higher compared to the cultivated part of the Baltic Sea catchment (Table 7) and water discharge is expected to increase due to higher rainfall with global warming (Graham, 2004). The status of low DSi loads from the southern
10
part of the Baltic Sea might be conserved due to a similar eutrophication status of lakes and reservoirs, a further eutrophication as envisioned in the higher livestock scenario (see above) might however further decrease DSi loads to the Baltic Sea also from the cultivated watersheds. Thus, a further decrease in DSi river loads to the Baltic Sea may thrive the decreasing DSi concentrations in the Baltic Sea (Humborg et al., 2006a) to
15
concentrations where diatom growth becomes suboptimal (Egge et al., 1992). 2.3 Past and possible future changes in dissolved organic and inorganic C fluxes It is estimated that about 455 Pg C is stored in northern peatlands, corresponding to about 30% of all soil C on Earth or to about 70 years of global annual anthropogenic C emissions (Gorham, 1991). Temperature increases above the global average have
20
been predicted at high latitudes in the northern hemisphere and increases in temper-ature and water discharge have already been recorded in the largest Eurasian rivers (Peterson et al., 2002). Similar trends were also foreseen for the boreal and subarctic part of the Baltic Sea catchment (Graham, 2004) and the unperturbed boreal rivers of the Baltic region can be regarded as model systems for the large Siberian rivers since
25
biogeochemical characteristics of the watersheds are similar (Humborg et al., 2004; Smedberg et al., 2006). More recently, work has focused on the role of hydrological interactions with the C budget of entire landscapes. It has been argued (Freeman et
HESSD
4, 1095–1131, 2007
Scenarios on riverine tranport to the Baltic
C. Humborg et al. Title Page Abstract Introduction Conclusions References Tables Figures ◭ ◮ ◭ ◮ Back Close Full Screen / Esc
Printer-friendly Version Interactive Discussion
EGU
al., 2001; Evans et al., 2002; Tranvik et al., 2002) that a change in climate and hy-drology in high latitude regions could liberate large amounts of previously inactive C during a prolonging thawing period as total (TOC) or dissolved organic C (DOC), and new studies in Swedish lakes have shown that a great deal of this organic C is min-eralized as CO2(Sobek et al., 2005) or CH4 during its transport to the sea. Whereas
5
TOC export can be described as a function of water discharge, i.e., flushing of or-ganic rich top soils (podzols are dominating) during spring flood (Boyer et al., 1996; Smedberg et al., 2006), gaseous fluxes are also positive related to soil moisture and evapotranspiration (Walker et al., 1998) that will increase with global warming. How-ever, even during frozen periods, streamflow is dominated by “old” groundwater. This
10
water has percolated through the soils and is rich in dissolved solids and bicarbon-ate; that is derived from atmospheric C that has been “consumed” during chemical weathering, and is partly exported as bicarbonate to the sea, where this C is stored as CaCO3for geological time. These current patterns of TOC and alkalinity fluxes (mainly bicarbonate in Swedish and Finish rivers) are exemplified by the R ˚ane ¨alven (Fig. 8).
15
Note that weathering products alkalinity and DSi peak during winter when groundwater contribution to stream flow is maximum and TOC peaks during spring flow when top soils are flushed. The bicarbonate export of some wetland and coniferous forest water-sheds investigated in the Baltic Sea region was between 0.4 and 1.2 tons C km−2yr−1 corresponding to 15–73% of the TOC export (Smedberg et al., 2006). Moreover,
bi-20
carbonate export exceeds by far the CO2outgassing in Swedish sub arctic and boreal watersheds. We roughly calculated for Sweden that about 150 000 tons C are leav-ing the aquatic systems via outgassleav-ing (2.5 g m−2yr−1, (Algesten et al., 2004) from all Swedish lakes vs. 600 000 tons HCO3-C that are produced by weathering reactions between soil CO2from respiration and mainly Si containing minerals and that are
ex-25
ported by all Swedish rivers. In other words the aquatic conduit in Sweden is still a sink for atmospheric C, not a source.
Very likely, global warming will affect water flow through the soils in taiga and tun-dra ecosystems (Hinzman et al., 2005) and, thus, will have an effect on watershed C
HESSD
4, 1095–1131, 2007
Scenarios on riverine tranport to the Baltic
C. Humborg et al. Title Page Abstract Introduction Conclusions References Tables Figures ◭ ◮ ◭ ◮ Back Close Full Screen / Esc
Printer-friendly Version Interactive Discussion
EGU
budgets. An increasing trend in TOC fluxes is obvious from the monthly observations of TOC concentrations at the river mouth of major Swedish rivers for the period 1980– 2005 (Fig. 9). The positive trend is visible until about mid Sweden whereas the far northern watersheds do not show any change in TOC concentrations over the last 25 years. The regional patterns of this TOC increase fits with observation of an earlier
5
ice break up in Swedish lakes (Weyhenmeyer et al., 2004) that is also confined to the southern part of Sweden. This might indicate that global warming has reached until about 62 degrees North in Sweden with respect to observed changes in hydrological patterns and river biogeochemistry. However, this TOC trend might also be related to less atmospheric deposition of S and N forming strong acids in soils and the related
10
increase in soil pH that happened simultaneously. As Evans et al. (2006) reported, an increase in soil pH, as an effect of recovery from acidification, may lead to a stronger leakage of DOC from organic rich soils. However, bicarbonate export may compensate for significant amounts of the exported TOC (as DOC, CO2 or CH4), thereby reduc-ing the positive feedback to atmospheric CO2. Recent simulation studies showed that
15
the air temperatures might increase with some several◦ Celsius in the northern boreal catchment of the Baltic Sea, which comes along with an increase in precipitation espe-cially in the Swedish part of the watershed. This will alter the entire discharge patterns of these boreal and sub arctic watersheds with a significant higher runoff and a much prolonged spring flow starting much earlier in the season, but with a less pronounced
20
peak flow (Graham, 2004). Nowadays, roughly half of the runoff in boreal and sub arc-tic rivers is generated within a few weeks in May and June, flushing especially topsoils that are rich in organic matter. Weathering products such as dissolved solids and alka-linity are associated mainly with groundwater (Fig. 8) and highest concentrations are measured during winter (base flow). Thus, the flow paths and transit times of waters
25
through various landscapes and associated soil types determine the water chemistry of boreal aquatic systems and a change in these pathways can be foreseen with global warming. An increase in runoff may either flush even more the topsoil leading to a massive release of organic matter or percolate deeper into soils and increasing
weath-HESSD
4, 1095–1131, 2007
Scenarios on riverine tranport to the Baltic
C. Humborg et al. Title Page Abstract Introduction Conclusions References Tables Figures ◭ ◮ ◭ ◮ Back Close Full Screen / Esc
Printer-friendly Version Interactive Discussion
EGU
ering due to deeper thawing of permafrost areas. The significance of both processes for the overall C budgets is yet not known.
3 Conclusions
Probable changes in life styles, increased demand of hydropower and global warming may change the nutrient ratios in the Baltic Sea in the near future leading to improved
5
growth conditions for mainly dinoflagellates. TN loads to the Baltic will probably in-crease due to a change in human food consumption (more animal protein demand) that may foster higher livestock in the transitional countries of the Baltic Sea. Although the increase in TN loads may not be as high as we have foreseen in our most pes-simistic scenario (an increase of 340 000 tons yr−1) it appears obvious that a change
10
in these diffusive emissions can hardly be compensated by a potential decrease in TN loads as a result of an improved sewage treatment that we estimated to be one order of magnitude lower (about 34 000 tons yr−1) than the potential increase from livestock emissions. These latter emissions will also increase the TP loads but to a lesser extent compared to TN loads, since soil retention for P from manure is much higher than for N.
15
Thus, the potential TP increase from manure can be easily compensated by improved sewage treatment that is much more efficient for P compared to N. Our pessimistic sce-nario for the development of livestocks in transitional countries revealed a TP increase of some 16 000 tons yr−1that can be compensated if the transitional countries reach the same standard in sewage cleaning as Sweden that could decrease TP emissions by
20
the same amounts. Whether the transitional countries will have a livestock density as Denmark might be too pessimistic whereas the installation of tertiary cleaning of point sources is increasing with several % per year, thus, P load might decrease significantly in the near future. That DSi loads will decrease further due to a general trend in energy policy substituting energy from fossil fuels by renewable energy sources and the
en-25
largement of hydropower is definitely a realistic option in the Baltic Sea catchment. It is also likely that the riverine loads of both organic and inorganic forms of carbon (DOC
HESSD
4, 1095–1131, 2007
Scenarios on riverine tranport to the Baltic
C. Humborg et al. Title Page Abstract Introduction Conclusions References Tables Figures ◭ ◮ ◭ ◮ Back Close Full Screen / Esc
Printer-friendly Version Interactive Discussion
EGU
and alkalinity) will increase from the boreal part of the Baltic Sea catchment, due to higher runoff and deeper soil infiltration of rain and melt water. This will increase the DOC concentration that is already high in the Baltic Sea. This will influence significantly light conditions for phytoplankton growth. Whether alkalinity may increase or decrease cannot be evaluated right now since a higher riverine input might be compensated by a
5
potential higher freshness of the Baltic Sea when total river runoff will increase (Winsor et al., 2001).
References
Algesten, G., Sobek, S., Bergstrom, A. K., Agren, A., Tranvik, L. J., and Jansson, M.: Role of lakes for organic carbon cycling in the boreal zone, Global Change Biol., 10, 141–147, 2004.
10
Berner, E. K. and Berner, R. A.: Global Environment: Water, Air and Geochemical Cycles, Prentice Hall, 1995.
Boyer, E. W., Hornberger, G. M., Bencala, K. E., and McKnight, D.: Overview of a simple model describing variation of dissolved organic carbon in an upland catchment, Ecol. Modell., 86, 183–188, 1996.
15
Boyer, E. W., Goodale, C. L., Jaworsk, N. A., and Howarth, R. W.: Anthropogenic nitrogen sources and relationships to riverine nitrogen export in the northeastern USA, Biogeochem-istry, 57, 137–169, 2002.
Campling, P., Terres, J. M., Walle, S. V., Van Orshoven, J., and Crouzet, P.: Estimation of nitrogen balances from agriculture for EU-15: spatialisation of estimates to river basins using
20
the CORINE Land Cover, Phys. Chem. Earth, 30, 25–34, 2005.
Egge, J. K. and Aksnes, D. L.: Silicate as Regulating Nutrient in Phytoplankton Competition, Mar. Ecol.-Prog. Ser., 83, 281–289, 1992.
Evans, C. D., Freeman, C., Monteith, D. T., Reynolds, B., and Fenner, N.: Climate change – Terrestrial export of organic carbon – Reply, Nature, 415, 862–862, 2002.
25
Evans, C. D., Chapman, P. J., Clark, J. M., Monteith, D. T., and Cresser, M. S.: Alternative explanations for rising dissolved organic carbon export from organic soils, Global Change Biol., 12, 2044–2053, 2006.
HESSD
4, 1095–1131, 2007
Scenarios on riverine tranport to the Baltic
C. Humborg et al. Title Page Abstract Introduction Conclusions References Tables Figures ◭ ◮ ◭ ◮ Back Close Full Screen / Esc
Printer-friendly Version Interactive Discussion
EGU
Freeman, C., Evans, C. D., Monteith, D. T., Reynolds, B., and Fenner, N.: Export of organic carbon from peat soils, Nature, 412, 785–785, 2001.
Gorham, E.: Northern Peatlands – Role in the Carbon-Cycle and Probable Responses to Cli-matic Warming, Ecol. Appl., 1, 182–195, 1991.
Graham, L. P.: Climate change effects on river flow to the Baltic Sea, Ambio, 33, 235–241,
5
2004.
Haith, D. A. and Shoemaker, L. L.: Generalized Watershed Loading Functions for Stream-Flow Nutrients, Water Resour. Bull., 23, 471–478, 1987.
Hannerz, F. and Destouni, G.: Spatial characterization of the Baltic Sea Drainage Basin and its unmonitored catchments, Ambio, 35, 214–219, 2006.
10
HELCOM: The fourth Baltic Sea pollution load compilation (PLC-4). Baltic Sea Environment Proceedings, Baltic Sea Environment Proceedings, 93, 200, 2004.
Hinzman, L. D., Bettez, N. D., Bolton, W. R., Chapin, F. S., Dyurgerov, M. B., Fastie, C. L., Griffith, B., Hollister, R. D., Hope, A., Huntington, H.P ., Jensen, A. M., Jia, G. J., Jorgenson, T., Kane, D. L., Klein, D. R., Kofinas, G., Lynch, A. H., Lloyd, A. H., McGuire, A.D., Nelson,
15
F. E., Oechel, W. C., Osterkamp, T. E., Racine, C. H., Romanovsky, V.E., Stone, R.S., Stow, D. A., Sturm, M., Tweedie, C. E., Vourlitis, G. L., Walker, M. D., Walker, D. A., Webber, P. J., Welker, J. M., Winker, K. and Yoshikawa, K.: Evidence and implications of recent climate change in northern Alaska and other arctic regions, Climatic Change, 72, 251–298, 2005. Howarth, R. W., Billen, G., Swaney, B., Townsend, A., Jaworski, N., Lajtha, K., Downing, J.
20
A., Elmgren, R., Caraco, N., Jordan, T., Berendse, F., Freney, J., Kudeyarov, V., Murdoch, P., and Zhu Zhao, L.: Regional nitrogen budgets and riverine N & P fluxes for the drainages to the North Atlantic Ocean: Natural and human influences, Biogeochemistry, 35, 75–139, 1996.
Humborg, C., Smedberg, E., M ¨orth, C.-M., Rahm, L., and Danielsson, A.: Dissolved silica
25
dynamics in boreal and arctic rivers: vegetation control over temperature?, In The Silicon Cycle, edited by: Ittekkot, V., Unger, D., Humborg, C., and Tac An, N., Washington DC: Island Press, 53–69, 2006a.
Humborg, C., Conley, D. J., Rahm, L., Wulff, F., Cociasu, A., and Ittekkot, V.: Silicon retention in river basins: Far-reaching effects on biogeochemistry and aquatic food webs in coastal
30
marine environments, Ambio, 29, 45–50, 2000.
Humborg, C., Pastuszak, M., Aigars, J., Siegmund, H., Morth, C. M., and Ittekkot, V.: De-creased silica land-sea fluxes through damming in the Baltic Sea catchment – significance
HESSD
4, 1095–1131, 2007
Scenarios on riverine tranport to the Baltic
C. Humborg et al. Title Page Abstract Introduction Conclusions References Tables Figures ◭ ◮ ◭ ◮ Back Close Full Screen / Esc
Printer-friendly Version Interactive Discussion
EGU
of particle trapping and hydrological alterations, Biogeochemistry, 77, 265–281, 2006b. Humborg, C., Blomqvist, S., Avsan, E., Bergensund, Y., Smedberg, E., Brink, J., and
Morth, C. M.: Hydrological alterations with river damming in northern Sweden: Impli-cations for weathering and river biogeochemistry, Glob. Biogeochem. Cycle, 16, 1039, doi:10.1029/2000GB001369, 2002.
5
Humborg, C., Smedberg, E., Blomqvist, S., Morth, C. M., Brink, J., Rahm, L., Danielsson, A., and Sahlberg, J.: Nutrient variations in boreal and subarctic Swedish rivers: Landscape control of land-sea fluxes, Limnol. Oceanogr., 49, 1871–1883, 2004.
Iital, A., Stalnacke, P., Deelstra, J., Loigu, E., and Pihlak, M.: Effects of large-scale changes in emissions on nutrient concentrations in Estonian rivers in the Lake Peipsi drainage basin, J.
10
Hydrol., 304, 261–273, 2005.
Johansson, S., Bonsdorff, E. and Wulff, F.: The MARE Research Program 1999–2006 – Re-flections on program management, Ambio, 36, 119–122, 2007.
Johnes, P. J., Moss, B., and Phillips, G. L.: The determination of water quality by land use, livestock numbers and population data - testing of a model for use in conservation and water
15
quality management, Freshw. Biol., 36, 451–473, 1996.
Kronvang, B., Jeppesen, E., Conley, D. J., Sondergaard, M., Larsen, S. E., Ovesen, N. B., and Carstensen, J.: Nutrient pressures and ecological responses to nutrient loading reductions in Danish streams, lakes and coastal waters, J. Hydrol., 304, 274–288, 2005.
Lasaga, A.: Kinetic Theory in Earth Sciences, Princton University Press, 1998.
20
Lehner, B., Czisch, G., and Vassolo, S.: The impact of global change on the hydropower potential of Europe: a model-based analysis, Energy Policy, 33, 839–855, 2005.
L ¨ofgren, S., Gustafson, A., Steineck, S., and St ˚alnacke, P.: Agricultural development and nutri-ent flows in the Baltic states and Sweden after 1988, Ambio, 28, 320–327, 1999.
Meybeck, M.: Pathways of major elements from land to ocean through rivers, in: River Inputs
25
to Ocean Systems, edited by: Martin, J.-M., Burton, J. D., and Eisma, D., UNEP IOC SCOR United Nations, 18–30, 1979.
M ¨orth, C.-M., Humborg, C., Eriksson, E., Danielsson, A., Medina, R., L ¨ofgren, S., Swaney, D. P., and Rahm, L.: Modeling riverine nutrient transport of the Baltic Sea-A large scale approach, Ambio, 36, 124–133, 2007.
30
Nixon, S. W.: Coastal Marine Eutrophication – a Definition, Social Causes, and Future Con-cerns, Ophelia, 41, 199–219, 1995.
HESSD
4, 1095–1131, 2007
Scenarios on riverine tranport to the Baltic
C. Humborg et al. Title Page Abstract Introduction Conclusions References Tables Figures ◭ ◮ ◭ ◮ Back Close Full Screen / Esc
Printer-friendly Version Interactive Discussion
EGU
Schroder, J. J., and Willems, W. J.: Leaching of nitrate from agriculture to groundwater: the effect of policies and measures in the Netherlands, Environ. Pollut., 102, 471–478, 1998. Peterson, B. J., Holmes, R. M., McClelland, J. W., Vorosmarty, C. J., Lammers, R. B.,
Shiklo-manov, A. I., ShikloShiklo-manov, I. A., and Rahmstorf, S.: Increasing river discharge to the Arctic Ocean, Science, 298, 2171–2173, 2002.
5
Rukhovets, L. A., Astrakhantsev, G. P., Menshutkin, V. V., Minina, T. R., Petrova, N. A., and Poloskov, V. N.: Development of Lake Ladoga ecosystem models: modeling of the phyto-plankton succession in the eutrophication process. I, Ecol. Modell., 165, 49–77, 2003. Sapek, A.: The Effects of Agriculture on Water Quality: A Polish Perspective, in: Center for
Agricultural and Rural Development, Iowa State University, p. 22, 1997.
10
Schelske, C. L., Stoermer, E. F., Conley, D. J., Robbins, J. A., and Glover, R. M.: Early eutroph-ication in the lower Great Lakes: New evidence from biogenic silica in sediments, Science (Washington) [SCIENCE (WASH.).], 222, 320–322, 1983.
Schernewski, G. and Neumann, T.: The trophic state of the Baltic Sea a century ago: a model simulation study, J. Mar. Syst., 53, 109–124, 2005.
15
Smedberg, E., Morth, C. M., Swaney, D. P., and Humborg, C.: Modeling hydrology and silicon-carbon interactions in taiga and tundra biomes from a landscape perspec-tive: Implications for global warming feedbacks, Glob. Biogeochem. Cycle, 20, GB2014, doi:10.1029/2005GB002567, 2006.
Sobek, S., Tranvik, L. J., and Cole, J. J.: Temperature independence of carbon dioxide
supersat-20
uration in global lakes, Glob. Biogeochem. Cycle, 19, GB2003, doi:10.1029/2004GB002264, 2005.
St ˚alnacke, P., Grimvall, A., Sundblad, K., and Tonderski, A.: Estimation of riverine loads of nitrogen and phosphorus to the Baltic Sea, 1970–1993, Environ. Monit. Assess., 58, 173– 200, 1999a.
25
St ˚alnacke, P., Grimvall, A., Sundblad, K., and Wilander, A.: Trends in nitrogen transport in Swedish rivers, Environ. Monit. Assess., 59, 47–72, 1999b.
St ˚alnacke, P., Grimvall, A., Libiseller, C., Laznik, A., and Kokorite, I.: Trends in nutrient concen-trations in Latvian rivers and the response to the dramatic change in agriculture, J. Hydrol., 283, 184–205, 2003.
30
Tranvik, L. J. and Jansson, M.: Climate change – Terrestrial export of organic carbon, Nature, 415, 861–862, 2002.
HESSD
4, 1095–1131, 2007
Scenarios on riverine tranport to the Baltic
C. Humborg et al. Title Page Abstract Introduction Conclusions References Tables Figures ◭ ◮ ◭ ◮ Back Close Full Screen / Esc
Printer-friendly Version Interactive Discussion
EGU
B.: The silica balance in the world ocean – a reestimate, Science, 268, 375–379, 1995. Vagstad, N., Stalnacke, P., Andersen, H. E., Deelstra, J., Jansons, V., Kyllmar, K., Loigu, E.,
Rekolainen, S., and Tumas, R.: Regional variations in diffuse nitrogen losses from agriculture in the Nordic and Baltic regions, Hydrol. Earth Syst. Sci., 8, 651–662, 2004,
http://www.hydrol-earth-syst-sci.net/8/651/2004/.
5
Walker, D. A., Auerbach, N. A., Bockheim, J. G., Chapin, F. S., Eugster, W., King, J. Y., Mc-Fadden, J. P., Michaelson, G. J., Nelson, F. E., Oechel, W. C., Ping, C. L., Reeburg, W. S., Regli, S., Shiklomanov, N. I., and Vourlitis, G. L.: Energy and trace-gas fluxes across a soil pH boundary in the arctic, Nature, 394, 469–472, 1998.
Weyhenmeyer, G. A., Meili, M., and Livingstone, D. M.: Nonlinear temperature response of lake
10
ice breakup, Geophys. Res. Lett., 31, L07203 doi:10.1029/2004GL019530, 2004.
Winsor, P., Rodhe, J., and Omstedt, A.: Baltic Sea ocean climate: an analysis of 100 yr of hydrographic data with focus on the freshwater budget, Clim. Res., 18, 5–15, 2001.
Witek, Z., Humborg, C., Savchuk, O., Grelowski, A., and Lysiak-Pastuszak, E.: Nitrogen and phosphorus budgets of the Gulf of Gdansk (Baltic Sea), Estuar. Coast. Shelf Sci., 57, 239–
15
248, 2003.
Wulff, F., Savchuk, O., Sokolov, A., Humborg, C., and M ¨orth, C.-M.: Management options and effects on a marine ecosystem: Assessing the future of the Baltic., Ambio, 36, 243–249, 2007.
Zessner, M. and Lindtner, S.: Estimations of municipal point source pollution in the context of
20
HESSD
4, 1095–1131, 2007
Scenarios on riverine tranport to the Baltic
C. Humborg et al. Title Page Abstract Introduction Conclusions References Tables Figures ◭ ◮ ◭ ◮ Back Close Full Screen / Esc
Printer-friendly Version Interactive Discussion
EGU
Table 1. Baltic Sea basin characteristics indicated as population, population distribution and land class areas to each of the Baltic Sea basins; Bothnian Bay (BB), Baltic Proper (BP), Bothnian Sea (BS), Gulf of Finland (GF), Gulf of Riga (GR), Danish Sounds (DS), Kattegat (KT) and to the total Baltic Sea.
Basin Population Urban Rural Catchment Deciduous Coniferous Mixed Forest Herbacous Wetlands Cultivated Bare Water Snow Artificial % % Area ha ha ha ha ha ha ha ha ha and Ice ha ha BB 1 320 010 47.7 52.3 26 362 519 787 625 11 433 919 7 197 350 1 400 056 2 373 819 1 075 175 609 163 1 412 081 40 306 33 025 BP 54 861 680 56.8 43.2 57 153 463 1 300 206 10 142 531 5 713 819 4 789 506 250 044 32 775 738 2863 1 369 281 0 809 475 BS 2 393 152 39.4 60.6 22 637 213 452 144 13 487 719 4 440 944 691 863 737 250 1 091 388 168 194 1 458 981 275 108 456 DS 5 220 245 84.6 15.4 2 883 425 34 538 73 606 79 219 135 056 10 550 2 265 781 0 134 538 0 150 138 GF 12 364 198 67.0 33.0 43 110 463 1 282 219 18 592 269 7 614 144 382 238 183 844 8 694 344 0 6 143 138 0 218 269 GR 3 970 124 45.7 54.3 13 378 794 796 344 2 234 406 2 253 125 905 838 58 988 6 794 231 0 255 281 0 80 581 KT 2 920 856 57.8 42.2 7 934 431 156 938 3 410 575 1 225 913 202 656 78 431 1 767 013 7 600 968 381 0 116 925 SUM 83 050 265 57.0 43.0 173 460 306 4 810 013 59 375 025 28 524 513 8 507 213 3 692 925 54 463 669 787 819 11 741 681 40 581 1 516 869
HESSD
4, 1095–1131, 2007
Scenarios on riverine tranport to the Baltic
C. Humborg et al. Title Page Abstract Introduction Conclusions References Tables Figures ◭ ◮ ◭ ◮ Back Close Full Screen / Esc
Printer-friendly Version Interactive Discussion
EGU
Table 2.Load of nutrients by country via rivers and coastal points sources, averaged for 1997– 2003, according to data reported to HELCOM.
TN load TP load
Country (ton yr−1)% (ton yr−1)%
Denmark 57 501 8% 1795 5% Estonia 30 870 4% 1261 4% Finland 71 110 10% 3348 9% Germany 20 848 3% 533 1% Lithuania 48 872 7% 2534 7% Latvia 77 051 10% 2184 6% Russia 89 386 12% 6,569 18% Poland 215 350 29% 13 717 38% Sweden 125 726 17% 4003 11% SUM 736 714 100% 35 944 100%
HESSD
4, 1095–1131, 2007
Scenarios on riverine tranport to the Baltic
C. Humborg et al. Title Page Abstract Introduction Conclusions References Tables Figures ◭ ◮ ◭ ◮ Back Close Full Screen / Esc
Printer-friendly Version Interactive Discussion
EGU
Table 3.Levels of sewage treatment by country in 2004.
Country Primary Secondary Tertiary
wwt % wwt % wwt % Belarus 0 50 0 Czech republic 0 61 0 Denmark 2 5.2 81 Estonia 2.2 34 34 Finland 0 0 80 Germany 0 9 85 Lthuania 33 6 18 Latvia 1.8 35 33 Norway 0 5.8 86 Poland 2.2 23 34 Russia 0 50 0 Sweden 0 5.8 86
HESSD
4, 1095–1131, 2007
Scenarios on riverine tranport to the Baltic
C. Humborg et al. Title Page Abstract Introduction Conclusions References Tables Figures ◭ ◮ ◭ ◮ Back Close Full Screen / Esc
Printer-friendly Version Interactive Discussion
EGU
Table 4.Annual emissions of nutrients from cattle (milk cows, other cattle), pigs (slaughter pigs and sows) and humans (kg unit−1year−1) by country.
Country Milk cows Other cattle Slaughter pigs Sows Humans
N P N P N P N P N P Belarus 47.4 9.8 34.0 4.5 8.8 3.6 22.0 9.0 3.9 1.1 Czech republic 63.0 11.8 34.0 4.5 8.8 3.6 22.0 9.0 3.9 1.1 Denmark 74.2 13.3 34.0 4.5 8.8 3.6 22.0 9.0 3.9 1.1 Estonia 94.3 15.9 34.0 4.5 8.8 3.6 22.0 9.0 3.9 1.1 Finland 84.8 14.6 34.0 4.5 8.8 3.6 22.0 9.0 3.9 1.1 Germany 96.1 16.1 34.0 4.5 8.8 3.6 22.0 9.0 3.9 1.1 Lithuania 63.5 11.9 34.0 4.5 8.8 3.6 22.0 9.0 3.9 1.1 Latvia 62.2 11.7 34.0 4.5 8.8 3.6 22.0 9.0 3.9 1.1 Norway 101.6 16.8 34.0 4.5 8.8 3.6 22.0 9.0 3.9 1.1 Poland 63.0 11.8 34.0 4.5 8.8 3.6 22.0 9.0 3.9 1.1 Russia 47.4 9.8 34.0 4.5 8.8 3.6 22.0 9.0 3.9 1.1 Sweden 101.6 16.8 34.0 4.5 8.8 3.6 22.0 9.0 3.9 1.1
HESSD
4, 1095–1131, 2007
Scenarios on riverine tranport to the Baltic
C. Humborg et al. Title Page Abstract Introduction Conclusions References Tables Figures ◭ ◮ ◭ ◮ Back Close Full Screen / Esc
Printer-friendly Version Interactive Discussion
EGU
Table 5.Load reductions/increase of nutrients by country caused by the various scenarios i–iii.
Scenario i Scenario ii Scenario iii
Country TN reduction (ton yr−1) % TP reduction (ton yr−1) % TP reduction tons (ton yr−1) % TN increase (ton yr−1) % TP increase (ton yr−1) % Belarus –5574 16% –1977 16% –401 12% 58 684 17% 2449 15% Czech rep –1293 4% –391 3% –80 2% 2839 1% 117 1% Denmark –104 3% – – – – Estonia –604 0% –133 1% –33 1% 16 329 5% 925 6% Finland – – – – –160 5% 4105 1% 318 2% Germany – – – – – – 5199 2% 465 3% Lithuania –1151 3% –615 5% –202 6% 38 825 11% 2504 16% Latvia –203 1% –187 2% –55 2% 21 278 6% 1,339 8% Norway – – – – –3 0% 255 0% 21 0% Russia –12 138 36% –3829 31% –769 24% 32 406 10% 1366 8% Poland –13 338 39% –5292 43% –1326 41% 149 756 44% 5736 36% Sweden – – – – –106 3% 11 182 3% 836 5% SUM –34 300 100% –12 424 100% –3238 100% 340 859 100% 16 076 100%
HESSD
4, 1095–1131, 2007
Scenarios on riverine tranport to the Baltic
C. Humborg et al. Title Page Abstract Introduction Conclusions References Tables Figures ◭ ◮ ◭ ◮ Back Close Full Screen / Esc
Printer-friendly Version Interactive Discussion
EGU
Table 6.Livestock density in the Baltic Sea catchment by country.
Country Catchment Area ha Cultivated are ha Pigs Pigs/ha Cattle Cattle/ha
Belarus 891 8570 5 134 108 1 283 615 0.25 1 034 096 0.20 Czech rep 954 174 612 990 541 260 0.88 208 048 0.34 Denmark 2 696 949 2 191 004 7 022 347 3.21 1 202 578 0.55 Estonia 4 491 244 1 984 645 262 188 0.13 274 278 0.14 Finland 30 273 828 2 689 822 1 122 538 0.42 933 285 0.35 Germany 2 624 100 1 867 206 1 832 271 0.98 1 016 576 0.54 Latvia 6 478 096 3 277 510 500 635 0.15 540 289 0.16 Lithuania 6 469 354 4 012 765 832 187 0.21 832 195 0.21 Norway 1 394 112 122 225 71 841 0.59 56 765 0.46 Poland 32 207 281 20 677 731 17 167 399 0.83 6 615 023 0.32 Russia 33 005 131 8 261 300 898 546 0.11 945 341 0.11 Sweden 43 927 634 3 625 003 2 125 061 0.59 1 676 599 0.46 Grand Total 173 440 472 54 456 309 33 659 887 0.62 15 335 072 0.28
HESSD
4, 1095–1131, 2007
Scenarios on riverine tranport to the Baltic
C. Humborg et al. Title Page Abstract Introduction Conclusions References Tables Figures ◭ ◮ ◭ ◮ Back Close Full Screen / Esc
Printer-friendly Version Interactive Discussion
EGU
Table 7. DSi annual inputs and potential missing DSi loads divided by Baltic Sea subbasin (BB=Bothnian Bay, BS=Bothnian Sea, GF=Gulf of Finland, GR=Gulf of Riga, BP=Baltic proper).
Area Runoff Spec. Runoff DSi DSi yield Missing DSi
Sub-basin (km2) (106mm3yr−1) (l m−2yr−1) (ton yr−1) (kg km−2yr−1) (ton yr−1)
BB 235 499 97 064 412 220 855 938 56 079 BS 197 061 86 543 439 151 823 770 98 786 GF 384 853 105 779 275 55 823 145 105 262 GR 122 116 29 609 242 52 820 433 19 458 BP 488 394 85 320 175 230 030 471 114 197 Unmonitored 196 604 69 218 143 670 26 671 1 624 527 473 533 855 021 420 453
HESSD
4, 1095–1131, 2007
Scenarios on riverine tranport to the Baltic
C. Humborg et al. Title Page Abstract Introduction Conclusions References Tables Figures ◭ ◮ ◭ ◮ Back Close Full Screen / Esc
Printer-friendly Version Interactive Discussion
EGU
HESSD
4, 1095–1131, 2007
Scenarios on riverine tranport to the Baltic
C. Humborg et al. Title Page Abstract Introduction Conclusions References Tables Figures ◭ ◮ ◭ ◮ Back Close Full Screen / Esc
Printer-friendly Version Interactive Discussion
EGU
Fig. 2. Land classes for the Baltic Sea catchment. For the model simulations 10 classes were used, all herbaceous areas were aggregated to one class, tree classes were divided only into deciduous forest, mixed forest and coniferous forest, leaving us with the following classes; deciduous forest, coniferous forest, mixed forest, herbaceous areas, wetlands, cultivated areas, bare areas, water, snow and ice and artificial areas.
HESSD
4, 1095–1131, 2007
Scenarios on riverine tranport to the Baltic
C. Humborg et al. Title Page Abstract Introduction Conclusions References Tables Figures ◭ ◮ ◭ ◮ Back Close Full Screen / Esc
Printer-friendly Version Interactive Discussion
EGU
Fig. 3. Relationship between the gross national productivity per capita (GNP) and the animal protein consumption per capita for riparian Baltic Sea countries (Data from World Bank and FAO).
HESSD
4, 1095–1131, 2007
Scenarios on riverine tranport to the Baltic
C. Humborg et al. Title Page Abstract Introduction Conclusions References Tables Figures ◭ ◮ ◭ ◮ Back Close Full Screen / Esc
Printer-friendly Version Interactive Discussion
EGU
(a) (b)
Fig. 4.Development of fertilizer use (a) use and number of livestock (b) in riparian Baltic Sea countries.
HESSD
4, 1095–1131, 2007
Scenarios on riverine tranport to the Baltic
C. Humborg et al. Title Page Abstract Introduction Conclusions References Tables Figures ◭ ◮ ◭ ◮ Back Close Full Screen / Esc
Printer-friendly Version Interactive Discussion
EGU
Fig. 5. Transport of total nitrogen (TN), total phosphorus (TP) and water discharge by major Baltic Sea rivers (n=85) over time.
HESSD
4, 1095–1131, 2007
Scenarios on riverine tranport to the Baltic
C. Humborg et al. Title Page Abstract Introduction Conclusions References Tables Figures ◭ ◮ ◭ ◮ Back Close Full Screen / Esc
Printer-friendly Version Interactive Discussion
EGU
Forest
Herbacous Lake and streams
Cultivated areas
Ground water compartment 1
Ground water compartment 2 Precipitation Runoff Evapotranspiration Point sources: Manure Rural sewage Urban sewage: a) from WWTPs b) no treatment Erosion Calculated for each land class Loadings in mg l-1 Water
Fig. 6.Model architecture for CSIM. Precipitation and evapotranspiration were applied on each of the various land covers. Water from each land cover type was routed both directly to stream flow and down to the soil water compartment. From the soil water compartment water was routed to stream flow and to the groundwater compartment, and from there on to the stream. Four types of point sources were considered. Sewage nutrient load is calculated from the distribution of the urban and rural population, and the degree of connection to WWTP and the effectiveness of the treatment (primary, secondary and tertiary).
HESSD
4, 1095–1131, 2007
Scenarios on riverine tranport to the Baltic
C. Humborg et al. Title Page Abstract Introduction Conclusions References Tables Figures ◭ ◮ ◭ ◮ Back Close Full Screen / Esc
Printer-friendly Version Interactive Discussion
EGU
Fig. 7. DSi concentrations of major rivers classified by the major basins of the Baltic Sea they run to (BB=Bothnian Bay, BS=Bothnian Sea, GF=Gulf of Finland, GR=Gulf of Riga, BP=Baltic proper, KA=Kattegat).
HESSD
4, 1095–1131, 2007
Scenarios on riverine tranport to the Baltic
C. Humborg et al. Title Page Abstract Introduction Conclusions References Tables Figures ◭ ◮ ◭ ◮ Back Close Full Screen / Esc
Printer-friendly Version Interactive Discussion
EGU
HESSD
4, 1095–1131, 2007
Scenarios on riverine tranport to the Baltic
C. Humborg et al. Title Page Abstract Introduction Conclusions References Tables Figures ◭ ◮ ◭ ◮ Back Close Full Screen / Esc
Printer-friendly Version Interactive Discussion
EGU
Fig. 9. Trends (30 year monthly observations) in TOC concentrations in Swedish rivers as a function of longitude.