DIGITAL DEPOSITION OF YTTRIA PATTERNS ON TITANIUM SHEETS by
GABRIEL FERNANDEZ B.S., Mechanical Engineering
National University of Mexico (UNAM), 1995
Submitted to the Department of Mechanical Engineering in Partial Fulfillment of the
Requirements for the Degree of MASTER OF SCIENCE
at the
Massachusetts Institute of Technology June 1997
© 1997 Massachusetts Institute of T chn gy All rights reserved \ /
Signature of Author
Certified by
Deliean\ of14 echanical Engineering
\ May 28, 1997
Emanuel M. Sachs Professor of Mechanical Engineering Thesis Supervisor
Accepted by
MAssA.u..rt .w . .
OF~~L .
Ain A. Sonin Chairman, Graduate Committee
MASSACHUSETTS
INSTITUTE
OF TECHNOLOGY
Digital Deposition of Yttria Patterns on Titanium Sheets
byGabriel Fernandez Ares de Parga
Submitted to the Department of Mechanical Engineering on May 28, 1997, in partial fulfillment of the requirements for the Degree of Master of Science
Abstract
The ability to apply Yttria patterns on titanium sheets is required on a secondary manufacturing operation. The freedom to create 2 dimensional patterns as well as 3 dimensional ones by using Three Dimensional Printing allows for the application of Yttria patterns onto these sheets without the use of any type of screens. Two methods for creating these patterns were identified and studied.
The first approach consists of selectively printing binder on top of spread layer of powder. A second layer of powder is spread while the binder is still wet. The binder will then dry fixing the Yttria powder to the sheet on the selected positions. Sheets were printed using different particle sizes. Results show that patterns can be applied with good edge definition and uniform thickness using powder ranging from -53gm down to -20gm. The sheets were tested successfully in the secondary operation.
And alternative approach consists of mixing the binder and the ceramic powder to create a slurry. The slurry will then be selectively printed onto the sheet using Three Dimensional Printing. A formulation for a -20 gm Yttria powder slurry was developed using Poly Acrylic Acid as dispersant and Polyethylene Glycol as binder. Slurries with 20 volume fraction and less were dispersed and jetted through a 102 gm nozzle. These slurries adhered well to the titanium sheet as they were printed. The formulation was tested successfully in the secondary operation.
Following the High-Risk Approach patterns without deflection were printed. For a 102 gm nozzle the best flow rate was determined, as well as the optimal line spacing. The best procedure to print a certain area was to print a first round of lines, dry them and then print lines in between the first set. The average roughness of the layer printed was 14
gm.
In order to allow future printing of slurries with a nozzle size of 102 gm and deflection, the design of a print head to accommodate these slurries was also investigated
Thesis Supervisor: Dr. Emanuel Sachs Title: Professor of Mechanical Engineering
Dedication
To my wife
who is the most important part of my life.
To my family
Acknowledgements
I would like to thank the Boeing Company who made this project possible. Special thanks to Mr. John Fischer for all his help and support.
I would like to acknowledge all the support of the staff and students in the 3D printing project:
Ely Sachs, thanks for all important things you have taught me. I will never forget the opportunity you gave me.
Javier Bafios, thanks for your help but above that thanks for your friendship. Jeannie Yoo, thanks for everything, including my tennis lessons.
Dave Brancazio, Jim Serdy and Mike Rynerson thanks for all the help and good ideas that I received from you.
Jason Grau, for your help and friendship
Thank you, P.J. Baker, Laura Zaganjori, Michael Caradonna, Xiaorong Xu, Thomas Becker and Honglin Guo.
I would also like to acknowledge the support from other people outside the 3D printing group.
Luis Parra, Luis Ramirez and Gustavo Buhacoff thanks all for your support. Fred Cote, for the endless help in the machine shop.
Contents
Acknowledgements ... 4 Contents ... 5 L ist of Figures ... 7 L ist of T ables ... 10 Chapter 1 Introduction ... 11 1.1 Motivation ... ... 11 1.2G oals ... 111.3 Three Dimensional Printing ... 13
1.4 Ink-Jet Printing ... ... 16
Chapter 2 Low-Risk Approach... 18
2.1 Characterization of Materials Received from Boeing...18
2.2 Characterization of the Ceramic Powder Obtained by MIT ... 22
2.3 Packing and Apparent Densities ... 23
2.4 Description of the Low Risk Printing Process ... 26
2.5 Description and Measurement of the Printed Titanium Sheets ...32
2.6 Conclusions and Recommendations for the Low-Risk Approach ... 34
Chapter 3 High-Risk Approach... 36
3.1 Introduction...36
3.2 First Jetting Experiments of Yttria Slurries ... ...36
3.3 Development of Slurry Formulation...38
3.3.1 Dispersion Studies with pH and Steric Control ... 38
3.3.2 Poly Acrylic Acid ... 41
3.3.3 Poly Acrylic Acid and Polyethylene Glycol...47
3.4 Jetting Setup, First Continuous Jetting Experiments...48
3.5 The Generation of Droplets ... 52
3.6 Comparing the Amount of Yttria Printed by the High Risk Method to the One Printed by the Low Risk Method...53
Chapter 4 Line Printing Experiments... 55
4.1 Experiment Setup... 55
4.3 Printing Experiments and Results... ... 59
4.4 Line Width Predictions ... 62
Chapter 5 Line Printing Experiments with the Alpha Machine ...65
5.1 Introduction...65
5.2 Fluid System... ... ... 65
5.3 Printing... ... ... .67
Chapter 6 Printing with Deflection ... ... 72
6.1 Current Problems for Printing with Deflection ... ... 72
6.2 Printing a Test Pattern with Deflection...72
6.3 Modifications to the Actual Print Head in order to Handle Larger Nozzles...73
Chapter 7 Conclusions ... 76
7.1 Low Risk Printing ... 76
7.2 High Risk Printing...76
R eferences ... 77
Appendix A Print Head Study... 78
Appendix B CAD Files...99
List of Figures
Figure 1.3.1: The 3D-Printing Sequence ... 14
Figure 1.3.2: A 3DP machine ... ... ... ... 15
Figure 1.4.1: The compound jet ... ... .. ... ... . 17
Figure 2.1.1: Distribution of powder particle size in the sample provided by Boeing... 19
Figure 2.1.2: Unprocessed Yttria powder from the sample provided by Boeing Particle size range lies between 10 to 130 Lm ... 21
Figure 2.1.3: Particles between 20 and 37 microns form the sample provided by Boeing... 21
Figure 2.1.4: Particles below 20 microns form the sample provided Boeing ... 22
Figure 2.2.1: Yttria Powder with particle size of 10 microns and below. Vendor Johnson M atthey... ... 23
Figure 2.2.2: Yttria Powder with particle size below 20 microns. Vendor Johnson M atthey... ... 24
Figure 2.3.1: A. Stable dispersed suspension B. Flocculated suspension ... 25
Figure 2.4.1: Detail of Sheet printed by Low-Risk Approach Using method 1 Particle size 20 glm and below ... 27
Figure 2.4.2: Detail of Sheet Printed by Low-Risk Approach Using method 2 Particle size 53gm and below ... 27
Figure 2.4.3: Low Risk Approach Process ... 28
Figure 2.4.4: Detail of sheet printed with particles 53gm and less from the sample provided by Boeing Method 3 ... 29
Figure 2.4.5: Detail of sheet printed with particles 20gm and less. Johnson Matthey Pow der M ethod 3 ... 30
Figure 2.4.6: Detail of sheet printed with particles 53gm and less from the sample provided by Boeing Method 3 ... 30
Figure 2.4.7: Detail of sheet printed with particles 53gm and less from the sample provided by Boeing Method 3 ... 31
Figure 2.4.8: Entire sheet printed with particles 53gm and less form the sample
provided by Boeing Method 3 ... 31
Figure 2.5.1: Thickness Measurements Positions ... ... 32
Figure 2.6.1: Spreading powder from higher position ... .... 35
Figure 3.3.1: pH vs. zeta potential for Yttria slurry Test performed with slurry of 5 volume % and a particle size of -10m ... 39
Figure 3.3.2: Viscosity vs. binder concentration for PAA MW 2000 and PAA MW 5000 ... ... 42
Figure 3.3.3: 20 Volume percent slurry with 40 volume percent of PAA... 44
Figure 3.3.4: Tetrahedron structure of Carbon ... 45
Figure 3.4.1: Fluid system for jetting slurries ... 49
Figure 4.1.1: Line Printing Setup ... ... ... ... 55
Figure 4.2.1: Electronic circuit for measuring printing velocity... 57
Figure 4.3.1: Two lines printed in cross together. Flow rate 3cc/min. Freq. 7.5 kHz. Vertical speed Im/s Horizontal speed 0.8 m/s ... 60
Figure 4.3.2: Two lines printed. Flow rate 3cc/min. Freq. 7.5 kHz. Speed 1 m/s Line widths close to 0.8 mm ... 60
Figure 4.3.3: 4 Lines printed together Freq. = 7.5 kHz. Q=3 cc/min. Separation 61 600gm. First line printed in the top of figure ... Figure 4.3.4: Flow rate 2cc/min. Freq. 2 kHz. Speed 2m/s Diameter of drops 0.450 mm. Average spacing around 0.8 mm. ... 62
Figure 4.4.1: Line width vs. print speed. Slurry 20 Vol. % Nozzle size 102gm... 63
Figure 4.4.2: Contact angle between a 15 Volume percent slurry and titanium ... 64
Figure 4.4.3: Print speed vs. line thickness for a 15 Vol. % Slurry ... 64
Figure 5.2.1: System for jetting Slurries with a recycling pump ... 66
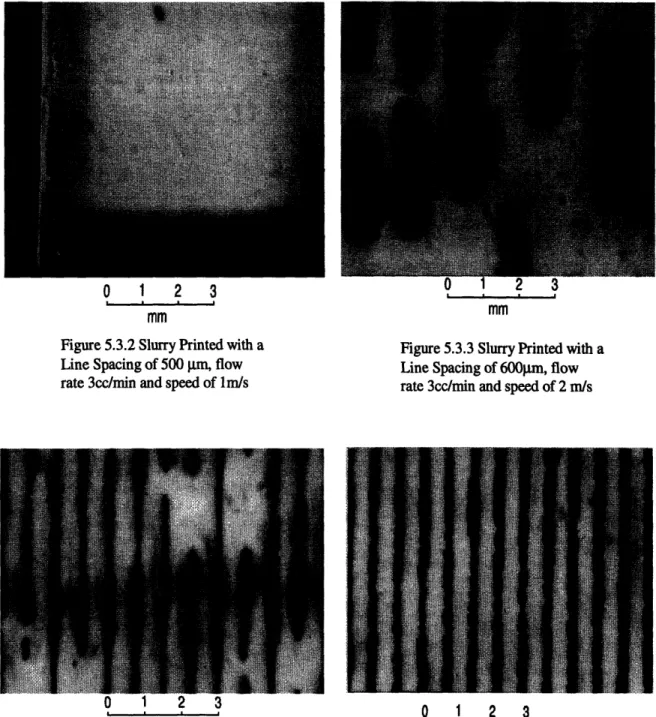
Figure 5.3.1: Test Pattern for the High-Risk Approach... ... .. 67
Figure 5.3.2: Slurry Printed with a Lines Spacing of 500gm, flow rate 3cc/min and speed of Im /s ... 68
Figure 5.3.3: Slurry Printed with a Line Spacing of 600gm, flow rate 3cc/min and
speed of 2m /s ... 68 Figure 5.3.4: Slurry Printed with a Lines Spacing of 700gm, flow rate 3cc/min and
speed of 2m /s ... 68 Figure 5.3.5: Slurry Printed with a Lines Spacing of 800gm, flow rate 3cc/min and
speed of 2m /s ... 68 Figure 5.3.6: Printing Sequence in the High Risk Approach... 69 Figure 5.3.7: Area printed with a Line Separation of 450 gLm. Flow rate = 3 cc/min and
speed = 2m/s Distance between nozzle and sheet 2.5 cm ... 70 Figure 6.2.1: Circle printed with Yttria Slurry (15%) Particle size 20gm and less Line
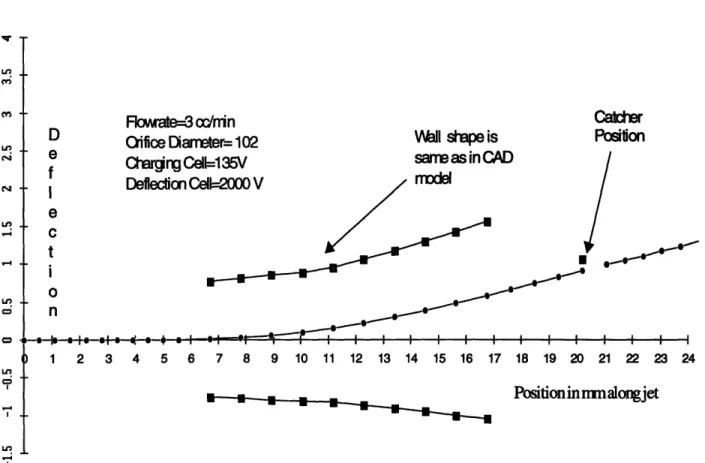
spacing 200gm. Frequency of 7 kHz and a nozzle diameter of 120Rm...73 Figure 6.3.1: Position vs. deflection using a charging cell of 0.030 by 0.120 inches
List of Tables. Table 2.1.1: Table 2.1.2: Table 2.3.1: Table 2.3.2: Table 2.5.1: Table 3.2.1: Table 3.3.1: Table 3.3.2: Table 3.3.3: Table 3.4.1: Table 3.5.1: Table 4.2.1: Table 5.3.1:
Bulk Properties of Yttria ... 18
Settling time for the particles in the powder sample provided by Boeing... 20
Packing densities for the powders depicted in sections 2.1 and 2.2... 25
Apparent densities and packing densities for the powders depicted in sections 2.1 and 2.2 ... 26
Characteristics of the printed sheets... 33
First jetting experiments for Yttria slurries (Yttria and water) ... 37
Characteristics of the elements composing PAA ... ... 45
Components for a 20 vol% slurry... 48
Components for a 15 vol % slurry ... ... ... 48
Jetted Slurries of several volume fractions Powder commercial -20tm Y ttria... ... 50
Jetting parameters for a 102 gm nozzle... 52
Speeds measured with digital velocity sensor for a predicted speed of Im/s... 58
Chapter 1 Introduction
1.1 Motivation
In some industry applications the necessity of developing a better and more reliable manufacturing processes is essential. Better products fabricated in lesser amounts of time are daily required. Some current manufacturing processes does not fulfill the total expectations; therefore the development of a new technique or the adaptation of another has to be achieved. In the case of the Aerospace industry, all the parts must have very high standards of quality making the control of the manufacturing processes a key issue. In the particular case of the fabrication of "Yttria Patterns on Titanium Sheets", the actual manufacturing procedure is not good enough to meet the high quality standards the application requires. Screen-printing and other methods does not seem to work in appropriate ways; therefore the search for a new fabrication technique is necessary.
The ability to apply yttria patterns on titanium sheets is required in a proprietary Boeing process. The freedom to create 2 dimensional patterns as well as 3 dimensional ones by the use of the 3-D Printing process allows for the fabrication of these sheets without the use of any type of screens. It is possible to adapt the 3D-Printing technology to this process by simply printing one layer of material on top of the titanium sheet. Because there are no analog methods used for this application the process has been described as Digital Deposition of Yttria Patterns on Titanium Sheets by 3D-Printing. This process is potentially capable of much better edge definition and pattern registration than would ever be possible with screen-printing. In addition, the main virtue of the process is that it does not require any tools to print a pattern.
1.2 Goals
Printing specific patterns of ceramic powder and binder on the sheets can be made using the current 3D-Printing with some minor changes. Two approaches have been identified as potential construction methods. Both techniques have advantages and
disadvantages. The first approach, considered as the Low Risk Approach, consists of printing binder on top of a manually or automatically spread powder layer. In contrast, the second one combines the binder and the ceramic powder creating slurry. In general the binders used in 3D-Printing are not slurries. The challenge of this method lies in printing slurries with large particle sizes. These suspensions have to be jetted through nozzles that are bigger than the conventional ones. This approach will be considered as the High Risk
Approach.
The overall goal of this project is to determine the feasibility of these processes. In parallel, it is an objective of this work is to determine which method is more reliable and robust enough to stand several hours of operation. The 3D-Printing process has unique features that make possible the use of different material systems. Some of the specific goals of this project are:
Low Risk:
* Demonstrate the actual printing process jetting normal binder on top of a chemically cleaned titanium sheet with powder.
* Determine the adequate printing sequence.
* Identify the key parameters of the printing process.
* Print several test pattern onto titanium sheets with powder.
* Optimize the process in order to achieve the best edge definition as well as layer thickness and surface finish.
* Test the performance of the printed sheets. (Boeing shall evaluate the performance.)
High Risk:
* Adapt the current printing machine in order to accommodate slurry-based fluids.
* Develop a slurry-based formula that will perform the intended purposes on the sheet after jetting including binding the powder to the sheet and burning off cleanly.
* Identify the key parameters of the process.
* Redesign, if necessary, part of the 3DP printhead in order to accommodate all the changes that come with the use of bigger nozzles and heavier fluids. * Print several test patterns on sheets
* Test the performance of the printed sheets. (Boeing shall evaluate the performance.)
1.3 -THREE DIMENSIONAL PRINTING
Three Dimensional Printing (3DP) is a process for the rapid fabrication of three-dimensional parts directly from computer models [Sachs et al, 1992]. The process creates parts by a layered printing process. The information of each layer is obtained by applying a slicing algorithm to the computer model part. An individual two-dimensional layer is created by adding a layer of powder to the top of a piston cylinder containing a powder bed and the part being fabricated. The new powder layer is selectively joined where the part is to be formed by "ink-jet" printing the binder material. The piston, powder bed and part are lowered and a new layer of powder is spread out and selectively joined. The layering process is repeated until the part is completely printed. Unbound powder temporarily supports unconnected portions of the component, allowing overhangs, undercuts and internal volumes to be created. The unbound powder is removed upon process completion, leaving the finished part. The 3D Printing process sequence is shown in figure 1.2.1.
3D Printing was initially developed for the production of ceramic shells and cores
to be later used for the casting of metal parts. In this embodiment of the process, a powder is spread into the powder piston and selectively bound using colloidal silica as a binder. After completion of printing, the parts is fired in a furnace to further bond the
silica to the alumina and strengthen the part sufficiently so that it can be used as a ceramic mold.
InteraWe 3at ge Friska Part
Figure 1.3.1 the 3D-Printing Sequence
In general the printing nozzle has a circular opening of 47-50 1pm in diameter, but currently other diameters are being explored. The nozzle is stimulated by a piezoelectric transducer vibrating at a tuned frequency is used to break the stream into droplets. Commands to modulate the binder stream are derived from CAD data.
An important aspect of the 3D Printing process that had yet to be exploited was its inherent flexibility with respect to materials systems. Although developed around alumina powder and silica binder, there were no fundamental restrictions to the type of powder and binder, which could be used. Any material that could be attained in powdered form is usable in the process. Binder selection for a given powder would hinge on the type of post-processing which would be required. Also, the binder would have to be dispensable from an ink-jet style printhead compatible with the existing
machine, although currently Drop on Demand print heads can also be used to create a part. Figure 1.2.2 shows a drawing of a 3DP system.
nder
pply
Figure 1.3.2 A 3DP machine
This research effort employs the 3D-Printing process to deposit a single layer of ceramic material. Eventually, the conception of printing several layers can also be used to achieve a desire thickness of the primer layer. In other words, if after printing the first layer of powder the thickness of such layer is not the specified one a succeeding layer can be printed using the same CAD information. The pattern can be created on a normal CAD program where the depth of the solid doesn't matter. The file would then be processed into a Stereolithography (STL) file and then sliced into a 3DP file which slices the part so it can be interpreted and rastered on top of the titanium sheet.
1.4 Ink-jet Printing
The 3D-Printing process uses Ink-jet printing technology where liquids that are jetted through small nozzles travel through the air in form of a continuous laminar flow cylinder [Heinzl et. al.]. The continuous part of the jet disintegrates spontaneously into a train of droplets. The transformation of the jet into droplets occurs because of a disturbance initiated at the nozzle. This disturbance can be controlled using a piezo attached to the nozzle. Rayleigh (1878) studied the problem for nonviscous liquid jets. Later, Weber (1931) treated the same problem including viscosity in the calculations and reached very similar results to that of Rayleigh. Bruce (1976) showed that results are accurate up to a viscosity of 10 cP.
As stated before, two approaches are going to be followed along the course of this work. The ink-jet printing technology is going to be used for both cases with some variations. In the case of the Low Risk Approach, normal nozzles, binder fluids and printing parameters will be used; while in the High Risk two configurations can be followed. The first one is just the jetting of the slurry through a larger orifice nozzle. The second one is the use of the compound jet. This method is an alternative way to generate a slurry jet [Heinzl et. al.]. Hermanrud and Hertz (1979) developed it. A high speed jet emerges from an orifice below the surface of a stationary fluid. After breaking through the surface, the primary jet is enclosed by a concentric layer of the stationary fluid, which has been dragged along by viscous forces between the jet and the fluid. Usually the submerged nozzle is very small in diameter and emerges under high pressure. This is considered the primary fluid while the one that rests in the pool is the secondary fluid. The compound jet breaks into a train of droplets in the same conventional way as the normal jet. We can see an illustration of the method in figure 1.4.1.
O
0
Figure 1.4.1 The compound jet.
For purpose of this research its clear that the normal printing mode is easier to implement. The compound jet would present a lot of problems because the sheets will have to be printed upwards. Anyway, the compound jet presents a lot of advantages in regards to fluid properties. As an example, the primary fluid could be water or binder while the secondary fluid could be the slurry. Problems such as clogging of the nozzle could be easily avoided by using a compound jet although a series of other problems may arise. In the event that the conventional printing would fail, then the possibility of using a compound jet will be explored.
Chapter 2. Low-Risk Approach
2.1 Characterization of the materials received by Boeing.
A. - Powder: Yttrium oxide, a chemical compound better know as yttria was the material selected by Boeing to deposit on the chemically cleaned titanium sheets. The next table presents some of the most important characteristics of the ceramic powder.
Chemical Formula Y203
Molecular Weight 225.807
Density 5.01 gr./cc.
Melting Point 2410 C
Appearance White solid powder, no odor Table 2.1.1 Bulk Properties of Yttria
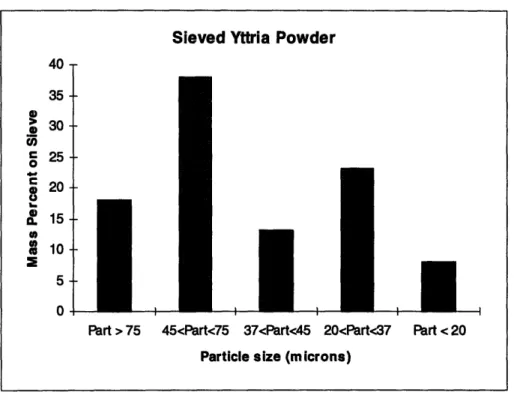
After receiving the powder, a particle distribution test was performed. It is important to know the exact particle distribution of the sample in order to classify and separate several size ranges for later printing experiments. It is also important to obtain a representative sample of the appropriate amount. In particle size analysis, we must recognize that sampling and handling may change the physical state of the sample. The technique used for separating the Yttria is called sieving. Sieving is the classification of particles in terms of their ability or inability to pass through an aperture of controlled size [Reed 1986]. The powder was introduced onto a stack of sieves with successfully finer apertures below, and the particles were agitated to induce translation until blocked by a smaller aperture. The finer sieved used was 20 pm., while the bigger one was 75 pm. The powder was dried before sieving, watching carefully not to contaminate it. The original sample contained a huge range of particle sizes; therefore different sizes were selected and separated for the several futures printing tests. The particle size distribution lies in a very wide range, it goes from particles below 20 pm up to particles bigger than 100 pm.. The Low-Risk Approach is not really concerned with how small the particles have to be
because there is no jetting involved. Nevertheless, it is important to determine the exact size of the particles that are being used for future tests. Figure 2.1.1 presents the particle size distribution.
Sieved Yttria Powder
4U -35 - 30-C o 25-o
20-I
1 5- 0-0-r 3 < P -<Part > 75 45<Part<75 37<Part<45 20<Part<37 Part <20 Particle size (microns)
Figure 2.1. 1 Distribution of powder particle size in the sample provided by Boeing
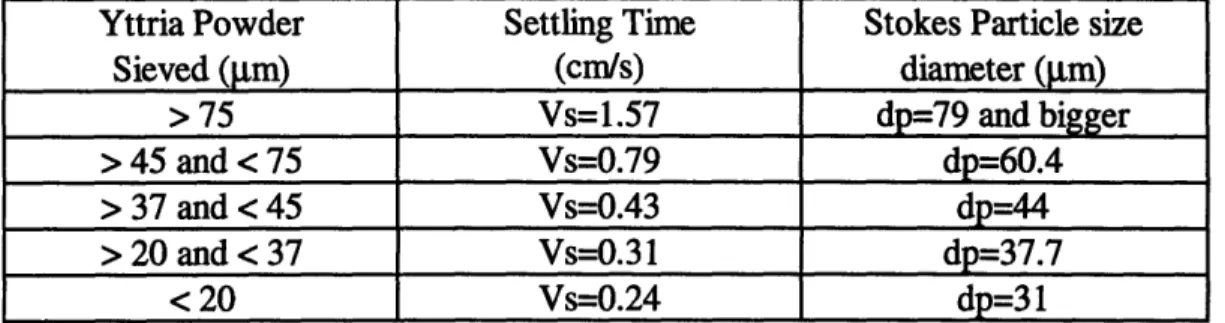
In order to confirm the results obtained from sieving, the Stokes sedimentation method was followed. This technique is based on a simple balance of forces concept, and after several algebraic steps we find the following expression for the settling velocity of the particle [Reed 1986]:
-4--
4--18
2
18
9t
pp is the density of the particle pf is the density of the fluid
d, is the diameter of the particle
yt is the viscosity of the fluid
The above formula works better for big particles. When smaller particle sizes are involved, Brownian motion plays a factor and disturbs the tests. The next table shows the
results obtained for the sedimentation technique using water as fluid, the experiments were made on a big graduated cylinder. In the cylinder, a distance of 80 mm was marked at the center of the cylinder. The container was then filled completely with water and sample of the specific powder was placed at the top of the cylinder. The particles traveled through the cylinder and across the known distance in a certain amount of time. The settling velocity was obtained by dividing the fixed distance by the time.
Yttria Powder Settling Time Stokes Particle size
Sieved (im)
(cm/s)
diameter (gim)
> 75 Vs= 1.57 dp=79 and bigger
> 45 and < 75 Vs=0.79 dp=60.4
> 37 and < 45 Vs=0.43 dp=44
> 20 and < 37 Vs=0.31 dp=37.7
< 20 Vs=0.24 dp=31
Table 2.1.2 Settling time for the particles in the powder sample provided by Boeing
The results confirm that the sieved powder is the size it should be, with the exception of the smaller particles.
Another form of finding out the particle size of certain sample is to use Microscopy. Scanning Electron Microscope (SEM) was used to observe different samples of powder. This technique shows the nominal size and shape of the particles. Also pictures can be taken at very high magnifications to observe atypical particles as well as finer details of the shape and surface characteristics. In order to use the SEM, dry powder must be mounted on a stub. Then, the sample is gold coated in a vacuum atmosphere prior to the SEM session.
Polaroid photographs were taken. In these photos we can corroborate the difference in particle size. At the same time we can look at the shape and the appearance of the particles. The shape of the particles is very irregular and the surface is seen to be rough. Figures 2.1.2-2.1.4 show these photos.
Picture 2.1.2
Unprocessed Yttria powder from the sample provided by Boeing.
Particle size range lies between 10 to 130
prm.
Figure 2.1.3
Particles between 20 and 37 microns from the sample provided
Figure 2.1.4 Particles below 20
microns from the sample provided by Boeing.
B. - Titanium Sheets: Several batches of titanium sheets were received along the course
of this research. The sheets were cleaned prior to any printing or processing. The cleaning process was made according to the BAC-5753 specification. Etching is used for removing minor surface contamination by submerging the sheets in a Nitric-Fluoride solution for a period of 45 to 90 seconds. Once the sheets are cleaned they can be handled normally with the use of cloth gloves. It's important not to contaminate them during printing. Boeing made all these cleaning procedures. When the sheets were contaminated, they were sent back for cleaning.
2.2 Characterization of the Ceramic Powder Obtained by MIT.
In order to obtain a material where the particle size was smaller and more homogeneous, other samples of yttria were obtained. Low-Risk printing experiments will determine the size of the particles to use in the High-Risk approach. From picture 2.1.1 we can see that only 8% of the original powder lies below 20 microns. This means that
92% of the material would be unusable for slurry printing. Ideally, the smaller size the better. It is part of this research to determine the minimum particle size that can be used, in either the High-Risk and Low-Risk approaches. The Low-Risk will help determine some of the particle size characteristics needed for the High-Risk.
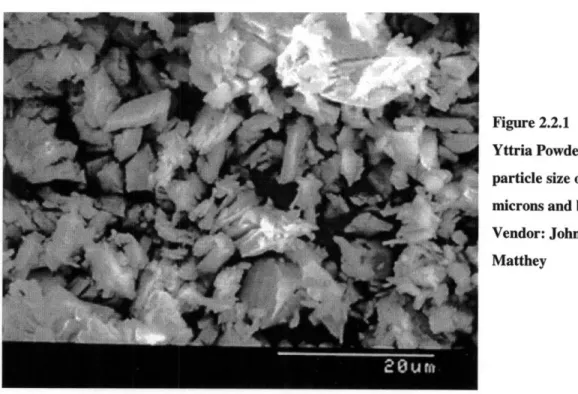
Yttria is available in several particle sizes and purity levels. The purity level used for these tests is 99.9%. Powder with particle size -20 microns and -10 microns were obtained for testing. The supplier of these powders is the Johnson Matthey Company located in Wardhill MA. The powder with particle size of 10 gtm and below is directly listed in the Company's catalog, while the powder with particle size -20 gtm has to be specially bought. The quote for the stock number can be found in Appendix D at the end of this document. The next 2 pictures show SEM photos of these samples.
Figure 2.2.1
Yttria Powder with particle size of 10 microns and below. Vendor: Johnson Matthey
Figure 2.2.2 Yttria Powder with
particle size below 20 microns.
Vendor: Johnson Matthey
This series of SEM photographs shows us the advantages of obtaining material, which has been previously classified and selected. Some of these benefits are that the sieving operation is eliminated and there is waste of ceramic powder. In conclusion, Boeing's yttria will be sieved for printing experiments with particles above 20 nm.; and for tests below that size the pre-selected commercial powder.
2.3 Packing and Apparent Densities
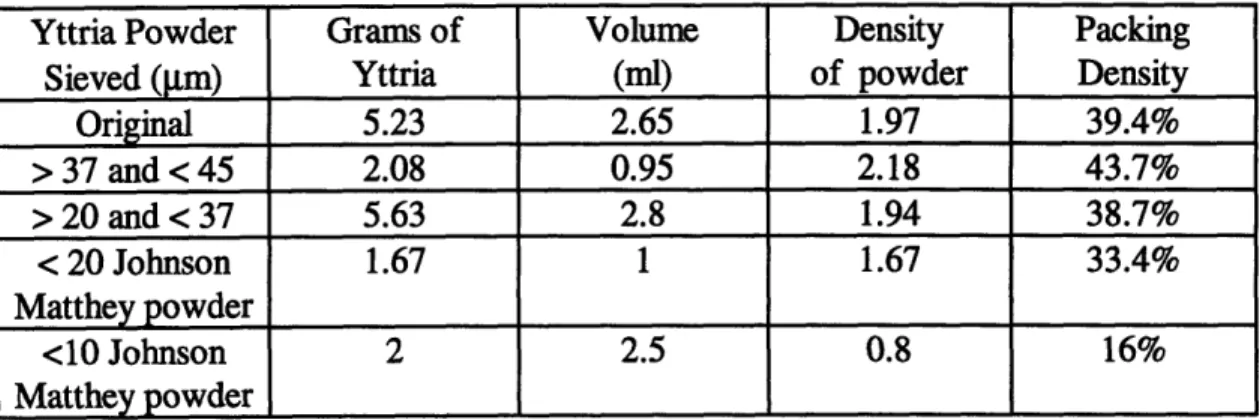
Packing and apparent densities of all the powders were studied. This was done by measuring the final volume of a certain amount of powder introduced into graduate cylinder. In the particular case of the packing density, the powder was mixed with water. After all the particles settled in the bottom, the mass was divided by the final volume. The results for the packing density experiments are presented in the next table.
Yttria Powder Grams of Volume Density Packing
Sieved (gm) Yttria (ml) of powder Density
Original 5.23 2.65 1.97 39.4% > 37 and < 45 2.08 0.95 2.18 43.7% > 20 and < 37 5.63 2.8 1.94 38.7% < 20 Johnson 1.67 1 1.67 33.4% Matthey powder <10 Johnson 2 2.5 0.8 16% Matthey powder
Table 2.3.1 Packing densities for the powders depicted in sections 2.1 and 2.2. These results clearly stated that the slurries were not dispersed. In other words particles arrange themselves in a way where many voids are left between them making the packing density very low. In addition, as the particle size got smaller the packing density also did because smaller particles tend to agglomerate more than bigger ones. The next figure illustrates this principle [Rahaman 1996].
(A) (B)
Figure 2.3.1 A. Stable dispersed suspension B. Flocculated suspension.
In the case of the apparent density the same operation is performed with the exception that no liquid is added. Again a certain mass of material is dropped into a graduated cylinder where a volume read is obtained and the apparent density is calculated.
In similitude with the packing density, the apparent density decreased with the particle size. Table 2.3.2 shows the apparent densities.
Yttria Powder Grams of Volume Density Apparent
Sieved (gm) Yttria (ml) of powder Density
Original 9.5 5 1.9 38% > 37 and < 45 9 5 1.8 36% > 20 and < 37 7.6 5 1.52 30% < 20 Johnson 7 5 1.4 27% Matthey powder <10 Johnson 4.4 5 0.88 17% Matthey powder
Table2.3.2 Apparent densities and Packing densities for the powders depicted in sections 2.1 and 2.2
2.4 Description of the Low Risk Printing Process.
As explained in chapter 1, this approach consists in printing binder on top of a sheet with ceramic powder. The idea is that the binder will dry and fix the powder onto the sheet only on the printed areas. The unprinted powder can then be easily removed with a blast of air. As indicated in the specifications in Appendix B, a nominal thickness of 0.003 in. is required so the amount of powder added should be controlled.
In order to achieve the desired layer thickness, a weight technique was used. This method consists of spreading powder with a sieve over a known area (3X5 card). Then, measure the weight of powder and using the packing density information from table 2.3.2, we can determine the thickness of the layer by calculating the volume.
Several printing tests were made in order to find the best printing sequence. Primarily, 3 ways of printing were explored using the Low-Risk approach. The first one and maybe the simplest, is to print binder on the titanium sheet using a 3D-Printing machine and the deposit a layer of powder. The second consists in spreading the correct layer and then print the binder on top. The third method spreads a very thin layer of powder followed by the printing of the binder and finally while the fluid is still wet, a final spread of powder. The advantage of method 1 is that no powder is introduced in the printing machine, but
unfortunately the binder flows before the powder comes into play making the edge definition very poor. Figure 2.4.1 shows this effect.
Figure 2.4.1
Detail of Sheet printed by Low-Risk Approach Using method 1 Particle size 20 gm and below
The second method has the disadvantage that the lines of powder shrink producing enormous defects in the printed areas. Figure 2.4.2 illustrates the effect.
Figure 2.4.2
Detail of Sheet printed by Low-Risk Approach Using method 2
Particle size 53 gim and below.
The third solves both problems by locking the fluid with a very small amount of powder and also avoiding shrinkage. After that a last powder deposition comes into place
covering all the defects and giving the pattern the desired thickness.
The steps to follow (Figure 2.4.3) in order to print a titanium sheet using the low risk approach are the following:
1.The first step is to spread the Yttria powder on to the titanium sheet using a sieve with 53 p.m mesh. In this part of the process it has been found that if too much powder is placed on the sheet, the acrysol will be very quickly absorbed producing severe warpage and a uneven distribution of the powder in the sheet. This shrinkage may be avoided by barely dusting the sheet in first place. In other words, after depositing this first layer the titanium should still be visible. It doesn't matter that the area is not completely covered with powder, although it is important to have a uniform dusting.
Step 1: Use a sieve to deposit a very thin layer of powder
Si
d tt•
air.
2. The second step is to take the sheet to the Alpha machine where the CAD
program should be ready as a 3DP file. The binder used in the machine was acrysol 25
Vol. %, while the flow rate was 0.85 cc/min. per jet. The nozzles used for printing were 47 microns. The sheet is then placed on the machine and the printing process starts. Once the machine finishes printing the layer it is very important to remove it quickly and go to step # 3.
3. In the third step we dust the sheet again but this time we add a lot of powder because the binder is still wet.
4. Finally the sheet is dried and the unprinted powder is removed. It is necessary to wait for at least 20 minutes before removing the loose Yttria. After the binder is completely dried, compressed air can be blown directly to the sheet in order to remove the excessive powder.
A total of 10 sheets were printed using the Low-Risk approach. The procedure used for printing all the sheets is the same as the one described previously. The binder used for all the tests was acrysol (25-weight %) with a flow rate of 0.85 cc/min. per jet. The 3D-Printing machine has a total of 8 jets printing at the same time.
Figures 2.4.4 through 2.4.7 show different sheets printed by the Low Risk Approach.
Figure 2.4.4 Detail of sheet printed with particles 53 pm and less from the sample provided by Boeing Method 3
Figure 2.4.5 Detail of sheet printed with particles 20 gim and less. Johnson Matthey Powder
Method 3
Figure 2.4.6 Detail of sheet printed with
particles 53 gm and
less from the sample provided by Boeing Method 3
Figure 2.4.7 Detail of sheet printed with
particles 53 gpm and
less from the sample provided by
Boeing Method 3
Figure 2.4.8 Entire sheet printed with
particles 53 gpm and
less from the sample provided by Boeing
Method 3
2.5 Description and Measurement of the Printed Titanium Sheets
After printing the sheet and cleaning it with air, the layer thickness was measured. An Olympus microscope model BH2 with magnification of 10X up tol00X was used. The depth of field of the microscope was less than two microns.
It is important to remark that the human eye comes into play introducing small errors. Any way, a very good feel of the thickness value can be obtained using this technique. Several measures were taken in different parts of the printed pattern. This was done to see the uniformity of the layer. Figure 2.4.1 show the 6 points that were selected.
E~J
I I
I /
[B. Left
I
B.Center
Figure 2.5.1 Thickness measurements Positions
In order to measure every point, the sheet was placed under a microscope and the procedure was the following:
* Place the light spot of the microscope over a zone that covers at the same time a printed and unprinted area.
* Focus the image on the bare titanium and make a measurement.
* Focus the image over the printed pattern trying to focus in point where most of the powder can be clearly seen. Take the second measure.
* Because of the scale of the focus knob is in Lm. the difference between both annotations will result in the actual thickness of the yttria layer.
The next table presents a description of the printed sheets specifying particle size, average thickness and extra comments.
Printed Sheets:
Sheet number: Particle size: Layer MIT Comments: Boeing
Thickness: Comments:
1 53 g.m and less 0.00316 in. Ok. Ok.
2 20 to 37 gtm 0.00268 in. Ok. Ok.
3 20 gmm and less 0.00284 in. Ok. Ok.
4 10 gmm and less 0.00271in. Bad looking Failed
A 53 g.m and less 0.00330 in. Ok. Ok.
B 20 gmm and less 0.00305 in. Ok. Ok.
Al 53 jLm and less 0.00318 in. Ok. Rectangles Ok. Added
B 1 20 jm and less 0.00330 in. Ok. Rect. (2 Ok. layers)
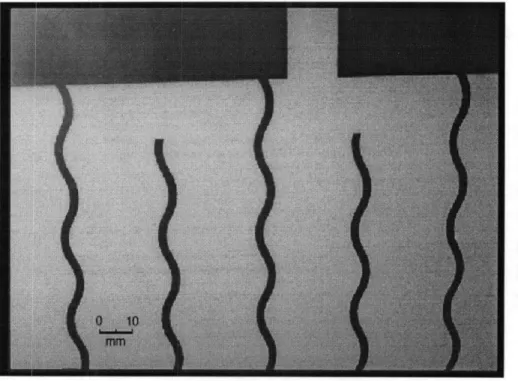
Double A 53 jim and less Not available Ok. Sinusoidal Ok.
Side 1 edges
Double A 53 jLm and less Not available Ok. Ok
Side 2
Double B 20 jim and less Not available Ok. Sinusoidal Ok.
Side 1 edges
Double B 20 jLm and less Not available Ok. Ok.
Side 2
Table 2.5.1 Characteristics of the printed sheets
The first 6 sheets have the same pattern. The next 2 have 2 rectangles added for easier post processing. The final 2 sheets have modified patterns and were printed on both sides. Due to this factor no thickness measurements were taken in order not to affect the printed patterns. The MIT comments refer to the appearance of the sheet, while the Boeing's comments refer basically to the good performance of the sheet in the actual post processing. The CAD drawings of the patterns can be seen in Appendix B.
2.6 Conclusions and Recommendations for the Low-Risk Approach
As we can see from the table, with the exception of 1 sheet all of the others met the expectations. Sheet # 4 was printed using powder presented in figure 2.2.1. The problem with this particular sheet was the fact that spreading a layer of very small powder presented serious problems. Particles join in such way that agglomerates form making it impossible to use a small sieve to spread it. On the other hand, the use of a bigger sieve to spread it will result in chunks falling down to the sheets.
In respect to particle size, the feedback received from Boeing determined that there was no problem in using the commercial powder with a particle size of -20 pm. Sheets 3, B, B 1, and Double B were printed using this powder. The rest of the sheets were printed using the original yttria with a particle size of 53gm and less. The best sheets manufactured by this approach were the ones that used bigger particle size. Spreading was very easily performed and very good layers of yttria were obtained.
In the future, if the Low-Risk approach is pursued, it is very clear that particles of 53 pm. and below give very good results and are easy to handle and spread. It is also clear, that the development of a better and more reliable spreading technique is required.
One possible solution to this problem is to place a sieve at about 1 or 1.5 meters above the sheets and then proceed to spread. This will make the powder to spread evenly throughout the titanium sheet because as the particles fall down they have more time to disperse throughout the whole printing area. Spreading tests were made with very successful results. Yttria of 53 pm and less spread perfectly. Particles of 20 tpm and less also spread much better using this technique. In the case of the -10 pm and less the results were not good due to the formation of agglomerates. Figure 2.5.1 depicts this spreading concept. The technique was not used because the sieve used for spreading was not big enough to cover the entire area where the pattern was printed. In the future, a special sieve could be constructed. This sieve would be the same in size as the area of the pattern to be printed.
Another idea can be the use a close volume on top of the sheets where a known amount of powder is placed. Then a series of fans can be introduced creating a cloud of
powder. Finally gravity will do the rest of the work depositing a good and even layer of Yttria. %Mth er 12 in ,ter 12 in About 1 meter Evenly
Spread
PovderFigure 2.6.1 Spreading powder form higher position
Other ideas can be implemented and studied, but this research effort will try to focus on the High-Risk approach, which is the subject of the next chapters.
Chapter 3: High-Risk Approach, Slurry Studies.
3.1 Introduction
As stated in section 1.2, one of the most important goals of this research is to print slurry based fluids with the current 3D-Printing technology. In this case, no powder has to be spread, and no feed piston is needed. The process will consist of directly depositing a layer of slurry in the titanium sheet. The concept of the "binder selectively joining powder" disappears. Instead, the binder and the powder are mixed together forming fluid with rheological behavior. This fluid or so-called slurry has to be jetted through a small nozzle and then selectively deposited on a titanium sheet. In principle, the smaller the nozzle the better, but many restrictions apply. The size of the particles is critical for these experiments. It is impossible to jet particles that are bigger than the nozzle, and it is very difficult to jet slurries with particles close in size to the nozzle diameter. The use of filters is essential but the most important factor of the process is to have completely dispersed slurry.
The dispersion process varies depending on the particles and the liquid media that are going to be used. Good dispersion is required to separate all the particles and prevent agglomeration. This helps enormously when jetting slurry because it assures that the particles will be completely separated in the liquid. In the particular case of this project, Yttria and water were the principal elements that formed the slurry. All the experiments done with the Low-Risk approach helped determine the minimum particle size that could be used in the High-Risk approach.
3.2 First Jetting Experiments of Yttria Slurries
The first jetting experiments done in this area consisted in mixing just water with 201Lm. and below Yttria powder. Several slurries with different volume fractions were tested. After a good mixing, the suspensions were rapidly jetted through several nozzles and needles. This jetting was done before any settling occurred, and in most of the cases
the syringes were shaken while jetting in order to avoid settling. In other cases the jetting was done in an upward position to prevent settling at the tip of the nozzle. The fundamental purpose of these experiments was to observe which volume fractions could be jetted through the different orifice sizes. Six nozzle diameters were used to jet the various slurries and the results are presented in the next table.
Table 3.2.1 First jetting experiments for Yttria slurries (Yttria and water) using the powder in the sample provided by Boeing
Particle size below 20 pm.
(XXX means not tried) (1 means jetting upwards)
Volume % 330gjm. 254 plm. 203 gm. 152 gm. 127 jm. 102 plm. 7.5 % XXX XXX XXX XXX Jets Jets shaking 10 % XXX XXX XXX XXX Jets Clogs shaking 12.5 % XXX XXX XXX XXX Jets Clogs Shaking
15 % Jets Jets Jets Jets Jets XXX
Shaking Shaking
20 % Jets Jets Jets Jets Clogs XXX
Shaking shaking T
25 % Jets Jets Jets Clogs XXX XXX
Shaking
30 % Jets Jets Jets XXX XXX XXX
Shaking
35 % Jets Jets Jets XXX XXX XXX
Shakingt
40 % Immediate Immediate XXX XXX XXX XXX
The results show that a concentration of more than 7.5 volume percentage will clog the 2 smallest nozzles, which are the most important ones. The bigger the nozzle size, the harder it would be to print. Therefore it is critical to find a way of jetting higher volume percentages through the smaller nozzles. Moreover, the higher volume fraction will deposit more ceramic material over the titanium sheet.
3.3 Development of Slurry Formulation
3.3.1 Dispersion Studies with pH and Steric Control
Attractive surface forces, generally referred to as the van der Waals forces, exist between all atoms and molecules regardless of any other forces that may be involved. They also exist in macroscopic bodies such as particles. These forces make particles agglomerate into bigger bodies, therefore it is necessary to find a way of dispersing them.
There are 3 ways for trying to disperse a solution [Rahaman 1996]:
1. Electrostatic stabilization: Consists in adjusting the pH of a solution to achieve electrical repelling. Particles can be deflocculated by creating mutually repelling charged double layers.
2. Steric or polymeric stabilization: In this method a substance is added to the slurry. The repulsion is produced by polymer molecules adsorbed (or chemically attached) onto the particles surfaces.
3. Electrosteric: This type of stabilization is a result of both electrostatic and steric repulsion.
Once the ceramic particles are suspended in the liquid, they will agglomerate. One of the methods described above should be used to disperse them. Following method 1, when modifying the pH of a slurry, repulsion between particles is achieved by electrostatic charges on the particles. An electrical double layer of charge is produced between the particles, and the repulsion occurs as a result of the interaction. The
measured potential associated with the electrical double layer is called the zeta potential [Rahaman 1996]. This potential is an important guide to the stability of a slurry. The pH at which the zeta potential is zero is termed the isoelectric point (IEP). Raising or lowering the pH from the IEP will increase the absolute value of the zeta potential, therefore electrical charging may stabilize slurries in polar liquids. The IEP of Yttria lies in the range of 6.5 to 7 pH, so in order to electrically disperse the slurry we have to modify the pH towards the acid part or basic part. The following diagram depicts how the zeta potential changes with the pH for Yttria slurry.
80 60 40 E 20 -20 -40 -60 -an
Figure 3.3.1 pH versus zeta potential for Yttria slurry
Test performed with slurry of 5-volume % and a particle size of -10 pm
Experiments were conducted using Yttria powder with particle size of 10 microns and less. Once slurry with this particle size could be dispersed the next step would be to use 20 pm. Several approaches have been followed based on the methods described above.
Slurries were prepared by combining the right amounts of liquid, powder and dispersant. Various mixing sequences were investigated in order to obtain the most
* Powder was added to mixtures of dispersant and water * Dispersant was added to mixtures of powder and fluid * Water was added to mixtures of powder and dispersant
After several experiments and research [Galla 1994], it was found that the first sequence is the most appropriate one, because the powder is slowly added to liquid avoiding the formation of big agglomerates. This method was the one used for preparing all of the slurries tested in this work.
The first slurry prepared was 20-volume fraction following the steric method. Fifty five ml of slurry were prepared and Darvan C was the surfactant used. The amount of Darvan added was 1.5% of the weight of the ceramic powder. The initial pH of the solution was 7.6. The slurry was placed on the ball mill in order to reach a complete dispersion. After 2 hours a paste was formed. The pH of the slurry was 10.4. The change in pH occurs because as the agglomerates break in the mill more powder comes in contact with the liquid causing the pH to change. Also Darvan C contains ammonia, which helped the increase in pH.
Several efforts were made to formulate slurry with a different pH. Again 20 volume percent slurry was prepared and the pH was set to 4 using a 2M solution of nitric acid. The slurry was then placed on the mill for 2 hours. After milling the pH measured was 6.8 and the appearance of the slurry was not good. Yttria seems to react with the acid when the last is added in large concentrations, making the pH of the slurry very hard to control. In fact, the pH stays low for some time and then it tends to go to the IEP. Other efforts were made using different concentrations of nitric acid (0.5 M, 1M) and the results were very similar to the ones obtained with a concentration of 2M.
New 20 volume fraction slurry was made with nitric acid without the addition of Darvan C. The amount of slurry prepared was 55 ml. The nitric acid was added in small quantities. Only 3-ml (2M) of nitric acid were used. After milling, it was found that the pH of the suspension lied around 9. The appearance of the slurry was good and for the first time fully liquid slurry was obtained.
Comparing the slurries with and without Darvan, we could see that the particles in the slurries without Darvan settled during the course of the day. In contrast, the slurries containing Darvan remained for days in the same pasty form.
With the exception of the last slurry prepared, The first set of slurries failed because they were not stable and after several hours thick pastes were formed. Also, jetting was not successful and no improvements were made in comparison to the first experiments. Darvan C was abandoned completely and the only dispersant agent used was nitric acid.
In the beginning, dispersions were made using nitric acid and -10 im powder. Later the -20 jm powder obtained from Johnson Matthey was utilized. Very small amounts of nitric acid in a 2M solution were used to disperse the slurries by modifying the pH. The important concept here is to control the pH of the slurry in some point between 8 and 9. The 20 volume fraction slurries were successfully jetted through 127 jtm nozzle.
It was then observed that the slurries did not adhere to the sheet after the vehicle was dried, therefore another formulation had to be developed. It is of fundamental importance that once the slurry is deposited in the titanium sheet, it will significantly adhere so post-processing operations could be performed. Any successful jetting is useless if no good contact between both materials is made.
Instead of using nitric acid, it was decided to use polyacrylic acid (PAA). This binder was chosen for several reasons. First, since it is an acid, it could be used as electrosteric dispersant. Second PAA it is a strong binder that it's available in different molecular weights, making it very easy to experiment. Finally it is soluble in water and is very easy to handle.
3.3.2 Poly Acrylic Acid
Because of the very poor adherence seen between the slurry and the sheets, some extra research had to be developed. PAA was used because it could perform 2 functions at the same time. These functions were dispersing and binding. Unfortunately, the binding function was very poor. Again the search for a new and better binding agent was imperative. In the beginning small concentrations of PAA were used. Then larger
amounts of binder were added. The viscosity of the liquid media of the slurry increased when the concentration of PAA grew.
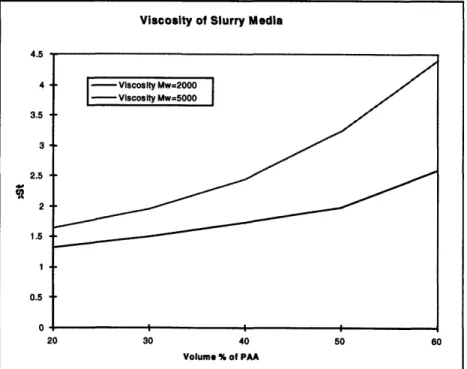
A viscosity graph was obtained for PAA Molecular weight 2000 and Molecular weight 5000. Figure 3.3.2 represents the viscosity of the liquid for a 20 volume fraction Yttria slurry varying from 20 up to 60 volume percent of PAA per ml of Yttria. This means that the amount of PAA added is a function of the amount of ceramic in the slurry. For example, to prepare 10 ml of liquid media for a 20 volume percent Yttria slurry with 20 volume fraction of PAA MW 2000 per ml of ceramic, we can the following:
For 10 ml of a 20 volume fraction Yttria slurry we have 2 ml of ceramic and the rest is liquid. The 8 ml remaining containing PAA and water are what we are considering the liquid media. To determine the amount of PAA to add, we simply multiply the volume of the ceramic powder by 20%, which is the concentration of binder per ml of ceramic. We can also use a mass relation. Finally we multiply the previous number by the weight fraction of the PAA 2000 (Density very close to 1 gr./cc). The remaining number is the amount of PAA in grams we have to add.
Viscosity of Slurry Media
4.5 4 3.5 3 2.5 0( 2 1.5 1 0.5 0 20 60 Volume % of PAA
Figure 3.3.2 Viscosity versus binder concentration for PAA MW 2000 and PAA MW 5000
40
20 60
We can clearly see that the viscosity or the PAA Mw 5000 is higher than the 2000, but neither binder has produce good results yet. All the different types of PAA were obtained from Aldrich Chemical Company.
Another important issue is fact that PAA dissolves in water. This means that if we add 10 cc of water and 10 cc of PAA we are not going to get 20 cc of mixture, so some tests were made to determine if the difference in volume was such that it would be important in the volume fraction calculations. An experiment was made to determine the importance of this effect. For 52 ml of a 15 Volume fraction Yttria slurry with 25% PAA 2000 (per ml of ceramic) we mix the following components:
-8 ml of Yttria (the powder will not be added for this experiment)
-3.25 ml of PAA 2000 (65 weight %) with density very close to 1 gr/cc
-41.5 ml of water
The mixture was poured into a graduate cylinder and a volume read was taken. The volume of the liquid containing water and binder was 44 ml. The theoretical volume for the liquid assuming PAA would not dissolve in water was 44.5 ml. From these results, we can conclude that is safe to assume that the volume of PAA can be added to the volume of water and the volume of powder.
It has been observed, that the adherence changes depending on the concentration of PAA and the milling process. For slurries using 20 percent PAA (2000, 5000) up to 35percent, some adherence to the sheets but not significant was observed before and after the milling process. For 40 volume percent and higher concentrations of binder results were better as the concentration increased. However for the same slurries, after milling, results were not so good and in fact poor. In addition, the jetting process is hardly affected as the concentration of the PAA increases. Furthermore, foaming became a big factor for high concentrations of PAA. As a rule to control foaming a single drop of Octanol was always added.
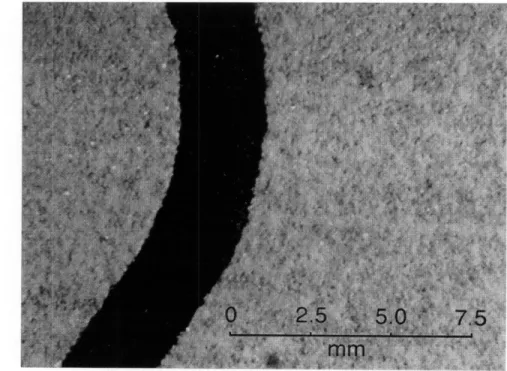
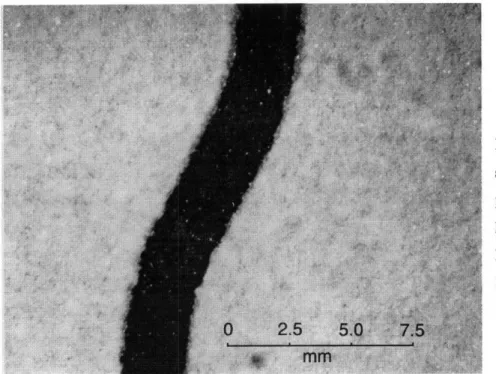
In the next photograph, we can see a 20 Volume %. Yttria slurry with 40 % PAA 2000 before milling. This slurry stuck quite well to the sheet, while the same slurry did not after having been milled. In the photo we can see that a film of binder was formed to the right of the Yttria. When this film formed, the process worked and the slurry adhered
Figure 3.3.3 20 Volume percent slurry with 40 volume percent of PAA
to the sheet. So other tests had to be made in order to determine why the milling process was affecting the adherence.
In order to find the correct amount of PAA to use and a possible explanation to the problem of the no adherence after milling, some calculations were made in order to estimate the thickness of the film of PAA covering the surface of the ceramic particles. If the layer of PAA forming around the particles was only a monolayer, it is possible that this layer might have undergone a chemical change due its proximity to the powder surface. If this was not to be the case, the layer would be thick and it would be unlikely for the entire layer to through a chemical change.
The area of a PAA molecule was calculated approximately. The calculation was done by using the atomic radius of the elements that compose a molecule, and also by estimating the lengths of the bonds between the different elements. For practical reasons
I; ::: : : :: :::: ::: -::1:: .:.-:.
:i--0
these lengths were considered as 1 A. Also, it was considered that the carbon has a tetrahedron arrangement in space so the molecule is not flat. We can see this calculation below along with the picture of a molecule, its chemical formula and the atomic diameters of Hydrogen, Oxygen and Carbon [Askeland 1985].
Element Atomic Radius Molecular Weight
Carbon 0.77 A 12
0.77 A
Oxygen 0.6 A 16
Hydrogen 0.46 A 1
Table 3.3.1 Characteristics of the elements composing PAA
Therefore the molecular weight of the monomer is 72 gr./mol, because the chemical formula of the PAA is:
[CH CH(COOH)]
-In the next picture we can see an arrangement similar to a PAA molecule, we can see the tetrahedron structure of Carbon.
Once we had the area of one molecule, we can estimate the area of a polymer chain. Therefore, by the amount of PAA (MW 2000) that we add we can see calculate the total area of a certain amount of PAA for a particular molecular weight. After making the calculations with the minimal area a molecule can occupy, the results say that there was enough PAA to cover at least 250 times the surface area of the Yttria. Thus, it seems that the layer of PAA is fairly thick and it is unlikely that a chemical reaction between the powder and the PAA is able to substantially alter the PAA.
In consequence, to see if the PAA will behave as acrysol did in the low risk method, a printing experiment using the low risk approach was used. A solution of PAA and water was prepared and jetted to a nozzle to a sheet dusted with Yttria. After that a second layer of powder was placed and after dried, the results were observed. The adherence of the powder to the sheet was good, but not as good as with acrysol. When printing in the Alpha machine 25 Vol. % acrysol was used, while the PAA solution used in this experiment was 7.6 Vol. %.
Another experiment done was to prepare a normal 20 Volume percent Yttria slurry with 20 Volume percent PAA and then mill it. The slurry was taken to the centrifuge, which separated the denser solids from the liquid and then extract the latter. After that the liquid was jetted to observe whether or not it would adhere to the sheet. In parallel a solution was prepared with the same characteristics as the one used in the slurry and jetted in the same way. After the experiment was concluded, the milled solution did not stick and was easily removed with a finger while the original stuck to the sheet.
Due to the lack of good results using PAA as a binder, the possibility of using acrysol in the slurry was studied. A 20 % acrysol by volume on 20 volume percent Yttria slurry was prepared with and the results were discouraging. Clogging was observed continuously and the slurry was clearly not well dispersed. Other combinations were tried without any good results. Therefore acrysol was abandoned as a binder to be used in the high-risk approach. Once again, the need to find a binder that would make the slurry adhere to the sheet was imperative, for this reason PEG (Polyethylene glycol) was the next polymer to explore.
3.3.3 Poly Acrylic Acid and Polyethylene Glycol
Following the same steps as before, different slurries were prepared starting with 20 volume percent of PEG (MW 20,000 Vendor Fluka) on 20 volume percent ceramic slurry. An eyedropper was used to spread some slurry onto a titanium sheet. After drying, the material presented some adherence to the sheet but the adherence was weak. The pH of the solution was very close to 8. The next step was to increase the amount of PEG, so solutions with 25, 30, 35 and 40 volume percents were prepared and spread onto titanium. The 35 and 40 percent slurries presented a strong bond with the sheet. In the same way, a significant amount of material was prepared in order to be milled and spread afterwards. The experiments were done and the slurry adhered reasonably well to the sheet. These results were encouraging but we still needed to jet the slurry through a 102 pm nozzle. The viscosity of the liquid media using PEG increases significantly as the volume percent goes up, therefore we couldn't use high concentrations of PEG.
Another very important issue is the fact that we still need an acid agent to disperse powder in the liquid. The PEG by itself doesn't create an acid media so it was impossible to jet through the nozzle. Because all the previous work done with PAA, and the fact that that doesn't affect the viscosity in a significant way when added low concentrations, PAA was chosen as the acid dispersant. Good results were immediately obtained with this combination. Several different slurries were prepared fixing the amount of PEG at 35% per ml of Yttria and varying the PAA from 10 to 30 volume percent of the ceramic.
A set of final expressions can be derived in order to calculate the amounts of PAA and PEG. In contrast with all the previous calculations, the amount of additives added will be related to the amount in grams of Yttria contained in the slurry. For a 7% PEG per gr. of Yttria (corresponds to a 35% PEG per ml of Yttria) and 5% PAA (corresponds to a 25% PAA per ml of Yttria) the expression is as follows:
PEGEgr] = Yttria[gr] *0.07
From the slurries prepared, it was found that the best dispersions are the
following:
For a 20 vol. % Yttria Slurry:
De-ionized Water 7 % PEG (Per gr. of ceramic) 6 % PAA (Per gr. of ceramic) 1 drop of Octanol to avoid foaming
Table 3.3.2Componensts for a 20 vol % slurry
For a 15 vol. % Yttria Slurry:
Table 3.3.3 Components for a 15 vol % slurry
Once the slurry was carefully prepared, it was placed on a nalgene bottle and milled for at least 5 hours. The milling media used were alumina balls of about 3/8 of an inch in diameter.
3.4 Jetting Setup, first continuous jetting experiments
Continuous jetting experiments were conducted with different slurries. These first experiments consisted on simply jetting fluid continuously. Filters, a pressurized vessel and a magnetic stirrer to keep the slurry in continuous movement were the equipment used. The pressures used were between 30 and 50 psi, and the filters sizes were 104 and
De-ionized Water 7 % PEG (Per gr. of ceramic)
5 % PAA (Per gr. of ceramic) 1 drop of Octanol to avoid foaming
74 gm for a 127 gm nozzle. For the case of a 102 gm nozzle the filters used were 88 and 60 pLm. Figure 3.4.1 depicts in a simplified way the arrangement to jet the slurries.
104 pm Filter
Pressure Vesselilter
Cw 1". Yttria Slurry heet Magnetic AgitatorFigure 3.4.1 Fluid system for jetting slurries.
Table 3.4.1 includes the most important slurries that were using -20 Rpm powder. We can see the volume concentration as well as the components of each particular case and the final results.