Direct measurement of the Raman enhancement factor
of rhodamine 6G on graphene under resonant excitation
The MIT Faculty has made this article openly available. Please share
how this access benefits you. Your story matters.
Citation
Deng, Shibin, Weigao Xu, Jinying Wang, Xi Ling, Juanxia Wu, Liming
Xie, Jing Kong, Mildred S. Dresselhaus, and Jin Zhang. “Direct
Measurement of the Raman Enhancement Factor of Rhodamine 6G
on Graphene Under Resonant Excitation.” Nano Research 7, no. 9
(July 17, 2014): 1271–1279.
As Published
http://dx.doi.org/10.1007/s12274-014-0490-3
Publisher
Tsinghua University Press
Version
Author's final manuscript
Citable link
http://hdl.handle.net/1721.1/105549
Terms of Use
Creative Commons Attribution-Noncommercial-Share Alike
Direct measurement of the Raman enhancement factor
of rhodamine 6G on graphene under resonant excitation
Shibin Deng1, Weigao Xu1, Jinying Wang1, Xi Ling2, Juanxia Wu1, Liming Xie3,Jing Kong2, Mildred S. Dresselhaus2,4,
and Jin Zhang1 ()
1 Center for Nanochemistry, Beijing National Laboratory for Molecular Sciences, Key Laboratory for the Physics and Chemistry of Nanodevices, State Key Laboratory for Structural Chemistry of Unstable and Stable Species, College of Chemistry and Molecular Engineering, Peking University, Beijing 100871, China
2 Department of Electrical Engineering and Computer Science, Massachusetts Institute of Technology, Cambridge, Massachusetts 02139, USA
3 Key Laboratory of Standardization and Measurement for Nanotechnology of Chinese Academy of Sciences, National Center for Nanoscience and Technology, Beijing 100190, China
4 Department of Physics, Massachusetts Institute of Technology, Cambridge, Massachusetts 02139, USA
Received: 3 February 2014 Revised: 28 April 2014 Accepted: 2 May 2014
© Tsinghua University Press and Springer-Verlag Berlin Heidelberg 2014
KEYWORDS
graphene, rhodamine 6G, Raman enhancement, polarization-difference resonance Raman spectroscopy, optical contrast spectroscopyABSTRACT
Graphene substrates have recently been found to generate Raman enhancement. Systematic studies using different Raman probes have been implemented, but one of the most commonly used Raman probes, rhodamine 6G (R6G), has yielded controversial results for the enhancement effect on graphene. Indeed, the Raman enhancement factor of R6G induced by graphene has never been measured directly under resonant excitation because of the presence of intense fluorescence backgrounds. In this study, a polarization-difference technique is used to suppress the fluorescence background by subtracting two spectra collected using different excitation laser polarizations. As a result, enhancement factors are obtained ranging between 1.7 and 5.6 for the four Raman modes of R6G at 611, 1,183, 1,361, and 1,647 cm–1 under resonant excitation by a 514.5 nm laser. By comparing
these results with the results obtained under non-resonant excitation (632.8 nm) and pre-resonant excitation (593 nm), the enhancement can be attributed to static chemical enhancement (CHEM) and tuning of the molecular resonance. Density functional theory simulations reveal that the orbital energies and densities for R6G are modified by graphene dots.
1 Introduction
In 2010, graphene was found to be a potential substrate
for Raman enhancement [1], called graphene-enhanced Raman scattering (GERS). Systematic studies of the dependence of the molecule–graphene distance [2], Address correspondence to jinzhang@pku.edu.cn
|www.editorialmanager.com/nare/default.asp
1272
Nano Res. 2014, 7(9): 1271–1279molecule orientation [3], electronic energy levels [4–5], graphene thickness [6], and the incident conditions [7], were then implemented, and the enhancement mechanism was attributed solely to a chemical mechanism (CM). However, one of the most commonly used Raman probes, rhodamine 6G (R6G), yielded confusing results about the Raman enhancement effect on grapheme [1, 8]. In an early study, Ling et al. [1] showed that R6G was one of the dyes whose Raman intensity could be enhanced when placed on graphene, but left the Raman enhancement factor of R6G unmeasured under the resonant excitation because of the presence of a strong fluorescence background. Conversely, Thrall et al. [8] reported a greater than three-fold decrease of the Raman signals of R6G on graphene after using a series of conversions. First, optical contrast spectroscopy was used in that study to determine the optical contrast of the R6G film, and the optical contrast was then converted into the film thickness with the dielectric constant of the thick R6G film [9]. Next, the film thickness was converted to the R6G surface concentration using the estimated molecule dimensions and packing method. In addition, when calculating the absolute Raman scattering cross- section of R6G on standard Raman equipment, the G-band of graphene served as an internal standard whose Raman scattering cross-section was obtained by converting from bulk graphite. Finally, the obtained absolute scattering cross-section of R6G was compared with the data determined in the report by the femtosecond stimulated Raman spectroscopy (FSRS) at 532 nm excitation [10], implementing a wavelength correction because the Raman measurement in their work was excited by a 514.5 nm laser. Therefore, the result that the Raman scattering cross-section of R6G on graphene decreases three-fold seems unconvincing. To clarify the controversy about the Raman enhan-cement effect of R6G on graphene, it is necessary to develop a method to directly measure the Raman enhancement factor of R6G.
To confirm the Raman enhancement factors of R6G on graphene, a direct measurement of the Raman spectra of R6G with and without graphene is needed. However, since the fluorescence cross-section of R6G (10–16 cm–2) [11] is much larger than its Raman cross-
section (10–22 cm–2) [10], a large fluorescence background
is the major obstacle in obtaining the intrinsic Raman spectra of R6G. This fluorescence background is not a problem for R6G on graphene because of the fluo-rescence suppression effect of graphene [11]. Among the several kinds of techniques developed to suppress the fluorescence background [11–13], FSRS [10] and polarization-difference resonance Raman spectroscopy (PD-RRS) [14] have so far been able to measure the resonance Raman (RR) spectra of R6G. The FSRS requires considerable experimental complexity and the spectral resolution is limited by the ultrashort laser pulse, but PD-RRS exhibits splendid adaptability for use with a standard Raman system and provides the same spectral resolution as the standard system. In the PD-RRS technique, a half-wave plate and a polarizer are added to the standard system. Two spectra, collected using different excitation laser polarizations, are subtracted to cancel out the fluorescence background, leaving only the Raman signal.
To make the measurement more accurate, the surface coverage of the R6G molecules must be kept to no more than a monolayer because the enhancement effect of the Raman scattering is usually distance-dependent [2, 15]. Therefore, it is necessary to quantify the thickness of the R6G film on the surface. Optical contrast spectroscopy is a commonly used technique for quantifying the thickness of thin films, and is also the method used in the work of Thrall et al. [8]. Briefly, the principle of the optical contrast spectroscopy is based on the optical contrast
f s R s R R R (1) where Rf and Rs are the reflectance of the sample and
the blank substrate, respectively. Here, R can be
related to the sample absorbance, A, using the index
of refraction of SiO2 as 1.46 [16]. The number of R6G
layers can be further estimated using the dielectric constant of the R6G film and the estimated thickness of the R6G monolayer [8].
In this study, the PD-RRS technique is used to measure the RR spectra of R6G, and the Raman enhancement factor for the 611 cm–1 mode is calculated
by comparing the Raman intensities of R6G on a SiO2
enhancement factors for the 1,183, 1,361, and 1,647 cm–1
modes are calculated using the Raman scattering cross-section of intrinsic R6G obtained by Shim et al. [10]. The results show that graphene can enhance the Raman signals of R6G with factors of 1.7–5.6 for the 611, 1,183, 1,361, and 1,647 cm–1 modes, when compared
with the Raman signals of R6G on SiO2 under the
resonant excitation (λex = 514.5 nm). Furthermore, the
dependence of the Raman enhancement factors using different excitations (λex = 514.5, 593, and 632.8 nm)
suggests that the mechanisms for the Raman enhan-cement of R6G are static chemical enhanenhan-cement (CHEM) and tuning of the molecular resonance.
2 Experimental
R6G from Sigma-Aldrich (product number R4127) was used directly as received. R6G was deposited on SiO2 by thermal evaporation, with the pressure during
evaporation held at ~4 10–4 Pa. The film thickness
was set to 2 Å, which was further determined by optical contrast spectroscopy for each sample.
Graphene was prepared using mechanical exfoliation of Kish graphite (Covalent Materials Corp.), and then was characterized by optical microscopy, Raman spectroscopy and optical contrast spectroscopy. The number of graphene layers (n < 4) on SiO2 was
deter-mined using the shape of the G'-band, but because the shape of the G'-band of graphene cannot remain constant after exposing the graphene to R6G, optical contrast spectroscopy was used to determine the number of graphene layers on R6G/SiO2. Because of
the inertia of SiO2, we still use the phrase “R6G on
graphene” when referring to the structure of graphene/ R6G/SiO2.
Raman spectroscopy was performed using a Horiba HR800 Raman system with a backscattering geometry. The 514.5 nm line from an Ar+ laser (Melles Griot model 543-AP-A01), the 632.8 nm line from a He–Ne laser and a 593 nm laser line were used in this work. A Leica 100× objective lens was used to focus the laser beam and collect the Raman signal, and the diameter of the laser spot was approximately 1 μm. The silicon 520.7 cm–1 peak was used for peak position calibration.
In the PD-RRS measurement, a polarizer was used to fix the detection polarization and a half-wave plate
was used to select the incoming polarization (parallel (∥) or perpendicular (⊥)). Because of the photo-bleaching effect [17], one sample point cannot provide enough signal-to-noise ratio (S/N) for R6G/SiO2 before
the photobleaching has obviously taken place. To get an adequate S/N, the spectra from a large number of points were averaged to create one spectrum. An XYZ stage was used to change the sample position. When the spectra of R6G/SiO2 under 514.5 nm laser excitation
was collected, mapping of a square area consisting of 200 × 200 points with a 2 μm step between each adjacent two points was used, and these spectra were averaged to get the final spectra for R6G/SiO2. The sample surface
was carefully adjusted to keep the same focus on the sample when moving the stage.
Optical contrast spectroscopy was performed using the same HR800 system, and a 100 W quartz–tungsten– halogen lamp was used as the light source. The light was concentrated at the sample surface and a pin hole (the same hole that was used as the confocal hole in the Raman measurement) was used to collect the reflected light coming from a 1 × 1 μm2 spot. Because
the laser light was aligned with respect to the same hole used in the Raman measurement, the optical contrast spectroscopy technique was able to sample the same spot with Raman measurement. A 400 nm long pass filter was used to avoid the higher-order diffraction of the grating in the experimental frequency range of 400–800 nm.
The energy of R6G and R6G on graphene nanodots was calculated using density functional theory (DFT) within the Gaussian 09 package. The hybrid functional M06L [18] with a basis set of 6-31G(d,p) was adopted.
3 Results and discussion
Figure 1(a) shows a schematic of the reference graphene sample on SiO2 and the Raman spectrum of the
graphene sheet that determines it to be a monolayer graphene. We use this sample for a dual purpose. First, the graphene reference is used to determine the sensitivity of the Raman measurement. Second, the optical contrast of this graphene/SiO2 in the optical
contrast spectroscopy measurement is subtracted from that of graphene/R6G/SiO2 to generate the optical
|www.editorialmanager.com/nare/default.asp
1274
Nano Res. 2014, 7(9): 1271–1279Figure 1(b) shows the optical contrast spectrum of R6G/SiO2. There is a strong peak at ~547 nm with a
vibronic shoulder on the high-energy side (see Fig. S1 in the Electronic Supplementary Material (ESM)). The thickness of the R6G can be calculated from the height of the main peak, and the number of R6G layers can be further deduced using the estimated layer thickness. The peak height in this figure implies that the film is nearly a monolayer (the peak height of a monolayer was calculated to be 5.8% in Ref. [8]). The surface concentration of R6G is not involved in the final result because its effect is canceled out when comparing the two samples (see the ESM for more information). The atomic force microscope (AFM) images (Fig. S6 in the ESM) show the R6G film is quite uniform.
In an effort to show the difference between the Raman signals of equal amounts of R6G with or without graphene present, graphene layers are tran-sferred to the surface of R6G by mechanical exfoliation (Fig. 1(c)). The amount of R6G under a flake of graphene will not change during this procedure, so two samples with the same R6G loading (one with and one without graphene) are used in the Raman signal comparison.
Because the optical contrast spectrum of graphene on SiO2 remains the same after exposure to R6G, i.e.
650–800 nm [8], the number of graphene layers can still be estimated without interference from the pre-sence of R6G layers. Monolayer graphene flakes are
chosen in this study (except for Fig. S7, in the ESM, which shows the relative Raman intensity of monolayer R6G covered by graphene of different thicknesses under 514.5 nm excitation). After subtracting the optical contrast contributed by the pristine graphene, the optical contrast difference spectrum of R6G with graphene is obtained (Fig. 1(c)). The results in Fig. 1(c) show that the main peak of R6G on graphene is around 562 nm, with a 15 nm redshift compared with that of R6G on SiO2 (547 nm), and a similar effect occurring
for the shoulder peak. Figure S1 (in the ESM) shows that the intensity ratio (integrated area) of the shoulder peak to the main peak decreases from 54% (R6G on SiO2) to 49% (R6G on graphene), which may be due
to a change in the aggregative condition of the R6G molecules [19]. Figure S2 (in the ESM) shows the contrast and contrast difference spectra for R6G of different thicknesses.
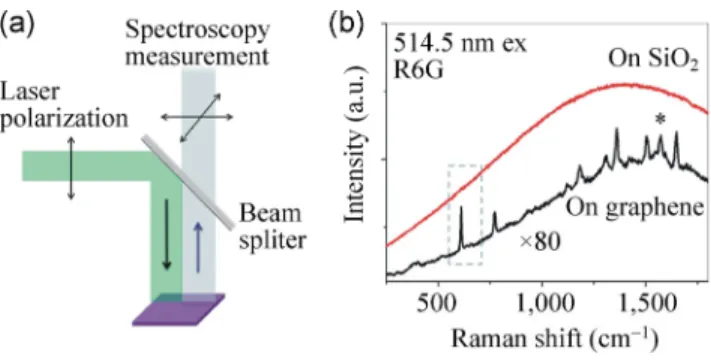
Figure 2(a) shows the normal setup of a Raman experiment, where a laser beam is introduced to the sample and the scatter light possessing different polarizations are all collected by the spectrometer. Figure 2(b) shows a typical resonance Raman spectra of R6G on SiO2 and on graphene collected by the
system in Fig. 2(a) (λex = 514.5 nm). Because of the
existence of fluorescence, we can only see a smooth and broad band in the spectrum, and the Raman peaks cannot be identified using this equipment even if the sample is fully photobleached to drain all the fluorescence and Raman signals. However, it is
Figure 1 (a) Schematic of monolayer graphene on SiO2 (top) and its Raman spectrum (bottom). The excitation wavelength is 514.5 nm. (b) Schematic of monolayer R6G on SiO2 (top) and its optical contrast spectrum (bottom). (c) Schematic of graphene on monolayer R6G
(top) and its optical contrast difference spectrum with the optical contrast of graphene subtracted(bottom). The green, yellow and red arrows in the spectra indicate 514.5, 593, and 632.8 nm respectively.
possible to quench the fluorescence of R6G significantly by placing it on graphene, with a quench factor of about 103 [11]. Because of this quenching, the Raman
signals for R6G on graphene can be easily identified. In order to obtain spectra with a high S/N, numerous spectra are taken at different positions with the assistance of an XYZ stage, and the spectra are then averaged. Nevertheless, the Raman peak for the R6G on SiO2 sample is still indistinguishable. Le Ru et al.
[14] indicated that the reason for this was the so-called “fixed-structure noise”, which originates from various causes such as the small difference between the detector pixels and the Fabry–Perot interference of the lenses in the light path. Strictly speaking, “fixed-structure noise” is not a true noise, because the same spectra can be consistently measured in a successive series of spectra. In principle, the reference light can be used in the measurement to cancel out the “fixed-structure noise”, though the part of the “fixed-structure noise” caused by the exact experimental configuration cannot be eliminated efficiently. Usually, when the fluorescence signal is 103 times stronger than the Raman signal,
the Raman signal cannot be identified because of the “fixed- structure noise” [20].
Le Ru et al. [14] suggested that PD-RRS could be used to overcome the “fixed-structure noise”. In this method, a parallel (perpendicular) incoming polarized laser serves as a reference light source, and a per-pendicular (parallel) incoming polarized laser serves as the measurement light source. Because of the different depolarization ratios of the fluorescence
Figure 2 (a) Normal setup of a Raman experiment. (b) The
typical resonance Raman spectra of R6G on SiO2 (red line) and
R6G on graphene (black line) collected on the setup in (a). The star (*) marks the position of the G-band of graphene, but it overlaps with the 1,570 cm–1 mode of R6G. All the other peaks
are from R6G. The excitation wavelength is 514.5 nm.
and the Raman signals, Raman spectra without the “fixed-structure noise” can be obtained by subtracting the two spectra to cancel out the fluorescence back-ground, leaving only Raman signals. Then, the absolute RR intensity, IR, is given by R R PDRRS R F 1 1 / I I (2) where the depolarization ratios of fluorescence ( F)
and Raman scattering ( R) should be known to
calculate the IR from the measured intensity, IPDRRS.
The measured intensity can be obtained by subtracting the Raman intensity under the ⊥-polarized laser excitation peak (I⊥) from that under the ∥-polarized
laser excitation peak (I∥). The integration time of I⊥
is 1 /F times that of I
∥. Figure S3 (in the ESM)
shows an example of the PD-RRS measurement. Figure 3(b) shows the intensity of the two incoming polarized beams collected for R6G molecules on SiO2,
where F= 0.83 in this example. It is not difficult to
predict the R value in most instances and, for the
case of R6G, = 1/3 [21]. R
For R6G on graphene, the “fixed-structure noise” is not a problem, and we obtain
R
I I⊥ I∥ (3)
The integration time of I⊥ equals that of I∥.
The effect of photobleaching cannot be ignored in this study, especially under a high excitation laser power. To estimate the influence of the photobleaching of R6G, time series mapping is performed (see Fig. S4 in the ESM). We find that the Raman intensity should be corrected with a factor of 1.11 ± 0.01 for R6G on SiO2 and 1.13 ± 0.01 for R6G on graphene.
With the G-band intensity of monolayer graphene as the external standard, an enhancement factor of 1.7 ± 0.2 (Fig. 3(d)) for R6G on graphene 611
R6G/graphene
(S /
2
611
R6G/SiO )
S is obtained for the 611 cm–1 Raman mode.
Because of limitations due to the S/N, other peaks of R6G on SiO2 are not so easily quantified, though they
can be identified. The enhancement factors for these other peaks can be further calculated using the Raman scattering cross-section of intrinsic R6G obtained by Shim et al. [10], who measured the Raman scattering cross-sections of R6G under the 532 nm excitation, as
|www.editorialmanager.com/nare/default.asp
1276
Nano Res. 2014, 7(9): 1271–1279well as the Raman excitation profiles (416–625 nm) of the vibrational modes of 604, 1,183, 1,361, and 1,647 cm–1. Taking the 1,647 cm–1 mode as an example,
they reported the Raman scattering cross-section for the 1,647 cm–1 mode to be 2.0 × 10⁻²³ cm2·molecule–1
under 532 nm laser excitation, and the Raman cross- section to be about 10% lower than that under 514.5 nm laser excitation. Meanwhile, the Raman scattering cross- section for 611 cm–1 mode was 4.1 × 10⁻²³ cm2·molecule–1
under 532 nm laser excitation, and about 5% lower than that found under 514.5 nm laser excitation. Thus,
2 2
1647 611
R6G/SiO / R6G/SiO
S S should be 0.51 under 514.5 nm
laser excitation. In this study, 1647 611
R6G/graphene/ R6G/graphene
S S
is measured to be 1.7. As we calculated above,
2
611 611
R6G/graphene / R6G/SiO
S S is also equal to 1.7, and the
enhancement factor for the 1,647 cm–1 mode,
1647 R6G/graphene / S 2 1647 R6G/SiO S , is therefore calculated to be 5.6 ± 1.1 (obtained by 1.7 × 1.7/0.51). Similarly, the enhance-ment factors for the 1,183 and 1,361 cm–1 modes are
calculated. The results for the various modes are listed in Table 1.
A positive correlation is found in Table 1 between the enhancement factor and the Raman shift, where the higher frequency vibrational modes have larger enhancement factors. The correlation can be explained by the detuning of the molecular resonance. The intrinsic R6G is in good resonance when excited by the 514.5 nm laser excitation. When the R6G molecule
Table 1 Raman enhancement factors for R6Ga. The excitation
wavelength is 514.5 nm Frequency
(cm–1) Enhancement factor Assignment [30]
611 1.7 ± 0.2 ip XRD, op XRD 1,183 3.8 ± 0.8 ip XRD, C-H bend, N-H bend 1,361 4.3 ± 0.9 XRS, ip C-H bend 1,647 5.6 ± 1.1 XRS, ip C-H bend
a ip: in plane. op: out of plane. XRD: xanthene ring deformation.
XRS: xanthene ring stretch.
Figure 3 (a) Experimental setup of the polarization-difference Raman experiment. (b) Fluorescence spectra obtained with both
polarization configurations (∥ and ⊥), from which the depolarization ratio, ρF, can be measured. (c) Resonance Raman spectra of R6G
on graphene obtained with both polarization configurations (∥ and ⊥). (d) Resonance Raman spectra of R6G on SiO2(black line) and
on graphene (red line) from the polarization-difference resonance Raman spectroscopy. The results show that graphene enhances the Raman signal of R6G under the resonant excitation (λex = 514.5 nm).
absorbs on graphene, the molecular absorption is detuned from the laser wavelength [8]. For the low frequency modes (such as 611 cm–1), the Raman
excitation profiles are sharp and the Raman signals decrease rapidly when detuned from the R6G molecular absorption frequency. However, the Raman excitation profiles are flatter for the high frequency modes (such as 1,647 cm–1), and the Raman signals
decrease slowly when detuned (and even increase in some circumstances) [10]. To rule out the effects caused by detuning, the normal Raman spectra excited by a 632.8 nm laser were collected (Fig. 4), which is far from the resonant conditions. To improve the S/N, the spectrum collected on SiO2 is the average of 25 × 25
spectra. These spectra show no apparent dependence between the enhancement factor and the Raman shift. In fact, enhancement factors of ~4 are calculated for all the quantifiable vibrational modes. As Jensen et al. [22] suggested, the enhancement factor under off-resonance excitation is a measure of CHEM enhancement, which is due to ground state chemical interactions between the molecule and active substrate. Unlike the charge transfer enhancement, CHEM enhancement is not limited to the resonant or off- resonant region because it is not associated with any excitations of the substrate-molecule system. Therefore,
Figure 4 The Raman spectra of R6G collected on SiO2 (red line) and on graphene (black line). The inset shows the enhancement factors for the different vibrational modes. For the spectrum collected on SiO2, 25 × 25 spectra were averaged to get the final
spectrum. The excitation wavelength is 632.8 nm. The star (*) marks the position of the G-band of graphene.
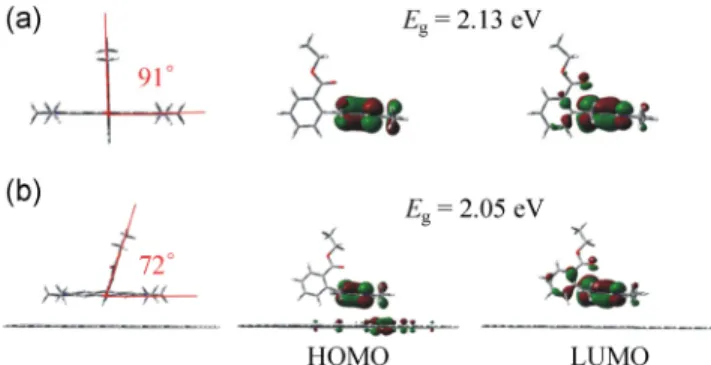
Figure 5 The orbital densities obtained from DFT for (a) an
isolated R6G molecule and (b) R6G/graphene.
we suggest two mechanisms for the Raman enhan-cement of R6G on graphene when excited under the resonance condition (λex = 514.5 nm). These two
mechanisms are the detuning from the molecular absorption resonant frequencies, and the CHEM mechanism, which is shared by the enhancement under 514.5 and 632.8 nm excitation.
The results found from the 593 nm excitation (Fig. S5, in the ESM) substantiate the dual mechanism hypothesis. The location of 593 nm is on the red side of the absorption peak of R6G and R6G/graphene and, according to the optical contrast spectra, R6G/ graphene shows better resonance than R6G at 593 nm. Although the S/N of the spectrum of R6G on SiO2 is
low, it is not hard to find that the enhancement factors of most Raman modes are higher than four, which reflects a double enhancement caused by better resonance (opposite to detuning) and CHEM.
To understand what causes the redshift of the optical peak of R6G on graphene, we calculate the geometry and energy of the two systems, R6G and R6G on graphene nanodots, using DFT. Consistent with previous studies [23], the phenyl group in R6G is nearly perpendicular to the xanthene rings. The energy gap between the highest occupied molecular orbital (HOMO) and the lowest unoccupied molecular orbital (LUMO) of R6G is 2.13 eV. The introduction of the graphene sheet reduces the dihedral angle between the phenyl group and xanthene rings in R6G to 72°, and the original energy gap of R6G is converted to 2.05 eV. Thus, the calculated shift of the energy gap is 0.08 eV, which agrees with the optical-contrast-peak shift of 0.06 eV. A clear interaction between graphene and R6G is observed from orbital analysis. According to Zhao’s work [24], the energy gap of R6G decreases
|www.editorialmanager.com/nare/default.asp
1278
Nano Res. 2014, 7(9): 1271–1279monotonically with the dihedral angle, which is consistent with our results. As mentioned above, the intensity ratio (optical contrast spectra) of the shoulder peak (attributed to the aggregate) to the main peak (attributed to the monomer) decreases from 54% (R6G on SiO2) to 49% (R6G on graphene) while the
resonance peak still redshifts, so aggregation is not the dominant reason for the resonance shift. Here, we attribute the redshift of the resonance peak to the interaction with graphene. Zhang et al. [25] obtained a similar conclusion to ours, namely that redshift of the resonance peak is due to interaction of R6G and graphene, although they attributed the resonance shift mainly to charge transfer.
We avoid several tedious conversions by making a comparison of the R6G Raman signals on both areas with and without graphene on one spectroscopy system: (1) Optical contrast spectroscopy is used only to roughly quantify the number of R6G layers. The surface molecular concentrations, which require many estimations and conversions, are not involved in the final result, and the number of R6G layers in the sample cancels out. (2) The G-band of graphene is used only as a reference, and any error caused by the standard value calculation is not involved in the final result. (3) The enhancement factor for the 611 cm–1
mode of R6G, from which the enhancement factors of other modes are calculated, is obtained without any excitation correction between the 532 and 514.5 nm laser excitations. (4) All of the optics measurements are carried out using the same spectroscopy instrument, which minimizes differences in the experimental conditions such as the lens geometric configuration and the sample position.
4 Conclusions
Using the PD-RRS technique to suppress the fluore-scence background, the Raman enhancement factors of R6G on graphene have been measured directly. The errors introduced by the molecule concentration, the G-band cross-section, excitation correction for 611 cm–1 mode, and by differences in experimental
equipment are eliminated in obtaining the final results. The dependence of the enhancement factors upon the excitation wavelength affirms the tuning mechanism reported by Thrall et al. [8] (but we attribute the tuning
to the interaction with graphene), which should be able to decrease the cross-sections in the case of R6G on graphene under the resonant excitation (λex =
514.5 nm). However, our results also show that all the cross-sections increase with enhancement factors of 1.7–5.6 for the modes at 611, 1,183, 1,361, and 1,647 cm–1,
emphasizing that this case exhibits two enhancement mechanisms (i.e., tuning of the molecular resonance and CHEM). In addition, the red side of the absorption peak displays even higher enhancement factors. The graphene-enhanced Raman scattering (GERS) has been found to be sensitive to several experimental conditions and the enhancement factor is case-dependent [26]. Our results suggest that there are two kinds of GERS mechanisms, and they are able to increase and decrease the Raman cross-sections, respectively. Since R6G is a widely used Raman probe, a deeper understanding of the interaction of R6G and graphene gives us the opportunity to collect more reliable signals when using SERS on a flat graphene surface [27], which is a method that promises to provide cleaner and more reproducible Raman signals. Direct measurement of the Raman enhancement factor can be applied to a larger class of GERS and other chemical mechanism- dominant Raman enhancement situations [28, 29], which may involve high fluorescence quantum yield dyes. Direct measurement of the Raman enhancement factor will also provide us with more capabilities to further explore the GERS effect and the graphene- covered SERS substrate.
Acknowledgements
This work was supported by NSFC (Nos. 21233001, 50972001, and 21129001), MOST (Nos. 2011YQ0301240201 and 2011CB932601), and Beijing Natural Science Foundation (No. 2132056).
Electronic Supplementary Material: Supplementary material is available in the online version of this article at http://dx.doi.org/10.1007/s12274-014-0490-3.
References
[1] Ling, X.; Xie, L. M.; Fang, Y.; Xu, H.; Zhang, H. L.; Kong, J.; Dresselhaus, M. S.; Zhang, J.; Liu, Z. F., Can graphene be used as a substrate for Raman enhancement? Nano Lett.
[2] Ling, X.; Zhang, J., First-layer effect in graphene-enhanced Raman scattering. Small 2010, 6, 2020–2025.
[3] Ling, X.; Wu, J.; Xu, W.; Zhang, J. Probing the effect of molecular orientation on the intensity of chemical enhanc-ement using graphene-enhanced Raman spectroscopy. Small
2012, 8, 1365–1372.
[4] Xu, H.; Chen, Y. B.; Xu, W. G.; Zhang, H. L.; Kong, J.; Dresselhaus, M. S.; Zhang, J. Modulating the charge-transfer enhancement in GERS using an electrical field under vacuum and an n/p-doping atmosphere. Small 2011, 7, 2945–2952. [5] Xu, H.; Xie, L. M.; Zhang, H. L.; Zhang, J. Effect of graphene
fermi level on the Raman scattering intensity of molecules on graphene. ACS Nano 2011, 5, 5338–5344.
[6] Ling, X.; Wu, J.; Xie, L.; Zhang, J. Graphene-thickness- dependent graphene-enhanced Raman scattering. J Phys.
Chem. C 2013, 117, 2369–2376.
[7] Ling, X.; Moura, L. G.; Pimenta, M. A.; Zhang, J. Charge- transfer mechanism in graphene-enhanced Raman scattering.
J. Phys. Chem. C 2012, 116, 25112–25118.
[8] Thrall, E. S.; Crowther, A. C.; Yu, Z.; Brus, L. E. R6G on graphene: High Raman detection sensitivity, yet decreased Raman cross-section. Nano Lett 2012, 12, 1571–1577. [9] Penzkofer, A.; Drotleff, E.; Holzer, W. Optical constants
measurement of single-layer thin films on transparent substrates. Opt. Commun. 1998, 158, 221–230.
[10] Shim, S.; Stuart, C. M.; Mathies, R. A. Resonance Raman cross-sections and vibronic analysis of rhodamine 6G from broadband stimulated Raman spectroscopy. ChemPhysChem
2008, 9, 697–699.
[11] Zhang, J.; Xie, L. M.; Ling, X.; Fang, Y.; Liu, Z. F. Graphene as a substrate to suppress fluorescence in resonance Raman spectroscopy. J. Am. Chem. Soc. 2009, 131 , 9890–9891. [12] Matousek, P.; Towrie, M.; Ma, C.; Kwok, W. M.; Phillips,
D.; Toner, W. T.; Parker, A. W. Fluorescence suppression in resonance Raman spectroscopy using a high-performance picosecond Kerr gate. J. Raman Spectrosc. 2001, 32, 983– 988.
[13] Volkmer, A. Vibrational imaging and microspectroscopies based on coherent anti-Stokes Raman scattering microscopy.
J. Phys. D-Appl. Phys. 2005, 38, R59–R81.
[14] Le Ru, E. C.; Schroeter, L. C.; Etchegoin, P. G. Direct measurement of resonance Raman spectra and cross sections by a polarization difference technique. Anal. Chem. 2012, 84, 5074–5079.
[15] Le Ru, E.; Etchegoin, P. Principles of Surface-Enhanced
Raman Spectroscopy and Related Plasmonic Effects; Elsevier
Science: Amsterdam, 2008.
[16] Palik, E. D. Handbook of Optical Constants of Solids: Index,
Vol. 3; Academic Press, 1998.
[17] Soper, S. A.; Nutter, H. L.; Keller, R. A.; Davis, L. M.; Shera, E. B. The photophysical constants of several fluorescent dyes pertaining to ultrasensitive fluorescence spectroscopy.
Photochem Photobiol 1993, 57, 972–977.
[18] Huang, C. S.; Kim, M.; Wong, B. M.; Safron, N. S.; Arnold, M. S.; Gopalan, P. Raman enhancement of a dipolar molecule on graphene. J Phys Chem C 2014, 118, 2077–2084. [19] Zhao, J.; Jensen, L.; Sung, J. H.; Zou, S. L.; Schatz, G. C.;
Van Duyne, R. P. Interaction of plasmon and molecular resonances for rhodamine 6G adsorbed on silver nanoparticles.
J. Am. Chem. Soc. 2007, 129, 7647–7656.
[20] Auguie, B.; Reigue, A.; Le Ru, E. C.; Etchegoin, P. G. Tiny peaks vs. mega backgrounds: A general spectroscopic method with applications in resonant Raman scattering and atmospheric absorptions. Anal. Chem. 2012, 84, 7938–7945. [21] Clark, R. J. H.; Dines, T. J. Resonance Raman-spectroscopy,
and its application to inorganic-chemistry. Angew. Chem.-Int.
Ed. 1986, 25, 131–158.
[22] Jensen, L.; Aikens, C. M.; Schatz, G. C. Electronic structure methods for studying surface-enhanced Raman scattering.
Chem. Soc. Rev. 2008, 37, 1061–1073.
[23] Thorn, D. L.; Fultz, W. C. Rhodamine complexes. Preparation, photophysical properties, and the structure of [Rh(rhodamine) (CO)(P(tol)3)2][SbF6]. J. Phys. Chem. 1989, 93, 1234–1243.
[24] Zhao, J.; Jensen, L.; Sung, J.; Zou, S.; Schatz, G. C.; Van Duyne, R. P. Interaction of plasmon and molecular resonances for rhodamine 6G adsorbed on silver nanoparticles. J. Am.
Chem. Soc. 2007, 129, 7647–7656.
[25] Zhang, X. F.; Liu, S. P.; Shao, X. N. Noncovalent binding of xanthene and phthalocyanine dyes with graphene sheets: The effect of the molecular structure revealed by a photophysical study. Spectrochim Acta A 2013, 113, 92–99.
[26] Xu, W.; Mao, N.; Zhang, J. Graphene: A platform for surface- enhanced Raman spectroscopy. Small 2013, 9, 1206–1224. [27] Xu, W. G.; Ling, X.; Xiao, J. Q.; Dresselhaus, M. S.; Kong,
J.; Xu, H. X.; Liu, Z. F.; Zhang, J. Surface enhanced Raman spectroscopy on a flat graphene surface. P. Natl. Acad. Sci.
USA 2012, 109, 9281–9286.
[28] Wang, X. T.; Shi, W. S.; She, G. W.; Mu, L. X. Using Si and Ge nanostructures as substrates for surface-enhanced Raman scattering based on photoinduced charge transfer mechanism. J. Am. Chem. Soc. 2011, 133, 16518–16523. [29] Yang, L. B.; Jiang, X.; Ruan, W. D.; Zhao, B.; Xu, W. Q.;
Lombardi, J. R. Observation of enhanced Raman scattering for molecules adsorbed on TiO2 nanoparticles: Charge-transfer
contribution. J. Phys. Chem. C 2008, 112, 20095–20098. [30] Jensen, L.; Schatz, G. C. Resonance Raman scattering of
rhodamine 6G as calculated using time-dependent density functional theory. J. Phys. Chem. A 2006, 110, 5973–5977.