HAL Id: hal-00829042
https://hal.archives-ouvertes.fr/hal-00829042
Submitted on 23 Apr 2015
HAL is a multi-disciplinary open access
archive for the deposit and dissemination of
sci-entific research documents, whether they are
pub-lished or not. The documents may come from
teaching and research institutions in France or
abroad, or from public or private research centers.
L’archive ouverte pluridisciplinaire HAL, est
destinée au dépôt et à la diffusion de documents
scientifiques de niveau recherche, publiés ou non,
émanant des établissements d’enseignement et de
recherche français ou étrangers, des laboratoires
publics ou privés.
Unprecedented observation of vertical redistribution of
water
Sergey Khaykin, I. Engel, H. Vömel, I. M. Formanyuk, R. Kivi, L. I.
Korshunov, M. Krämer, A. D. Lykov, S. Meier, T. Naebert, et al.
To cite this version:
Sergey Khaykin, I. Engel, H. Vömel, I. M. Formanyuk, R. Kivi, et al.. Arctic stratospheric dehydration
- Part 1: Unprecedented observation of vertical redistribution of water. Atmospheric Chemistry and
Physics, European Geosciences Union, 2013, 13 (22), pp.11503-11517. �10.5194/acp-13-11503-2013�.
�hal-00829042�
www.atmos-chem-phys.net/13/11503/2013/ doi:10.5194/acp-13-11503-2013
© Author(s) 2013. CC Attribution 3.0 License.
Atmospheric
Chemistry
and Physics
Arctic stratospheric dehydration – Part 1: Unprecedented
observation of vertical redistribution of water
S. M. Khaykin1,2, I. Engel3,6, H. Vömel4, I. M. Formanyuk1, R. Kivi5, L. I. Korshunov1, M. Krämer6, A. D. Lykov1,
S. Meier4, T. Naebert4, M. C. Pitts7, M. L. Santee8, N. Spelten6, F. G. Wienhold3, V. A. Yushkov1, and T. Peter3
1Central Aerological Observatory of Roshydromet, Dolgoprudny, Moscow Region, Russia 2LATMOS, CNRS-INSU, UMR8190, Université de Versailles St. Quentin, Guyancourt, France 3ETH Zurich, Institute for Atmospheric and Climate Science, Zurich, Switzerland
4DWD Meteorologisches Observatorium Lindenberg, Lindenberg, Germany 5Finnish Meteorological Institute, Arctic Research Centre, Sodankylä, Finland
6Forschungszentrum Jülich, Institute for Energy and Climate Research (IEK-7), Jülich, Germany 7NASA Langley Research Center, Hampton, Virginia, USA
8JPL/NASA, California Institute of Technology, Pasadena, California, USA
Correspondence to: S. M. Khaykin ([email protected])
Received: 10 May 2013 – Published in Atmos. Chem. Phys. Discuss.: 30 May 2013 Revised: 23 October 2013 – Accepted: 24 October 2013 – Published: 27 November 2013
Abstract. We present high-resolution measurements of wa-ter vapour, aerosols and clouds in the Arctic stratosphere in January and February 2010 carried out by in situ instru-mentation on balloon sondes and high-altitude aircraft com-bined with satellite observations. The measurements pro-vide unparalleled epro-vidence of dehydration and rehydration due to gravitational settling of ice particles. An extreme cooling of the Arctic stratospheric vortex during the sec-ond half of January 2010 resulted in a rare synoptic-scale outbreak of ice polar stratospheric clouds (PSCs) remotely detected by the lidar aboard the CALIPSO (Cloud-Aerosol Lidar and Infrared Pathfinder Satellite Observation) satel-lite. The widespread occurrence of ice clouds was followed by sedimentation and consequent sublimation of ice parti-cles, leading to vertical redistribution of water inside the vortex. A sequence of balloon and aircraft soundings with chilled mirror and Lyman- α hygrometers (Cryogenic Frost-point Hygrometer, CFH; Fast In Situ Stratospheric Hygrom-eter, FISH; Fluorescent Airborne Stratospheric HygromHygrom-eter, FLASH) and backscatter sondes (Compact Optical Backscat-ter Aerosol Detector, COBALD) conducted in January 2010 within the LAPBIAT (Lapland Atmosphere-Biosphere Facil-ity) and RECONCILE (Reconciliation of Essential Process Parameters for an Enhanced Predictability of Arctic Strato-spheric Ozone Loss and its Climate Interactions) campaigns
captured various phases of this phenomenon: ice formation, irreversible dehydration and rehydration. Consistent obser-vations of water vapour by these independent measurement techniques show clear signatures of irreversible dehydration of the vortex air by up to 1.6 ppmv in the 20–24 km alti-tude range and rehydration by up to 0.9 ppmv in a 1 km thick layer below. Comparison with space-borne Aura MLS (Mi-crowave Limb Sounder) water vapour observations allow the spatiotemporal evolution of dehydrated air masses within the Arctic vortex to be derived and upscaled.
1 Introduction
Water vapour in the polar stratosphere plays a significant role in ozone chemistry and is an important indicator of polar vor-tex dynamics. Water vapour within the stratospheric vorvor-tex is generally characterized by a gradual increase of mixing ra-tio with height, due to subsidence of air masses from higher altitudes (where water is produced by methane oxidation). Conversely, in the cold and stable Antarctic vortex, the water mixing ratio can be reduced to 1.5 ppmv (Vömel et al., 1995) as the water freezes into ice particles, sedimenting and sub-limating at lower altitudes, and thus causing an irreversible dehydration, i.e. removal of water from a certain air mass.
The same may apply to the other components in the particle phase, such as HNO3, which results in denitrification, an ef-fect that prolongs the time of ozone destruction via chlorine-induced catalytic cycles (Salawitch et al., 1993). Hence the gravitational settling of solid polar stratospheric cloud (PSC) particles may cause a dramatic change in the chemical com-position of the polar vortex, and subsequently also of the mid-latitude stratosphere (due to release of chemically per-turbed air from the vortex after its breakup).
Due to the persistent low temperature, formation of ice PSC and dehydration are large-scale climatological features in the Antarctic winter (e.g. Nedoluha et al., 2000; Stone et al., 2001). In contrast, the occurrence of ice clouds in the Arctic vortex is much less frequent or severe. In fact, local reductions of water vapour mixing ratios associated with ice formation have only been documented for sporadic events during the coldest winters in the Arctic stratosphere, namely 1988/89 (Fahey et al., 1990), 1994/95 (Ovarlez and Ovar-lez, 1994), 1995/96 (Vömel et al., 1997; Hintsa et al., 1998), 1996/97 (Pan et al., 2002), 1999/2000 (Schiller et al., 2002) and 2004/05 (Jimenez et al., 2006; Maturilli and Dörnbrack, 2006). The most severe episode of water depletion in the presence of ice PSCs in the Arctic has been reported by Vömel et al. (1997), whose balloon-borne water vapour mea-surements revealed a reduction in mixing ratio of 2 ppmv. Ex-cept the pioneering work of Fahey et al. (1990) and Vömel et al. (1997), all other above-mentioned authors link the ob-served dehydration episodes in the Arctic to mesoscale cool-ing events induced by orographic perturbations above moun-tains. Indeed, the majority of Arctic ice PSC observations are documented for Scandinavia (e.g. Kivi et al., 2001), where gravity waves with amplitudes large enough to reduce the temperature by several degrees below the ice frost point
(Tfrost)are frequently excited (e.g. Dörnbrack et al., 1999).
The wave-induced ice clouds are characterized by high num-ber densities (nice > 1 cm−3)of small (rice ∼1–1.5 µm) ice particles with a short lifetime and very slow sedimentation rate (e.g. Fueglistaler et al., 2003). Although it has been hy-pothesized that the sublimation of ice particles formed after a rapid cooling might be deferred by a coating of nitric acid tryhydrate (NAT) (Peter et al., 1994), laboratory work has lent only little support to this hypothesis (Biermann et al., 1998), so the dehydration potential of the short exposure of the air to highly localized mountain-wave ice clouds might be small. Indeed, the signatures of irreversible dehydration and rehydration as a consequence of growth and evaporation of sedimenting particles have not been documented for the Arctic so far.
Due to lack of in situ observations in the presence of PSCs, some uncertainties regarding the boundary conditions and the pathways of ice clouds formation still remain. While ho-mogeneous freezing of supercooled ternary solution (STS) particles has been the generally accepted formation pathway of ice PSCs, new results – mainly triggered by space-borne observations using the CALIPSO (Cloud-Aerosol Lidar and
Infrared Pathfinder Satellite Observation) satellite – suggest that heterogeneous nucleation plays a major role (Pitts et al., 2011; Engel et al., 2013a). Homogeneous nucleation of ice requires temperatures 3–4 K below the frost point, Tfrost (Koop et al., 1995). Heterogeneous formation pathways of ice have been discussed in the past; for example, the origi-nal three-stage model proposed by Drdla and Turco (1991), suggested homogenous nucleation of solid sulphuric acid hy-drates in the stratospheric aerosol droplets, which then serve as heterogeneous nuclei for NAT particles, which in turn serve as heterogeneous nuclei for ice. Still, there is little sup-port from field or laboratory studies favouring the formation of sulphuric acid hydrates. However, the idea of ice cles nucleating heterogeneously on pre-existing NAT parti-cles was brought up again by Pitts et al. (2011), who ob-served the increase in synoptic-scale ice PSCs concomitant with a decrease of NAT mixture clouds in January 2010. This process would imply that sedimenting ice particles not only dehydrate, but also denitrify the stratosphere due to the enclosed HNO3, a possibility discussed in most of the above-mentioned work. Khosrawi et al. (2011) also offered this as a possible explanation for the low HNO3recorded by ODIN/SMR during the 2009/10 Arctic winter. Non-volatile particles, observed in up to 80 % of the detected sub-micron particles in the Arctic vortex (von Hobe et al., 2013), could be another source of heterogeneous nuclei of NAT and ice, facil-itating their formation. Their origin is still unclear and might be, for example, meteoritic or anthropogenic. Recent studies by Hoyle et al. (2013) and Engel et al. (2013a) highlight the importance of this pathway for NAT and ice nucleation. Ob-viously, the verification and correct parameterization of the heterogeneous ice formation requires accurate in situ mea-surements in the presence of ice PSCs, which have been not available until now.
The high-quality in situ observations presented here, in-cluding those acquired during the very process of ice PSC formation, provide a reference for representation of ice cloud formation in microphysical models. A microphysical mod-elling study making use of these observations is presented in the companion paper (Engel et al., 2013b) and relates the question of ice formation pathways and concurrent dehydra-tion to the observadehydra-tions described here.
The Arctic winter 2009/2010 was characterized by ex-tremely low temperatures encountered in the vortex during the second half of January 2010. These conditions, unusual for the Arctic stratosphere, led to a major outbreak of ice PSCs detected by the CALIPSO space-borne lidar (Pitts et al., 2011). Extreme temperatures and ice clouds persisted on a synoptic scale from 15 through 21 January, causing – as concluded in this study – significant vertical redistribution of water within the stratospheric vortex. The extensive air-craft and balloon measurements conducted across Northern Scandinavia from January to March 2010 were accompa-nied by space-borne observations, opening the way for a de-tailed investigation of this rare phenomenon. The evolution
of dehydration and rehydration, and its amplitude and verti-cal extent, are inferred from a sequence of balloon and satel-lite water vapour observations. The source region of dehydra-tion and its spatial development are identified using satellite water vapour maps.
The paper is organized as follows: Sect. 2 gives a de-tailed description of experimental set-up and instrumenta-tion used. Secinstrumenta-tion 3 discusses the meteorological condiinstrumenta-tions in the stratosphere during January 2010, presents the obser-vational results, and identifies the source region and spa-tiotemporal evolution of dehydration. Section 4 concludes the paper. A comprehensive trajectory-based microphysical modelling study, connecting the individual balloon-borne ob-servations, is provided in the companion paper by Engel et al. (2013b).
2 Experimental setup and instrumentation
During the winter 2009/10 a number of extensive measure-ment activities were carried out in the Arctic stratosphere. Our study makes use of a series of balloon, aircraft, and satellite observations of water vapour and aerosol backscat-ter obtained using various measurement platforms and tech-niques. The water vapour measurements were provided by the balloon-borne CFH (Cryogenic Frostpoint Hygrometer) and FLASH-B (Fluorescence Lyman- α Stratospheric Hy-grometer for Balloons) sondes, the aircraft-borne FISH (Fast In Situ Stratospheric Hygrometer) and FLASH-A (Fluores-cent Lyman- α Stratospheric Hygrometer for Aircraft) or “FLASH-A” and “FLASH-B” hygrometers and the space-borne Aura MLS (Microwave Limb Sounder) instrument, while backscatter measurements were provided by balloon-borne COBALD (Compact Optical Backscatter Aerosol De-tector) aerosol sondes and the CALIPSO lidar. The bal-loon and aircraft measurements are courtesy of LAPBIAT-II (Lapland Atmosphere-Biosphere Facility) and RECONCILE (Reconciliation of Essential Process Parameters for an En-hanced Predictability of Arctic Stratospheric Ozone Loss and its Climate Interactions) field campaigns, respectively, both of which were carried out in the Arctic from January–March 2010.
2.1 Balloon soundings
The balloon-borne measurements of water vapour, tempera-ture and particles were obtained within the LAPBIAT-II at-mospheric sounding campaign carried out in Sodankylä, Fin-land (67.4◦N, 26.6◦E) under the auspices of the Finnish Me-teorological Institute Arctic Research Centre (FMI-ARC). The majority of the balloon flights was conducted in close timing with deployments of the stratospheric research air-craft M55-Geophysica, operating from Kiruna, Sweden, 360 km west of Sodankylä. The balloon soundings were implemented in two phases, with 18 launches during 17
January–6 February 2010 (see Table 1) and 15 launches dur-ing 10–24 March 2010. Altogether 172 individual balloon in-struments were flown during the campaign (Kivi et al., 2010). The analysis of this study is restricted to the data obtained within the first deployment phase, corresponding to the pe-riod of coldest stratospheric temperatures.
Table 1 provides an overview of the balloon-borne mea-surements of stratospheric water vapour and backscatter con-ducted during LAPBIAT-II. Two types of hygrometers were used: CFH and FLASH-B. For aerosol and cloud mea-surements, the balloons were equipped with a COBALD backscatter sonde. During the first phase of LAPBIAT-II, the CFH instrument was part of 15 payloads, 11 of which also included the COBALD backscatter sonde, 4 of which included FLASH-B sondes and 2 of which included, in ad-dition to COBALD, the backscatter sonde of the University of Wyoming (Rosen and Kjome, 1991), denoted by “BKS” in Table 1. All payloads were suspended 50 m below the loon using an unwinder device in order to minimize the bal-loon outgassing effect. Temperature and pressure in all flights were measured using the Vaisala RS-92 radiosonde. The al-titude used in this study is that of the GPS and the potential temperature is that calculated from pressure and temperature provided by the Vaisala RS-92 radiosonde.
2.1.1 Cryogenic Frostpoint Hygrometer (CFH)
CFH has been developed at the University of Colorado (Vömel et al., 2007a). It is a small lightweight balloon-borne hygrometer, based on the chilled mirror technique. Like many chilled mirror instruments, CFH is not calibrated for water vapour, but is considered an absolute reference for water vapour measurements. It measures the temperature at which an ice layer is in equilibrium with the gas phase of water passing over this ice layer. The largest source of uncer-tainty in CFH water vapour measurements is the stability of the feedback controller, which maintains the constant frost layer on the mirror. In most cases the feedback controller will lead to slight oscillations around the true frost point, which may have an amplitude of somewhere between 0.1◦C (for well stabled instruments) and 1.0◦C (for slightly unsta-ble instruments). The total uncertainty in frost point is better than 0.5 K throughout the entire profile (Vömel et al., 2007a), which translates to a mixing ratio uncertainty of about 10 % in the lower and middle stratosphere. The only limitations are measurements inside liquid clouds, which may disable the in-strument due to wetting of the detector lens, and contamina-tion at altitudes above 26–27 km during the ascent leg due to outgassing from the balloon or any other surface of the flight train. The data processing includes a step with the aim of screening out these artefacts and, if necessary, applying run-ning average over 40 s interval. The quality of descent mea-surements by CFH can deteriorate because of the controller’s inability to properly respond to the changes in water vapour
Table 1. Listing of water vapour and aerosol soundings conducted during the first phase of the LAPBIAT-II campaign, January/February
2010, Sodankylä, Finland. The soundings which did not provide useful data in the stratosphere due to technical issues are not listed. From left to right: date and time of the balloon launch; hygrometer type used (FLB=FLASH-B); backscatter sonde used (BKS = Wyoming backscatter sonde); indicator of ice occurrence (I), STS or NAT/liquid mixture clouds (M), dehydration (D) or rehydration (R) signatures (identified as deviation of the vertical profiles from the 10 yr January mean profile); maximum amplitude of dehydration or rehydration signal, negative or positive, respectively (in ppmv). All soundings included ECC ozone sondes.
Date Time Hygrometer Backscatter Indicator Amplitude
(UTC) sonde (ppmv) 17.01.2010 19:47 CFH, FLB COBALD I, D −1.3 20.01.2010 15:25 CFH COBALD M 21.01.2010 09:26 CFH D, R −0.7/+0.6 22.01.2010 04:18 CFH COBALD D, M −0.6 22.01.2010 19:08 CFH COBALD, BKS D, M −1.0 23.01.2010 17:30 CFH COBALD, BKS D, R, M −1.6/+0.9 25.01.2010 00:00 CFH, FLB COBALD D, R −0.8/+0.6 25.01.2010 18:13 CFH COBALD D, M −0.8 28.01.2010 16:44 CFH, FLB COBALD D, R −0.7/+0.5 29.01.2010 17:12 CFH, FLB COBALD D −0.8 02.02.2010 12:27 CFH 03.02.2010 20:11 CFH COBALD D, R −0.5/+0.4 06.02.2010 17:15 CFH COBALD D −0.3
at high vertical speed reaching 60 m s−1in the stratosphere. Therefore only ascent measurements are used in this study.
2.1.2 Fluorescence Lyman– α Stratospheric
Hygrometer (FLASH-B)
The balloon version of FLASH is a compact lightweight sonde developed at the Central Aerological Observatory, Russia, for balloon-borne water vapour measurements in the upper troposphere and stratosphere (Yushkov et al., 1998). The instrument is based on the fluorescent method (Kley and Stone, 1978; Bertaux and Delannoy, 1978), which uses the photodissociation of H2O molecules exposed to vacuum ul-traviolet radiation (λ < 137 nm) followed by the measure-ment of the fluorescence of excited OH radicals using a Hamamatsu photomultiplier. The intensity of the fluorescent light sensed by the photomultiplier is directly proportional to the water vapour mixing ratio under stratospheric condi-tions (10–150 hPa). The H2O measurement range is limited to pressures lower than 300–400 hPa due to strong Lyman- α absorption in the lower troposphere. The instrument uses an open optical layout design, where the analysed volume is lo-cated outside the instrument, which allows a reduction in the size of the instrument to a small sonde with a total weight of about 1 kg including batteries. This arrangement restricts the use of the instrument to night-time only.
Each FLASH-B instrument is calibrated in the laboratory against a reference dew point hygrometer, MBW 373 L. A description of the procedure can be found in Vömel et al. (2007b). The detection limit for a 4 s integration time at stratospheric conditions is of the order of 0.1 ppmv, while the accuracy is limited by the calibration error, which amounts
to 4 %. The typical precision in the stratosphere is 5–6 %, whereas the total uncertainty is less than 10 %. While the minimum response time of the FLASH-B is 0.2 s, here we use the data averaged over 4 s, resulting in a vertical resolu-tion of 20 m during ascent and 100 m during the fast descent (15 m s−1 around the tropopause) in the stratosphere. The flight configuration of FLASH-B, in which the analysed vol-ume is located beneath the downward-looking optics 2–3 cm away from the lens, caused noticeable self-contamination due to water outgassing from the instrument and possibly also from other equipment and the balloon above about 70 hPa during the ascent. By contrast, the FLASH-B mea-surements during the fast descent at the bottom of the flight train in undisturbed air are contamination-free as shown by the drop of water vapour readings immediately after the burst of balloon. Accordingly, only descent data are used in this study.
Intercomparison of the stratospheric water vapour mea-surements by FLASH-B and by CFH used in this study (Ta-ble 1) show a mean difference between the profiles above 14 km of 0.78 % (with 1σ standard deviation of 4 % and good consistency in reproducing vertical structures. Addi-tional information on the intercomparison is provided in sup-plementary material. Excellent agreement between the water vapour profiles obtained using two different techniques sug-gests high quality of the measurements and allows for using FLASH-B and CFH measurements as coherent data series.
2.1.3 Compact Optical Backscatter Aerosol Detector (COBALD)
COBALD was developed at ETH Zurich as a successor to the Wyoming backscatter sonde of Rosen and Kjome (1991). With a total weight of approximately 550 g including bat-teries, the instrument can be flown on operational weather balloons and thus facilitates practical application. COBALD measures molecular, aerosol and cloud particle backscatter in the atmosphere from the ground to the level of balloon burst. Two LEDs with 250 mW optical power each emit light at wavelengths of 455 and 870 nm. To register the backscat-tered light, a photodiode is placed between the LEDs, and the associated optics establishes an overlap region at distances larger than 0.5 m in front of the instrument. So far, the instru-ment is designed for applications during night-time only, as solar radiation saturates the detector.
Backscatter by molecules and aerosols contributes to the measured signal, whose separation is achieved following Rosen and Kjome (1991). The molecular number density is determined from temperature and pressure recorded simul-taneously by the hosting radiosonde. Together with certain conservative assumptions about aerosol loading in regions of clean air, the normalization of the backscatter signal yields the backscatter ratio (BSR) defined as the ratio of the to-tal – aerosol and molecular – backscatter to molecular sig-nal. Analogously to the BSR the aerosol backscatter ratio is ABSR = BSR – 1. The two different wavelengths allow definition of the colour index (CI) as the ratio of the ABSR at 870 nm divided by the ABSR at 455 nm. Information on particle size can be obtained from the CI is subject to cer-tain assumptions about particle size distribution, shape and refractive index. For the COBALD wavelengths, the range of CI varies from the Rayleigh limit of 1 (for very small parti-cles) up to approximately 14 (for large particles in the geo-metric limit, with a radius of approximately around 2 µm). It should be noted that it is possible for the CI to significantly exceed 14 before reaching large particle values, because scat-tering functions oscillate about the asymptotic limit. These Mie oscillations cause ambiguity and thus inhibit distinct ra-dius information for certain sizes. Stratospheric background aerosols are known to be characterized by a CI of 5 (Rosen and Kjome, 1991).
Usage of the Wyoming backscatter sonde has ranged from observations of volcanic aerosol (Rosen et al., 1992) over cir-rus (e.g. Beyerle et al., 2001) to polar stratospheric clouds (e.g. Larsen et al., 2004). The new COBALD sonde has started to be applied in various field studies (e.g. Bukowiecki et al., 2011; Brabec et al., 2012). The COBALD BSR pro-files used here are binned to 1 hPa pressure intervals to re-duce measurement noise, which typically increases in the stratosphere.
2.2 M55-Geophysica aircraft measurements
In the frame of the European research project RECON-CILE, an intensive field campaign of coordinated aircraft, balloon and ground-based measurements related to ozone chemistry and PSCs, was conducted during January–March 2010 (von Hobe et al., 2012). The Russian high-altitude air-craft M55-Geophysica was deployed in Kiruna, Sweden and conducted 12 research flights carrying over 20 in situ and remote instruments for the measurement of gaseous and par-ticle constituents. In accordance with the balloon soundings in Sodankylä, the aircraft campaign was implemented in two phases.
The in situ water vapour instruments operating onboard the M55-Geophysica aircraft are FISH and FLASH-A – both closed-cell hygrometers that use the fluorescent method for measuring water vapour in the upper troposphere and lower stratosphere with 1 Hz sampling frequency. The Fast In-situ Stratospheric Hygrometer (FISH) is equipped with a forward-facing inlet and thus measures total water, i.e. the sum of gas-phase water and ice particles. The description and the calibration procedure of the FISH instrument have been documented by Zöger et al. (1999) and Schiller et al. (2008). Mixing ratios of H2O between 0.5 and 1000 ppmv can be de-tected by FISH with a time resolution of 1 s and an overall accuracy of 6 %. FISH was calibrated regularly before and after every flight during the aircraft campaign using a cali-bration bench that included a frost point hygrometer (MBW DP30) as a reference.
FLASH-A (Fluorescent Lyman- α Stratospheric Hygrom-eter for Aircraft) is a recent modification of the FLASH in-strument (Sitnikov et al., 2007) previously utilized onboard the M55-Geophysica aircraft. FLASH-A has a rear-facing in-let for the measurement of gas-phase water vapour in the al-titude range between 7 and 20 km, with the upper limit be-ing the aircraft ceilbe-ing altitude. Its total measurement un-certainty amounts to 10 % for a 6 s integration time with a detection limit of 0.2 ppmv. During the RECONCILE cam-paign, FLASH-A was calibrated after every third flight us-ing the FISH calibration bench. The signal-to-noise ratio of the FLASH-A instrument is lower than that of FISH for 1 s resolution data, therefore we use 6 s averaged data in this study. The point-by-point comparison between FLASH-A and FISH stratospheric cloud-free data acquired during the RECONCILE flights showed a mean relative difference of 2.7 % (with 1σ standard deviation of 3 %), which is well within the uncertainty limits of both hygrometers. The de-tails of airborne hygrometers intercomparison are provided in supplementary material.
2.3 Microwave Limb Sounder (MLS)
The MLS instrument operating onboard Aura satellite was launched in July 2004 as a part of the NASA/ESA “A-Train” satellite constellation. MLS is a limb-sounding instrument
that measures the thermal emission at millimetre and sub-millimetre wavelengths using seven radiometers to cover five broad spectral regions (Waters et al., 2006). Measurements are performed from the surface to 90 km with global lati-tude coverage from 82◦S to 82◦N each day. Here we use the version v3.3 described by Livesey et al. (2011), who reports for the middle stratosphere with a vertical resolution of 3.1– 3.3 km, a horizontal resolution of 220–300 km, an accuracy of 7–9 % and a precision of 6 %. The data screening criteria specified by Livesey et al. (2011) have been applied to the data.
2.4 Cloud-Aerosol Lidar with
Orthogonal Polarization (CALIOP)
CALIPSO is a part of the “A-Train” satellite constellation and has been in operation since June 2006 (Winker et al., 2009). CALIPSO is in a 98.2◦inclination orbit which
pro-vides extensive measurements over the polar regions of both hemispheres up to 82◦in latitude. Measurements of PSCs are provided by CALIOP (Cloud-Aerosol Lidar with Orthogo-nal Polarization), the primary instrument onboard CALIPSO, which is a two-wavelength, polarization-sensitive lidar. High vertical resolution profiles of the backscatter coefficient at 532 and 1064 nm as well as two orthogonal (parallel and per-pendicular) polarization components at 532 nm are provided (Pitts et al., 2007). The lidar pulse rate is 20.25 Hz, corre-sponding to one profile every 333 m. The vertical resolution of CALIOP varies with altitude – from 30 m in the lower tro-posphere, to 180 m in the stratosphere. For the PSC analyses, the CALIOP profile data are averaged to a spatial resolution of 180 m (vertical) and 5 km (horizontal).
3 Observations and discussion
3.1 Meteorological situation
The 2009/2010 Arctic winter lower stratosphere was unusu-ally cold during the six-week period from mid-December 2009 until the end of January 2010. Among the Arctic win-ters of the past half century, the 2009/2010 Arctic winter was one of the few winters with synoptic-scale tempera-tures below the frost point, Tfrost(Pitts et al., 2011). During a seven-day period ending on 21 January, the vortex cooled below Tfrost over a large region between roughly 70–80◦N and 10◦W–80◦E. The vortex formed in early December, and
a warming over Canada in mid-December caused a splitting of the vortex into two parts. The colder part of the vortex sur-vived and cooled down through mid-January, reaching tem-peratures below Tfrost. During this time period, orographic waves were frequently excited by the flow over Greenland, but even synoptic-scale temperatures were colder than Tfrost; this is quite unusual for the Arctic and resulted in the forma-tion of ice PSCs on large scales. A major warming around 24 January caused a displacement of the vortex to the
Euro-24 23 22 21 20 19 18 Altitude (km) 5 5 4 4 WV vmr (ppmv) 120 120 100 100 80 80 RHi (%) 425 440 450 475 490 520 545
Approx. potential temperature (K)
-2 -2 0 0 T - Tfrost (K)1 1 10 10 100 100 BSR 21 UT, 17 January 2010
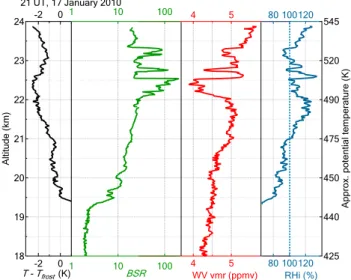
Fig. 1. Vertical profiles obtained during balloon descent on 17
Jan-uary 2010. From left to right: difference between the observed tem-perature and the “climatological” frost point (based on January mean water vapour from FPH and CFH soundings in 2002–2010, black line); backscatter ratio at 870 nm (COBALD, green line); wa-ter vapour volume mixing ratio (FLASH-B, red line); relative hu-midity with respect to ice (based on water vapour from FLASH-B and temperature from the RS92 Vaisala radiosonde). The time stamp in the upper-left corner refers to the time of stratospheric measurements.
pean Arctic and also initiated the breakup of the vortex. A detailed description of the Arctic winter 2009/2010 is pro-vided by Dörnbrack et al. (2012) and Pitts et al. (2011).
3.2 Ice PSC formation and water depletion
The first balloon sounding from Sodankylä within the LAPBIAT-II campaign was carried out on 17 January. By that time, a large area north of Sodankylä had cooled below
Tfrostat and above the 490 K potential temperature level, i.e.
above ∼ 22 km altitude. The balloon payload included both FLASH-B and CFH hygrometers as well as the COBALD backscatter sonde. Figure 1 displays the vertical profiles of the BSR, water mixing ratio, and relative humidity with re-spect to ice (RHicecalculated from the measured mixing ratio and temperature). All profiles in Fig. 1 were taken during the descent under parachute with a rather low vertical speed of about 5 m s−1 due to incomplete burst of the balloon. Ow-ing to the slow descent, the actual vertical resolution of the water vapour profile is about 20 m. To provide a comparison with the climatological situation, the leftmost panel further shows the difference between the observed temperature and the “climatological” frost point, calculated using the January mean water vertical profile, obtained from the NOAA (Na-tional Oceanic and Atmospheric Administration) Frost Point Hygrometer (FPH) and CFH soundings at Sodankylä since
2002 in the absence of ice clouds (see Supplement for de-tails).
The BSR profile displays three remarkable enhancements between 22 and 23.5 km (potential temperature 490–535 K). A layer between 22 and 22.5 km is characterized by a gradual increase of BSR from 20 to nearly 200, followed by a sharp drop back to the value of 20. Two additional enhancements of smaller vertical extent and with maximum BSR values of about 50 were measured, centred at 22.7 km and 23.3 km. The colour index in the 22–23.5 km layer (not shown), ranges from 7 to 14, pointing to supermicron particles. Most likely, the three layers of large BSR and CI contain ice particles with radii larger than ∼ 2µm. The ice layers are superim-posed onto a broad layer of elevated backscatter values above 19.5 km, most likely composed of liquid PSC particles or mixtures of liquid and NAT termed “STS” or “Mix-1”, re-spectively, in the classification of Pitts et al. (2011).
The presence of ice clouds is strongly supported by the measured profile of water mixing ratios, showing a clear anti-correlation with BSR, with considerable reductions in mixing ratio (by up to 1.3 ppmv) inside the ice PSC lay-ers, which results from repartitioning of gas-phase water into the solid phase. The precise altitude match of these layers in BSR and mixing ratio, including fine details, is remark-able. Above 21 km (∼ 475 K) the air is mostly supersatu-rated, as shown by the profile of RHice. The maximum val-ues of RHiceare observed outside the ice layers with a peak value of 134 % at 22.6 km, just between the two layers of ice PSCs, whereas inside the ice clouds the RHice is in the range 90 %–110 %. This is probably due to equilibration be-tween the gas and condensed phase. Indeed, equilibration times for the water vapour condensing onto the ice particles are of the order of τ ∼ 103s × (1 µm rice) ×(1 cm−3nice)for monodisperse ice particles with radius riceand number den-sity nice. As we show in the companion paper (Engel et al., 2013b), microphysical modelling suggests rice∼10 µm and
nice∼10−2cm−3, i.e. τ ∼ 3 h at the time it was measured in Sodankylä.
Important information is provided by the difference be-tween the frost point temperature and the observed temper-ature (T –T climatol
frost ). Temperatures 2 K below the climato-logical frost point are observed in a 1 km thick layer between 21.6 and 22.6 km with the absolute value reaching 2.5 K in-side the thickest ice cloud between 22 and 22.5 km. Trajecto-ries backward and forward in time show that the air masses were in a continuous cooling phase. Details of trajectory calculations, the temperature evolution, and possible forma-tion pathways of the observed PSC are provided by Engel et al. (2013b).
The balloon measurements on 17 January capture freshly formed layers of ice PSCs and concurrent uptake of water from the gas phase. In the following section, we will describe the evolution of the perturbed air masses based on the subse-quent balloon soundings.
650 600 550 500 450 400 350 Potential temperature (K) 22 21 20 19 18 17 16 15 14 13 12 11 10 9 8 7 6 5 4 3
water vapour mixing ratio (ppmv)
13 16 20 22 24 26 27 Approximate altitude (km) 17 21 22m 22e 23 25 28 29
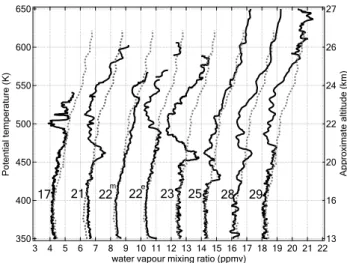
Fig. 2. Vertical profiles of water vapour obtained during January
2010 (solid black lines) compared against the “climatological” wa-ter vapour profile (based on January mean wawa-ter vapour from FPH and CFH soundings at Sodankylä in 2002–2010, grey dashed lines). Successive profiles are shifted by 2 ppmv. The dates of the sound-ings are given on the left of each profile. The superscript indices “m” and “e” indicate respectively morning and evening soundings on 22 January. The profiles of 17, 25, 28 and 29 January were ob-tained using FLASH-B, the remaining profiles were obob-tained using CFH.
3.3 Irreversible dehydration and rehydration
Evidence of irreversible dehydration is provided by the sub-sequent water vapour profiles, shown in Fig. 2 (see also Fig. S1 in the Supplement for detailed information on se-lected soundings, including the backscatter profiles, and Ta-ble 1 for a summary of all soundings). While all the backscat-ter profiles obtained afbackscat-ter 17 January suggested an absence of ice particles (as inferred from the fact that the values of BSR do exceed 20), the water vapour profiles reveal a persistent reduction in mixing ratio at different levels above 19.5 km (450 K).
The sounding performed on 21 January exhibits a broad layer between 470 and 570 K (21 and 24.5 km), where wa-ter vapour is depleted by up to 0.7 ppmv and, below, a nar-rower layer – between 450 and 470 K (20 and 21 km) – of en-hanced vapour mixing ratio by 0.6 ppmv. The observed ver-tical structure suggests a removal of water from the upper layer through gravitational settling of ice particles, followed by these particles’ sublimation below at higher temperatures (rehydration). Note that advection of extra-vortex air as a rea-son for local reductions in water mixing ratios (as reported by e.g. Müller et al., 2003) can be ruled out, given the strength of the vortex at that time. Another indication of the inner-vortex origin of the water-depleted air masses is provided by the tra-jectory analysis performed using the Lagranto model (Wernli and Davies, 1997) initialized by ECMWF (European Centre of Medium-Range Weather Forecasts) reanalysis. The 7-day
backward trajectories showed that the air masses sampled on 21 January were following the vortex rotation and passing an area of sub-frost point temperatures between Scandinavia and Spitsbergen on 16 January. The respective observations by CALIOP indicated a widespread occurrence of ice PSCs in this region, extending between 20 and 25 km altitude (Pitts et al., 2011, Supplement), which is consistent with the verti-cal range of the dehydrated layer.
The next sounding, performed 19 h later in the early morn-ing on 22 January (marked 22min Fig. 2), revealed a remark-able change in water vertical distribution, with a narrow de-hydrated layer between 540 and 555 K (23.5 and 24 km) and an absence of rehydration signatures, indicating the arrival of a new patch of perturbed air masses. A significant vertical enlargement of the water-depleted layer is revealed by the profile obtained 15 h later (22ein Fig. 2), showing the lower boundary of dehydration signal at 490 K (22 km). Remark-ably, neither 22 January sounding shows rehydration signa-tures similar to those observed on 21 January. This can be explained by the positive vertical wind shear (reported by the radiosondes), making the lower levels travel around the vor-tex more slowly (see also Engel et al., 2013b).
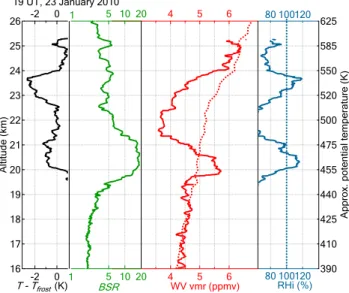
The effect of wind shear is clearly demonstrated by the se-quence of successive 22m (morning), 22e (evening) and 23 January profiles, showing the dehydrated layer broadening and spreading towards the lower levels. The rehydrated air masses travelling at the lower levels and thus arriving at the sounding location later appear only in the 23 January profile, the one providing the most prominent evidence of the wa-ter vertical redistribution. Figure 3 shows the details of this sounding, represented by the vertical profiles of frost point difference, BSR, water mixing ratio and RHice. The excur-sion of temperature below the “climatological” frost point is still visible in a layer between 20 and 24 km, where the frost point difference reaches 2.8 K. These conditions would likely cause formation of ice in an unperturbed stratosphere. However, as shown by the water mixing ratio profile, the stratospheric layer between 21 and 24 km is already dehy-drated by 1.6 ppmv. Hence, RHice does not exceed 120 % (at the coldest point of 183 K). Importantly, despite the ex-tremely low temperatures, the BSR profiles indicate only moderate concentration of particles approaching the back-ground state above 22 km (500 K), which suggests that these layers are also denitrified. This is consistent with Khosrawi et al. (2011), who reported the onset of denitrification in early January and a fast decrease of HNO3from 12 ppbv down to 5 ppbv at the 480 K level during the first half of January, as inferred from Aura MLS observations.
A totally different regime is represented by the layer below – between 450 and 460 K (19.7 and 20.6 km) – which shows an enhancement in water mixing ratios of about 1 ppmv that can be unambiguously associated with rehydration. This layer is also characterized by enhanced BSR with values reaching 20, which is indicative of a cloud and a local RHice maximum of 116 %. The BSR values are an order of
mag-26 25 24 23 22 21 20 19 18 17 16 Altitude (km) 6 6 5 5 4 4 WV vmr (ppmv) 390 410 425 440 455 475 500 520 550 585 625
Approx. potential temperature (K)
20 20 10 10 5 5 BSR 120 120 100 100 80 80 RHi (%) -2 -2 0 0 T - Tfrost (K) 1 1 19 UT, 23 January 2010
Fig. 3. Vertical profiles obtained during balloon ascent on 23
Jan-uary 2010. From left to right: difference between the observed tem-perature and the “climatological” frost point (based on January mean water vapour from FPH and CFH soundings in 2002–2010, black line); backscatter ratio at 870 nm (green); water mixing ratio (CFH), with climatological mean shown as dotted line (red); rela-tive humidity with respect to ice (blue). Note the different vertical and horizontal scaling compared to Fig. 1. The time stamp in the upper-left corner refers to the time of stratospheric measurements.
nitude smaller than those observed on 17 January and, al-though it is not possible to draw a definitive conclusion about the type of this cloud from the COBALD data alone, it is most likely an STS PSC, possibly externally mixed with NAT particles at low number densities (classes “STS” or “Mix-1” in the terminology of Pitts et al. (2011), previously also called “type I PSCs”). Indeed, the CALIOP observations sug-gest widespread occurrence of STS clouds (Pitts et al., 2011, Fig. 16 and Supplement) without any indications of ice.
The vortex breakup followed by a major warming began around the 24 January (Dörnbrack et al., 2012). The sounding carried out 30 h later on 25 January (see Fig. 2 and Fig. S1) showed a further descent of dehydration and rehydration sig-natures, occurring at 460 K (20 km) and 430 K (18.3 km), re-spectively; lower BSR values (reaching 10), and a warmer temperature minimum of 187 K at 22 km (515 K). The min-imum temperature increased further (to 191 K) by the time of the subsequent sounding on 28 January, showing no in-dications of PSCs. The water vapour profile, however, still displays a remarkable dehydration signal between 470 and 550 K (20 and 22.5 km) of 1 ppmv amplitude and a subtle re-hydration signature at 460 K (19.5 km). The next sounding, performed 24 h later on 29 January, revealed further warm-ing, absence of clouds and a very similar dehydration signal in the same layer but without a rehydration signature at lower levels. An enhancement of water mixing ratios above 24 km
might be indicative of the strong downwelling of moist air masses from the middle and upper stratosphere, which is a characteristic feature of major warmings. The three subse-quent soundings, conducted in early February, indicated an absence of PSCs and a further gradual warming and descent of the temperature minimum amounting to 202 K at 19 km (463 K) on 06 February. The signatures of water redistribu-tion could still be detected on 3 and 6 February, but with per-turbations of decreasing amplitude, likely due to a dispersion of the perturbed air masses in the vortex.
A summary of the water vapour and aerosol soundings conducted during the first phase of the LAPBIAT-II cam-paign is provided in Table 1, including the information on the observed PSCs, and de- and rehydration signatures and their amplitudes. The table shows that the dehydration signal was observed in all soundings except those conducted on 20 January and 2 February, whereas the rehydration signal ap-pears in 5 out of 13 soundings only, namely those conducted on 21, 23, 25 and 28 January as well as that conducted on 6 February. Although the very first sounding, conducted on 17 January, showed a reduction of water vapour in the presence of ice, the evidence of permanent removal of water is demon-strated by the subsequent soundings only, showing depleted water in the absence of ice clouds. The maximum amplitude of water depletion amounts to 1.6 ppmv, which is comparable to the few previous observations of dehydration in the Arctic (quoted above), except the historical observation in the Arc-tic by Vömel et al. (1997), who reported a reduction in the water mixing ratio of up to 2.5 ppmv. In contrast, signatures of rehydration and the coherent relationship between de- and rehydration in the winter Arctic stratosphere have been ob-served for the first time.
3.4 Spatiotemporal evolution of dehydration
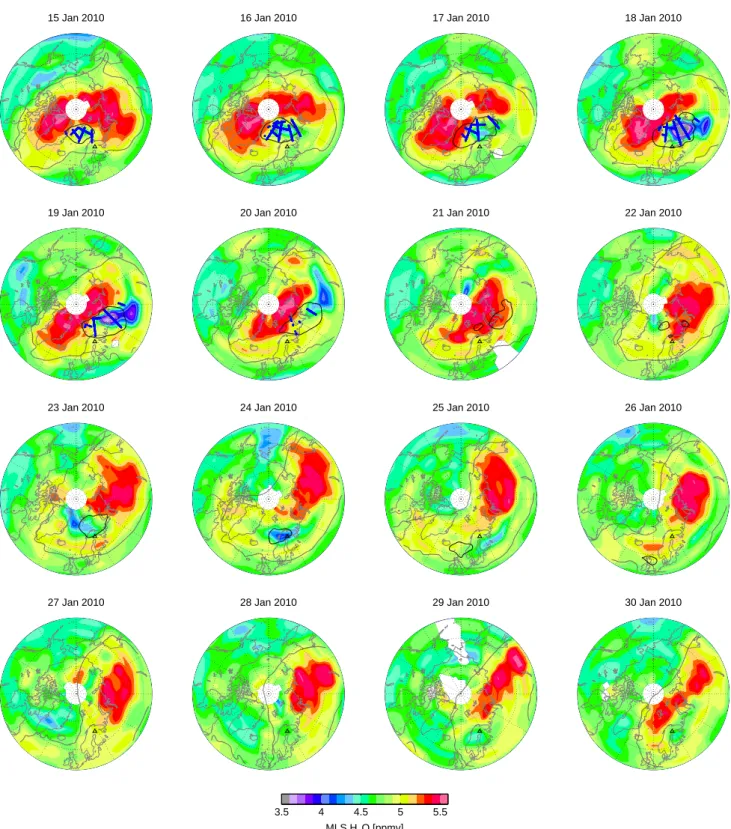
The balloon soundings represent high-resolution snapshots of the vertical water redistribution measured above a single location. We will further examine the global spatiotempo-ral evolution of ice PSCs and concurrent dehydration using space-borne observations of scattering ratios and water mix-ing ratios provided by CALIOP and Aura MLS, respectively. Figure 4 displays a series of polar projection maps of daily averaged water mixing ratios on the 490 K poten-tial temperature measured by Aura MLS during the sec-ond half of January 2010. Superimposed on these maps are the observations of ice PSCs by CALIOP: the vortex boundary (defined as the potential vorticity (PV) contour of 35 × 10−6K m2kg−1s−1), and the 187 K temperature con-tour, corresponding to the frost point at 30 hPa (correspond-ing roughly to 490 K potential temperature). The map of 15 January shows an area of mixing ratio reduced below 4.5 ppmv north-west from Scandinavia inside the frost point contour. As expected, the occurrence of ice is confined to the area colder than Tfrost. The area of sub-frost point tem-peratures and ice clouds expands and moves eastward,
ap-proaching Sodankylä on 17 January. The daily-averaged wa-ter vapour field on 17 January from MLS does not yet show the signature of water depletion directly above Sodankylä, but further north, whereas the balloon measurements ac-quired late on the same day (at 21:00 UT) revealed the on-set of dehydration, as discussed above. The situation on 18 January indicates a further expansion of the cold pool of T < Tfrost reaching the sounding location and compris-ing a large area of depleted water mixcompris-ing ratios as low as 3.5 ppmv northeast from Scandinavia, centred above the is-land of Novaya Zemlya. An occurrence of synoptic-scale ice PSCs, covering several millions of square kilometres within the cold pool, is observed by CALIOP. Remarkably, the area of water depletion extends outside the area of temperatures below the frost point, unambiguously demonstrating irre-versible dehydration. The observations of 19 January exhibit essentially the same picture as they did on the previous day, but with less ice PSCs and a smaller horizontal extent of cold and dehydrated pools. In contrast, the dehydrated air masses that have been advected outside the cold area gain a larger spatial extent.
Over the next few days, the dehydrated pool elongated and travelled around the centre of vortex, passing across the pole (beyond MLS coverage) during 21–22 January and reappear-ing above northern Scandinavia by 23 January. The balloon sounding conducted in the late afternoon on 23 January dis-played the largest amplitude of dehydration, which is con-sistent with the MLS observations, which show the dry pool approaching the sounding location on 23 January and fully covering Sodankylä on 24 January.
On 24 January, due to a planetary wave event, the vor-tex began to lose its symmetry and the cold region progres-sively shifted away from the vortex centre (Dörnbrack et al., 2012). Meanwhile, the trace of dehydrated air masses be-came less discernible in the satellite images due to mixing with non-dehydrated air inside the vortex. The pool of mix-ing ratios below 4.5 ppmv passed across northwest Russia on 25 January, further elongating and dissipating along the southeast boundary of the vortex. The final indications of the air patches dehydrated below 4.5 ppmv appear during 28– 29 January, after their second circuit within the vortex. On 28 January the dry pool is partly obscured by the MLS po-lar “blind spot”, and on 29 January it emerges above Scan-dinavia. Consistent with that, the balloon soundings of 28 and 29 January show the dehydration signal of 0.7–0.8 ppmv maximum amplitude.
Whereas the spatial evolution of the dehydrated pool ob-served by MLS is consistent with the picture provided by the balloon soundings, one should consider the limited sam-pling density of MLS measurements and their broad verti-cal resolution, which may impede the observation of weaker dehydration signals. Thus, the movement of the largest de-hydrated pool, which arose during 17–19 January, is eas-ily discernable on the polar projections, whereas the smaller patches of dehydrated air, processed by the sub-frost point
15 Jan 2010 MLS H2O [ppmv] 3.5 4 4.5 5 5.5 16 Jan 2010 MLS H2O [ppmv] 3.5 4 4.5 5 5.5 17 Jan 2010 MLS H2O [ppmv] 3.5 4 4.5 5 5.5 18 Jan 2010 MLS H2O [ppmv] 3.5 4 4.5 5 5.5 19 Jan 2010 MLS H2O [ppmv] 3.5 4 4.5 5 5.5 20 Jan 2010 MLS H2O [ppmv] 3.5 4 4.5 5 5.5 21 Jan 2010 MLS H2O [ppmv] 3.5 4 4.5 5 5.5 22 Jan 2010 MLS H2O [ppmv] 3.5 4 4.5 5 5.5 23 Jan 2010 MLS H 2O [ppmv] 3.5 4 4.5 5 5.5 24 Jan 2010 MLS H 2O [ppmv] 3.5 4 4.5 5 5.5 25 Jan 2010 MLS H 2O [ppmv] 3.5 4 4.5 5 5.5 26 Jan 2010 MLS H 2O [ppmv] 3.5 4 4.5 5 5.5 27 Jan 2010 MLS H 2O [ppmv] 3.5 4 4.5 5 5.5 28 Jan 2010 MLS H 2O [ppmv] 3.5 4 4.5 5 5.5 29 Jan 2010 MLS H 2O [ppmv] 3.5 4 4.5 5 5.5 30 Jan 2010 MLS H 2O [ppmv] 3.5 4 4.5 5 5.5 30 Jan 2010 MLS H 2O [ppmv] 3.5 4 4.5 5 5.5
Fig. 4. Aura MLS polar projection maps of water vapour mixing ratio for 15–30 January 2010, interpolated onto the 490 K potential
temper-ature surface. Grey contour denotes the vortex boundary given as the potential vorticity value of 35 × 10−6K m2kg−1s−1Black contour: 187 K at 00:00 UTC Tfrostat 30 hPa, assuming 5 ppmv of water vapour). Blue markers: CALIOP observations of ice clouds thicker than
Table 2. Listing of aircraft flights during January–February 2010
(RECONCILE first phase). From left to right: date and time of the aircraft takeoff; hygrometer type used (FLA=FLASH-A); indica-tor of rehydration signatures; maximum amplitude of rehydration signal (ppmv).
Date Time, UTC Hygrometer Indicator Amplitude 17.01.2010 11:17 FISH, FLA – – 20.01.2010 08:13 FISH – – 22.01.2010 10:01 FISH, FLA – – 24.01.2010 13:30 FISH, FLA – – 25.01.2010 05:50 FISH, FLA R +(0.3–0.7) 28.01.2010 09:00 FISH, FLA R +0.6 30.01.2010 06:36 FISH, FLA – – 02.02.2010 10:01 FISH, FLA – –
temperatures during the preceding days (as detected in the 21 January sounding) are far less obvious. The 3 km vertical res-olution of MLS does not allow tracking the rehydration sig-natures of ∼ 1 km thickness as shown by the balloon sound-ings. In addition, the rehydration signal could be smeared out by the dehydration signal immediately above; therefore both signals weaken one another.
3.5 Evidence of dehydration and rehydration
from aircraft measurements
The 20 km ceiling altitude of the M55-Geophysica aircraft carrying the RECONCILE payload did not allow for sam-pling the dehydrated air masses, which, according to the bal-loon soundings, were mostly restricted to the altitudes above 20 km (475 K). However, the rehydrated plumes, detected in the balloon soundings as low as 18 km, were within reach of the aircraft. A summary of the aircraft flights and the rehy-dration signatures detected therein is provided in Table 2.
Enhancements in the water vapour mixing ratio by 0.3– 0.9 ppmv were detected in the aircraft flights on 25 and 28 January; consistent with the balloon profiles obtained on the same day and showing the rehydrated layers. Figure 5 dis-plays the time series of water vapour measured by the FISH and FLASH-A instruments on the flight of 25 January, the climatological January mean water vapour for the given al-titude (based on balloon soundings at Sodankylä in 2002– 2010), the potential temperature and the altitude flight pro-file. The time series of water vapour provided by the two air-craft hygrometers are in good agreement (see supplementary material for details), although the FISH and FLASH-A water vapour time series are both 5–8 % drier than the climatologi-cal mean.
During the horizontal flight leg conducted at constant alti-tude of 19 km, water vapour enhancements of 0.5, 0.3 and 0.7 ppmv were observed within the time intervals 24 900– 25 200, 25 680–25 900 and 28 000–28 470 s, corresponding respectively to 58, 42 and 81 km horizontal crosscut dis-tances (marked by 3 black arrows). The water enhancements
435 430 425 420 415 Pot. temperature (K) 32400 30600 28800 27000 25200 23400 21600 UTC (s) 20 18 16 14 12 10 Altitude (km) 10 9 8 7 6 5 4 3 2 1 0
water vapour mix. ratio (ppmv)
25 January 2010 06 UT WV FISH WV FLASH altitude climWV pot. temp.
Fig. 5. Results of the aircraft flight on 25 January 2010 showing
the rehydration signatures: time series of water mixing ratio mea-sured by FISH and FLASH-A (left axis); potential temperature (up-per right axis); altitude flight profile (right axis) and climatological mean water vapour for the given altitude (based on January mean water vapour from FPH and CFH soundings in 2002–2010, dashed black line, left axis). Tick marks on the horizontal axis correspond to 10 min intervals. The black arrows point to regions with positive water vapour anomalies, associated with rehydration.
coincide with local maxima in potential temperature, sug-gesting that the aircraft was flying just at the lower edge of a rehydrated layer, crossing three troughs of it, which were bulging down and intersecting the aircraft flight level. This is confirmed by a larger enhancement of the water mixing ratio (by 1 ppmv) detected once the aircraft started climbing to its ceiling altitude of 20 km. An increase of 1 ppmv within a 1 km layer significantly exceeds the expected vertical gra-dient of mixing ratio inside the vortex, as seen from the cli-matological mean water vapour (dashed black curve), dis-playing a difference of only 0.3 ppmv between 19 and 20 km. Furthermore, at the highest part of the flight, the water vapour series show a small drop of 0.3 ppmv, which could be due to the aircraft approaching the top of the rehydrated layer. Such a vertical structure is consistent with the balloon profile of 25 January, taken 7 h prior to the aircraft flight and display-ing the rehydrated layer between 18.2 km (430 K) and 19 km (440 K).
Similar features were observed in the aircraft flight on 28 January (not shown), when both hygrometers detected an in-crease of 0.5–0.6 ppmv at 19 km during the final climb of the aircraft to 20 km altitude, followed by a drop of water vapour to its background level at the aircraft ceiling point. This ob-servation is consistent with the balloon profile obtained 6 h later from Sodankylä, which showed a rehydrated layer with a 0.5 ppmv water enhancement between 19 and 19.5 km alti-tude.
4 Summary and conclusions
By 15 January 2010, the coldest regions of the Arctic strato-spheric vortex reached temperatures as low as Tfrost. This was accompanied by a major outbreak of ice PSCs, observed by CALIOP on a synoptic scale, lasting from 15 to 21 January (Pitts et al., 2011). Owing to the extensive sounding program implemented within the LAPBIAT-II and EU RECONCILE campaigns, the composition of the Arctic stratosphere dur-ing this period was accurately monitored usdur-ing stratospheric balloons and the high-altitude M55-Geophysica aircraft.
Thirteen balloon soundings were conducted from So-dankylä during 17 January–6 February, involving CFH and FLASH-B hygrometers flown together with the COBALD backscatter sonde. The measurements of water vapour, ob-tained using two independent techniques, are in excellent agreement, which allows for using FLASH-B and CFH pro-files as consistent and interchangeable data sets. The balloon measurements taken on 17 January capture freshly formed layers of ice PSC and concurrent uptake of water from the gas phase in great detail, providing an unprecedented high-resolution “snapshot” of the process of ice PSC formation. Possible formation pathways of the observed PSC are dis-cussed in the companion paper by Engel et al. (2013b). Furthermore, balloon soundings provided evidence of irversible dehydration by showing a permanent layer of re-duced water mixing ratio between 19.5 and 24 km altitude in the absence of ice PSCs as well as an underlying 1 km thick layer of enhanced water mixing ratio, attributed to re-hydration through evaporation of the falling ice particles. The vertical redistribution of water vapour is observed for the first time in the Arctic stratosphere. The signatures of de-hydration and rede-hydration in the vertical profiles could be detected until 6 February, although the amplitude of pertur-bations decreased over time due to continuing dispersal of the air masses in the vortex. Additional evidence of the existence of rehydrated layers is provided by the aircraft-borne FISH and FLASH-A hygrometers, on board by the stratospheric research aircraft M55-Geophysica in two of the eight air-craft flights carried out during the given period. The airborne hygrometers, being in good agreement with each other, show enhancements in mixing ratio of 0.3–0.7 ppmv between 19 and 20 km altitude, which is consistent with measurements from the corresponding balloon flights. In contrast, the de-hydrated layers, residing above the aircraft ceiling altitude could not be sampled by the airborne instruments.
The source region of dehydration and its spatiotemporal evolution was examined using space-borne Aura MLS ter vapour observations. A sequence of polar projection wa-ter vapour maps shows the onset of dehydration on 15 Jan-uary and its maximum development on 18–19 JanJan-uary, when the dehydrated pool extends outside the area below the frost point. The dehydrated air masses travel around the centre of the vortex, reappearing above Scandinavia on 22 January. The final indications of patches of air dehydrated below 4.5
ppmv appear on 28–29 January, after their second circuit within the vortex. The spatial evolution of the dehydrated pool observed by MLS is consistent with the picture pro-vided by the balloon soundings, although due to ∼ 3 km ver-tical resolution of MLS measurements the dehydration signal could be smeared out by the rehydration signal immediately below it, resulting in a weakening of both signals. In partic-ular, the evolution of the 1 km-thick rehydration layer could not be followed by MLS.
Overall, the consistent observations of water vapour from balloon, aircraft and satellite platforms together with the aerosol observations by COBALD and CALIOP provide a comprehensive view of the consequences of the widespread ice PSC occurrence, that is:
1. formation of a dehydrated layer at 19.5–24 km (450– 550 K) with a reduction in water mixing ratios of up to 1.6 ppmv;
2. formation of a rehydrated layer at 18–20.5 km (430–460 K) with mixing ratio enhancements up to 0.9 ppmv;
3. redistribution of water within 18–24 km due to gravi-tational settling and subsequent evaporation of ice par-ticles.
Such exceptional conditions in the Arctic stratosphere have been observed for the first time. These observations repre-sent the most accurate and detailed data set on water vapour redistribution in the stratospheric vortex ever recorded.
Supplementary material related to this article is available online at http://www.atmos-chem-phys.net/13/ 11503/2013/acp-13-11503-2013-supplement.pdf.
Acknowledgements. We thank the personnel of the FMI-ARC and
RECONCILE coordination teams and the Myasischev Design Bureau. Through the same contract, the aircraft campaign in Kiruna and I. Engel and F. Wienhold, were partially funded by the EC as part of the FP7 project RECONCILE (226365-FP7-ENV-2008-1). The balloon campaign in Sodankylä was partly funded by the Lapland Atmosphere-Biosphere Facility (LAPBIAT). Stratospheric water vapour research in the FMI was supported by Finnish Academy under grant no. 140408. The work was partly funded by the Russian Foundation for Basic Research grants 12-05-31384-Mol-a and 11-05-00475-a. Work at the Jet Propulsion Laboratory, California Institute of Technology, was done under contract with the National Aeronautics and Space Administration.
References
Bertaux, J. L. and Delannoy, A.: Premieres measures strato-spheriques par un hygrometre a fluorescence ultraviolette, C. R. Acad. Sc. Paris, 286, 191–194, 1978.
Beyerle, G., Gross, M., Haner, D., Kjome, N., McDermid, I., McGee, T., Rosen, J., Schäfer, H.-J., and Schrems, O.: A lidar and backscatter sonde measurement campaign at Table Moun-tain during February–March 1997: Observations of cirrus clouds, J. Atmos. Sci., 58, 1275–1287, 2001.
Biermann, U. M., Crowley, J. N., Huthwelker, T., Moortgat, G. K., Crutzen, P. J., and Peter, T.: FTIR studies on lifetime prolonga-tion of stratospheric ice particles due to NAT coating, Geophys. Res. Lett., 25, 3939–3942, doi:10.1029/1998GL900040, 1998. Brabec, M., Wienhold, F. G., Luo, B. P., Vömel, H., Immler, F.,
Steiner, P., Hausammann, E., Weers, U., and Peter, T.: Particle backscatter and relative humidity measured across cirrus clouds and comparison with microphysical cirrus modelling, Atmos. Chem. Phys., 12, 9135–9148, doi:10.5194/acp-12-9135-2012, 2012.
Bukowiecki, N., Zieger, P., Weingartner, E., Jurányi, Z., Gysel, M., Neininger, B., Schneider, B., Hueglin, C., Ulrich, A., Wichser, A., Henne, S., Brunner, D., Kaegi, R., Schwikowski, M., To-bler, L., Wienhold, F. G., Engel, I., Buchmann, B., Peter, T., and Baltensperger, U.: Ground-based and airborne in-situ measure-ments of the Eyjafjallajökull volcanic aerosol plume in Switzer-land in spring 2010, Atmos. Chem. Phys., 11, 10011–10030, doi:10.5194/acp-11-10011-2011, 2011.
Dörnbrack, A., Leutbecher, M., Kivi, R., and E. Kyrö: Mountain wave induced record low stratospheric temperatures above north-ern Scandinavia, Tellus Ser. A, 51, 951–963, 1999.
Dörnbrack, A., Pitts, M. C., Poole, L. R., Orsolini, Y. J., Nishii, K., and Nakamura, H.: The 2009–2010 Arctic stratospheric winter – general evolution, mountain waves and predictability of an oper-ational weather forecast model, Atmos. Chem. Phys., 12, 3659– 3675, doi:10.5194/acp-12-3659-2012, 2012.
Drdla, K. and Turco, R. P.: A 1-D model incorporating temperature oscillations, J. Atmos. Chem., 12, 319–366, 1991.
Engel, I., Luo, B. P., Pitts, M. C., Poole, L. R., Hoyle, C. R., Grooß, J.-U., Dörnbrack, A., and Peter, T.: Heterogeneous formation of polar stratospheric clouds – Part 2: Nucleation of ice on synoptic scales, Atmos. Chem. Phys., 13, 10769–10785, doi:10.5194/acp-13-10769-2013, 2013a.
Engel, I., Luo, B. P., Khaykin, S. M., Wienhold, F. G., Vömel, H., Kivi, R., Hoyle, C. R., Grooß, J.-U., Pitts, M. C., and Pe-ter, T.: Arctic stratospheric dehydration – Part 2: Microphysi-cal modeling, Atmos. Chem. Phys. Discuss., 13, 27163–27200, doi:10.5194/acpd-13-27163-2013, 2013b.
Fahey, D. W., Kelly, K. K., Kawa, S. R., Tuck, A. F., Loewenstein, M., Chan, K. R., and Heidt, L. E.: Observations of denitrifica-tion and dehydradenitrifica-tion in the winter polarstratosphere, Nature, 344, 321–324, 1990.
Fueglistaler, S., Buss, S., Luo, B. P., Wernli, H., Flentje, H., Hostetler, C. A., Poole, L. R., Carslaw, K. S., and Peter, Th.: De-tailed modeling of mountain wave PSCs, Atmos. Chem. Phys., 3, 697–712, doi:10.5194/acp-3-697-2003, 2003.
Hintsa, E. J., Newman, P. A., Jonsson, H. H., Webster, C. R., May, R. D., Herman, R. L., Lait, L. R., Schoeberl, M. R., Elkins, J. W., Wamsley, P. R., Dutton, G. S., Bui, T. P., Kohn, D. W., and Anderson, J. G.: Dehydration and denitrification in the Arctic
polar vortex during the 1995–1996 winter, Geophys. Res. Let., 25, 501–504, 1998.
von Hobe, M., Bekki, S., Borrmann, S., Cairo, F., D’Amato, F., Di Donfrancesco, G., Dörnbrack, A., Ebersoldt, A., Ebert, M., Emde, C., Engel, I., Ern, M., Frey, W., Genco, S., Griessbach, S., Grooß, J.-U., Gulde, T., Günther, G., Hösen, E., Hoffmann, L., Homonnai, V., Hoyle, C. R., Isaksen, I. S. A., Jackson, D. R., Jánosi, I. M., Jones, R. L., Kandler, K., Kalicinsky, C., Keil, A., Khaykin, S. M., Khosrawi, F., Kivi, R., Kuttippurath, J., Laube, J. C., Lefèvre, F., Lehmann, R., Ludmann, S., Luo, B. P., Marc-hand, M., Meyer, J., Mitev, V., Molleker, S., Müller, R., Oelhaf, H., Olschewski, F., Orsolini, Y., Peter, T., Pfeilsticker, K., Piesch, C., Pitts, M. C., Poole, L. R., Pope, F. D., Ravegnani, F., Rex, M., Riese, M., Röckmann, T., Rognerud, B., Roiger, A., Rolf, C., Santee, M. L., Scheibe, M., Schiller, C., Schlager, H., Sicil-iani de Cumis, M., Sitnikov, N., Søvde, O. A., Spang, R., Spelten, N., Stordal, F., Sumin’ska-Ebersoldt, O., Ulanovski, A., Unger-mann, J., Viciani, S., Volk, C. M., vom Scheidt, M., von der Ga-then, P., Walker, K., Wegner, T., Weigel, R., Weinbruch, S., Wet-zel, G., Wienhold, F. G., Wohltmann, I., Woiwode, W., Young, I. A. K., Yushkov, V., Zobrist, B., and Stroh, F.: Reconciliation of essential process parameters for an enhanced predictability of Arctic stratospheric ozone loss and its climate interactions (REC-ONCILE): activities and results, Atmos. Chem. Phys., 13, 9233– 9268, doi:10.5194/acp-13-9233-2013, 2013.
Hoyle, C. R., Engel, I., Luo, B. P., Pitts, M. C., Poole, L. R., Grooß, J.-U., and Peter, T.: Heterogeneous formation of polar stratospheric clouds – Part 1: Nucleation of nitric acid trihydrate (NAT), Atmos. Chem. Phys., 13, 9577–9595, doi:10.5194/acp-13-9577-2013, 2013.
Jiménez, C., Pumphrey, H. C., MacKenzie, I. A., Manney, G. L., Santee, M. L., Schwartz, M. J., Harwood, R. S., and Wa-ters, J. W.: EOS MLS observations of dehydration in the 2004–2005 polar winters, Geophys. Res. Lett., 33, L16806, doi:10.1029/2006GL025926, 2006.
Khosrawi, F., Urban, J., Pitts, M. C., Voelger, P., Achtert, P., Kaphlanov, M., Santee, M. L., Manney, G. L., Murtagh, D., and Fricke, K.-H.: Denitrification and polar stratospheric cloud for-mation during the Arctic winter 2009/2010, Atmos. Chem. Phys., 11, 8471–8487, doi:10.5194/acp-11-8471-2011, 2011.
Kivi, R., Kyrö, E., Dörnbrack, A., and Birner, T.: Observations of vertically thick polar stratospheric clouds and record low temper-ature in the Arctic vortex, Geophys. Res. Let., 28, 3661–3664, 2001.
Kivi, R., Vömel, H., Immler, F., Lehtola, T., Kämpfer, N., Straub, C., Yushkov, V., Khaykin, S., Christensen, T., and Wienhold, F. G.: LAPBIAT Atmospheric Sounding Campaign in 2010, Upper-Air and Remote Sensing Observations of Water Vapour, In: WMO Technical Conference on Meteorological and Environ-mental Instruments and Methods of Observation (TECO-2010), Helsinki, Finland, 30 August–1 September 2010, Instruments and Observing System Methods Report No. 104, WMO/TD-No. 1546, 2010.
Kley, D. and Stone, E. J.: Measurements of water vapour in the stratosphere by photodissotiation with Ly- α(1216A) light, Rev. Sci. Instrum., 49, 661–697, 1978.
Koop, T., Biermann, U. M., Raber, W., Luo, B. P., Crutzen, P. J., and Peter, T.: Do stratospheric aerosol droplets freeze above the ice frost point?, Geophys. Res. Lett., 22, 917–920, 1995.
Larsen, N., Knudsen, B. M., Svendsen, S. H., Deshler, T., Rosen, J. M., Kivi, R., Weisser, C., Schreiner, J., Mauerberger, K., Cairo, F., Ovarlez, J., Oelhaf, H., and Spang, R.: Formation of solid par-ticles in synoptic-scale Arctic PSCs in early winter 2002/2003, Atmos. Chem. Phys., 4, 2001–2013, doi:10.5194/acp-4-2001-2004, 2004.
Livesey, N. J., Read, W. G., Froidevaux, L., Lambert, A., Manney, G. L., Pumphrey, H. C., Santee, M. L., Schwartz, M. J., Wang, S., Cofield, R. E., Cuddy, D. T., Fuller, R. A., Jarnot, R. F., Jiang, J. H., Knosp, B. W., Stek, P. C., Wagner, P. A., and Wu, D. L.: Aura Microwave Limb Sounder (MLS) Version 3.3 Level 2 data quality and description document, JPL D-33509, available at:http://mls.jpl.nasa.gov/, 2011.
Maturilli, M. and A. Dörnbrack: Polar stratospheric ice cloud above Spitsbergen, J. Geophys. Res., 111, D18210, doi:10.1029/2005JD006967, 2006.
Müller, M., Neuber, R., Fierli, F., Hauchecorne, A., Vömel, H., and Oltmans, S. J.: Stratospheric water vapour as tracer for Vortex fil-amentation in the Arctic winter 2002/2003, Atmos. Chem. Phys., 3, 1991–1997, doi:10.5194/acp-3-1991-2003, 2003.
Nedoluha, G. E., Bevilacqua, R. M., Hoppel, K. W., Daehler, M., Shettle, E. P., Hornstein, J. H., Fromm, M. D., Lumpe, J. D., and Rosenfield, J. E.: POAM III measurements of dehydration in the Antarctic lower stratosphere, Geophys. Res. Lett., 27, 1683– 1686, 2000.
Ovarlez, J. and H. Ovarlez: Stratospheric water vapour content evolution during EASOE, Geophys. Res. Lett., 21, 1235–1238, 1994.
Pan, L. L., Randel, W. J., Nakajima, H., Massie, S. T., Kan-zawa, H., Sasano, Y., Yokota, T., Sugita, T., Hayashida, S., and Oshchepkov, S.: Satellite observation of dehydration in the Arctic Polar stratosphere, Geophys. Res. Lett., 29, 1184, doi:10.1029/2001GL014147, 2002.
Peter, T., Müller, R., Crutzen, P., and Deshler, T.: The lifetime of leewaveinduced ice particles in the Arctic stratosphere; II, Stabi-lization due to NAT-coating, Geophys. Res. Lett., 21, 1331–1334, 1994.
Pitts, M. C., Thomason, L. W., Poole, L. R., and Winker, D. M.: Characterization of Polar Stratospheric Clouds with spaceborne lidar: CALIPSO and the 2006 Antarctic season, Atmos. Chem. Phys., 7, 5207–5228, doi:10.5194/acp-7-5207-2007, 2007. Pitts, M. C., Poole, L. R., Dörnbrack, A., and Thomason, L.
W.: The 2009–2010 Arctic polar stratospheric cloud season: a CALIPSO perspective, Atmos. Chem. Phys., 11, 2161–2177, doi:10.5194/acp-11-2161-2011, 2011.
Rosen, J. M. and Kjome, N. T.: Backscattersonde – A new instru-ment for atmospheric aerosol research, Appl. Opt., 30, 1552– 1561, 1991.
Salawitch, R. J., Wofsy, S. C., Gottlieb, E. W., Lait, L. R., Newman, P. A., Schoeberl, M. R., Loewenstein, M., Podolske, J. R., Stra-han, S. E., Proffitt, M. H., Webster, C. R., May, R. D., Fahey, D. W., Baumgardner, D., Dye, J., Wilson, J. C., Kelly, K. K., Elkins, J. W., Chan, K. R., and Anderson, J. G.: Chemical loss of ozone in the Arctic polar vortex in the winter of 1991-1992, Science, 261, 1146–1154, 1993.
Schiller, C., Bauer, R., Cairo, F., Deshler, T., Dornbrack, A., Elkins, J., Engel, A., Flentje, H., Larsen, N., Levin, I., Muller, M., Olt-mans, S., Ovarlez, H., Ovarlez, J., Schreiner, J., Stroh, F., Voigt, C., and Vomel, H.: Dehydration in the Arctic stratosphere during
the SOLVE/THESEO-2000 campaigns, J. Geophys. Res., 107, 8293, doi:10.1029/2001JD000463, 2002.
Schiller, C., Krämer, M., Afchine, A., Spelten, N., and Sitnikov, N.: The ice water content of Arctic, mid latitude and tropical cir-rus, J. Geophys. Res., 113, D24208, doi:10.1029/2008JD010342, 2008.
Sitnikov, N. M., Yushkov, V. A., Afchine, A. A., Korshunov, L. I., Astakhov, V. I., Ulanovskii, A. E., Kramer, M., Mangold, A., Schiller, C., and Ravegnani, F.: The FLASH instrument for water vapour measurements on board the high-altitude airplane, Instrum. Exp. Tech., 50, 113–121, doi:10.1134/S0020441207010174, 2007.
Stone, E. M., Tabazadeh, A., Jensen, E., Pumphrey, H., Santee, M. L., and Mergenthaler, J. L.: Onset, extent, and duration of de-hydration in the Southern Hemisphere polar vortex, J. Geophys. Res., 106, 22979–22989, 2001.
Vömel, H., Oltmans, S. J., Hofmann, D. J., Deshler, T., and Rosen, J. M.: The evolution of the dehydration in the Antarctic strato-spheric vortex, J. Geophys. Res., 100, 13, 919–926, 1995. Vömel, H., Rummukainen, M., Kivi, R., Karhu, J., Turunen, T.,
Kyrö, E., Rosen, J. M., Kjome, N. T., Oltmans, S. J.: Dehydra-tion and sedimentaDehydra-tion of ice particles in the Arctic stratospheric vortex, Geophys. Res. Lett., 24, 795–798, 1997.
Vömel, H., David, D. E., and Smith, K.: Accuracy of tropospheric and stratospheric water vapour measurements by the cryogenic frost point hygrometer: Instrumental details and observations, J. Geophys. Res., 112, D08305, doi:10.1029/2006JD007224, 2007a.
Vömel, H., Yushkov, V., Khaykin, S., Korshunov, L., Kyrö, E., and Kivi, R.: Intercomparisons of Stratospheric Water Vapour Sen-sors, FLASH-B and NOAA/CMDL Frost-Point Hygrometer, J. Atmos. Oceanic Technol., 24, 941–952, 2007b.
Waters, J. W., Froidevaux, L., Harwood, R. S., Jarnot, R. F., Pickett, H. M., Read, W. G., Siegel, P. H., Cofield, R. E., Filipiak, M. J., Flower, D. A., Holden, J. R., Lau, G. K. K., Livesey, N. J., Man-ney, G. L., Pumphrey, H. C., Santee, M. L., Wu, D. L., Cuddy, D. T., Lay, R. R., Loo, M. S., Perun, V. S., Schwartz, M. J., Stek, P. C., Thurstans, R. P., Boyles, M. A., Chandra, K. M., Chavez, M. C., Chen, G. S., Chudasama, B. V., Dodge, R., Fuller, R. A., Girard, M. A., Jiang, J. H., Jiang, Y. B., Knosp, B. W., LaBelle, R. C., Lam, J. C., Lee, K. A., Miller, D., Oswald, J. E., Patel, N. C., Pukala, D. M., Quintero, O., Scaff, D. M., Van Snyder, W,. Tope, M. C., Wagner, P. A., and Walch, M. J.: The Earth Observ-ing System Microwave Limb Sounder (EOS MLS) on the Aura satellite, IEEE T. Geosci. Remote Sens., 44, 1075–1092, 2006. Wernli, H. and Davies, H. C.: A Lagrangian-based analysis of
ex-tratropical cyclones. I: The method and some applications, Q. J. Roy. Meteor. Soc., 123, 467–489, 1997.
Winker, D. M., Vaughan, M. A., Omar, A. H., Hu, Y., Pow-ell, K. A., Liu, Z., Hunt, W. H., and Young, S. A.: Overview of the CALIPSO Mission and CALIOP Data Process-ing Algorithms, J. Atmos. Oceanic Technol., 26, 2310–2323, doi:10.1175/2009JTECHA1281.1, 2009.
Yushkov, V., Merkulov, S., and Astakhov, V.: Optical balloon hy-grometer for upper stratosphere and stratosphere water vapour measurements, in Optical remote sensing of the atmosphere and clouds edited by: J. Wang, B. Wu, T.Ogawa, and Z.-H. Guans, Proc. SPIE, 3501, 439–445, 1998.