The Effect of Iron on the Photo-oxidation of Humic Substances
by
Sharon Ho
Bachelor of Science in Environmental Engineering Science
Massachusetts Institute of Technology, 1997
Submitted to the Department of Civil and Environmental Engineering in Partial
Fulfillment of the Requirements for the Degree of
MASTER OF ENGINEERING
IN CIVIL AND ENVIRONMENTAL ENGINEERING
at the
MASSACHUSETTS INSTITUTE OF TECHNOLOGY
June 1998
@ 1998 Massachusetts Institute of Technology
All rights reserved
Signature of the Author - ,
Department of Civil and Environmental Engineering
May 8, 1998
Certified by
Bettina Margrit Voelker
Assistant Professor of Civil and Environmental Engineering
Thesis Supervisor
Certified by'-
j
Professor Joseph Sussman
Chairman, Department Committee on Graduate Studies
JUN 021998
c~j
THE EFFECT OF IRON ON THE PHOTO-OXIDATION OF HUMIC SUBSTANCES
by
SHARON W. HO
Submitted to the Department of Civil and Environmental Engineering on May 8, 1998 in partial fulfillment of the
requirements for the Degree of Master of Engineering in Civil and Environmental Engineering
ABSTRACT
Previous studies indicate that the presence of iron catalyzes DOM photo-oxidation. However, it is not clear that iron will affect DOM photobleaching in the same manner. The goal of this study is to examine the effect of iron on the rate of photobleaching in humic acid solutions, with the ultimate objective of comparing this effect with the effect iron has on the overall rate of photo-oxidation.
Photobleaching was measured as a change in absorbance in 10 mg/L humic acid solutions irradiated by a medium-pressure mercury UV lamp. Exponential decay constants were fit to each degradation curve obtained. The presence of 10 1tM Fe(III) was found to significantly increase the rate of humic acid photobleaching. The increase was larger at lower pH values. The rate of photobleaching was also found to be dependent on the wavelength where absorbance was measured.
Studies which attempted to observe iron effects on overall photo-oxidation were unsuccessful due to high scatter in the experimental method used to measure oxygen consumption. As a result, it was difficult to compare iron effects on photobleaching to iron effects on photo-oxidation.
Experiments also were conducted to examine the mechanism by which photobleaching occurs. Preliminary results indicated that Fenton's reaction may be significant in the photobleaching process. However, further examination of the photobleaching process is needed to corroborate this finding.
Key Words: photobleaching, photo-oxidation, UV, iron, humic acid
Thesis Supervisor: Bettina Margrit Voelker
Acknowledgments
Of all the people I have to thank in this endeavor, first and foremost I must thank my advisor, mentor, and friend Tina Voelker. I can never thank her enough for the long hours, guidance, and needed support I received while working on this thesis. More importantly, working with her has reminded me how much I love science and why I became an environmental engineer in the first place; I believe that is something I almost lost along the way.
In addition I would like to thank the members of her lab: Jed, Wai, Megan, and Jessica for providing me with support and information when I needed it, especially during those late nights when we were all in the lab together.
I would like to extend my appreciation to the members of my Master's of Engineering Boston Harbor group: Peter, Ricardo, and Amparo for understanding why I wasn't doing my thesis with them. I believe they have shown a great deal of patience with me throughout this project, and I thank them all for that.
On a more personal note, I would like to extend my love to my family for supporting me through five whole years of MIT when they could only really afford two and for understanding why I've been too busy to call them while I've been writing this thesis.
Finally I would like to extend my deepest love and friendship for Jeff who has done nothing but support me through this thesis while I ranted about late nights in lab and complained about my problems. He stayed up late when I had to and worked his schedule around my "Yes, I have to take samples every two hours." I couldn't have done this without your support.
Table of Contents
A BSTR A C T ... 2
ACKNOW LEDGM ENTS ... ... 3
TABLE OF CONTENTS ... ... 4
LIST OF TABLES AND FIGURES ... 5
1. INTRO DUCTION ... ... 6
1.1 DISSOLVED ORGANIC MATTER IN AQUATIC SYSTEMS ... 7
1.2 PHOTO-OXIDATION OF DOM ... 9
1.2.1 Wavelength dependence ofDOM photo-oxidation... 11
1.2.2 Fe catalysis for photo-oxidation... ... 11
1.3 O BJECTIVES OF THIS STUDY ... 14
2. M ETHODS AND M ATERIALS ... 15
2.1 EXPERIMENTAL SETUP... ... 15
2.2 HUMIC ACID PREPARATION ... ... . ...16
2.3 M EASUREMENT OF OXYGEN DEPLETION... ... ... ... 17
2.4 MEASUREMENT OF HYDROGEN PEROXIDE AND IRON (II) PRODUCTION... ... 19
2.5 MEASUREMENT OF BLEACHING BY FENTON'S REACTION ... 20
2.6 M EASUREMENT OF PHOTOBLEACHING RATE...21
3. RESULTS AND DISCUSSION ... 23
3.1 RESULTS OF OXYGEN STUDY ... 23
3.2 RESULTS OF HYDROGEN PEROXIDE AND FERROUS IRON STUDY ... 26
3.3 RESULTS OF BLEACHING BY FENTON'S REACTION...29
3.4 RESULTS OF PHOTOBLEACHING STUDIES ... ...32
3.5 THE OVERALL PICTURE... .. ... ... .. ...39
4. C O N C LU SIO N S ... 43
W O RK S C ITED ... ... 46
APPENDIX A: PHOTOBLEACHING DECAY CURVES IN LIGHT EXPOSED SAMPLES ... 48
APPENDIX B: PHOTOBLEACHING DECAY CURVES IN DARK CONTROLS ... 57
APPENDIX C: DECAY CURVE STATISTICS FOR LIGHT EXPOSED SAMPLES ... 65
List of Tables and Figures
TABLE 2.1.1. SPECTRAL ENERGY DISTRIBUTION OF RADIATED MERCURY LINES IN ACE-CANRAD HANOVIA MEDIUM PRESSURE QUARTZ MERCURY-VAPOR LAMPS. DATA PROVIDED BY ACE GLASS COMPANY...16 FIGURE 2.3.1: EXAMPLE OF A CALIBRATION CURVE FOR THE ADAPTED WINKLER METHOD USING STANDARD
ADDITIONS OF POTASSIUM IODATE SOLUTION. CSTD IS THE CONCENTRATION OF IODIDE IN SOLUTION. VA IS THE VOLUME OF POTASSIUM IODATE ADDED. VB IS THE VOLUME OF THE SAMPLE. VC IS THE
VOLUME OF SULFURIC ACID ADDED. B IS THE PATHLENGTH OF THE CUVETTE. ... 18 FIGURE 2.4.1: CALIBRATION CURVE OF HYDROGEN PEROXIDE METHOD USING STANDARD ADDITIONS IN 10
MG/L ALDRICH HUMIC ACID SOLUTION. ...20
FIGURE 2.6.1. INCREASE IN ABSORPTION OF HUMIC ACID SOLUTIONS IN WHICH 10 MM FE(III) IS ADDED....22 FIGURE 3.1.1. GRAPHS OF OXYGEN CONCENTRATION VERSUS TIME IN HUMIC ACID SOLUTIONS. DIAMONDS
REPRESENT OXYGEN CONCENTRATION IN SOLUTIONS SPIKED WITH IRON. SQUARES REPRESENT OXYGEN CONCENTRATION IN SOLUTIONS WITHOUT IRON. . THE TERM LIGHT REFERS TO SAMPLES EXPOSED TO
UV LIGHT, WHEREAS DARK REFERS TO SOLUTIONS NOT EXPOSED TO UV LIGHT ...23
FIGURE 3.2.1. GRAPHS OF HYDROGEN PEROXIDE AND FERROUS IRON CONCENTRATIONS VERSUS TIME IN HUMIC ACID SOLUTIONS. DIAMONDS REPRESENT FERROUS IRON CONCENTRATION. SQUARES
REPRESENT HYDROGEN PEROXIDE CONCENTRATION. THE TERM "WITH IRON" DESCRIBES HUMIC SOLUTIONS IN WHICH FE(III) WAS ADDED. "No IRON" DESCRIBES SOLUTIONS IN WHICH NO IRON WAS A D D ED ... . ...26
FIGURE 3.3.1. CORRECTED ABSORBANCES IN 10 MG/L SOLUTIONS OF HUMIC ACID AT PH 2.7 SPIKED WITH
HYDROGEN PEROXIDE AND FE (II). ... ... ... 30 FIGURE 3.3.2. PERCENT DECREASE, BOTH CORRECTED AND NOT CORRECTED, BETWEEN ABSORBANCE IN 10
MG/L HUMIC ACID SOLUTIONS WITH HYDROGEN PEROXIDE AND FE(II) AND WITH NO IRON AFTER A
PERIOD OF 1 DAY ... 30
FIGURE 3.3.3. EXPECTED PERCENT DECREASE IN HUMIC ACID ABSORPTION DUE TO FENTON'S REACTION IN PH 2.7 SOLUTIONS... ... 31 FIGURE 3.4.1. EXAMPLE OF DATA OBTAINED FROM PHOTOBLEACHING EXPERIMENT. CHANGE IN
ABSORBANCE AT 456 NM OVER TIME IN A PH 7.5 HUMIC ACID SOLUTION WITH IRON EXPOSED TO UV
RADIATION. ... 33
FIGURE 3.4.2. AVERAGE EXPONENTIAL DECAY RATE CONSTANTS (HR-I) FOR HUMIC SOLUTIONS PHOTOBLEACHING AT DIFFERENT PHS AND WAVELENGTHS. SOLID COLORS REPRESENT RATE CONSTANTS IN UV EXPOSED SOLUTIONS ... .. ... 34
FIGURE 3.4.3. GRAPHS DEPICTING EXPONENTIAL DECAY CONSTANTS (HR-1) AS A FUNCTION OF WAVELENGTH FOR HUMIC SUBSTANCES PHOTOBLEACHING AS FUNCTION OF PH. CIRCLES REPRESENT SOLUTIONS WITHOUT IRON PRESENT. DIAMONDS REPRESENT SOLUTIONS WITH IRON. FILLED IN SYMBOLS REPRESENT SOLUTIONS IN WHICH REDUCTANT WAS ADDED PRIOR TO MEASURING ABSORBANCE. LINES REPRESENT THE MEAN EXPONENTIAL DECAY RATE AS A FUNCTION OF WAVELENGTH. THERE IS NO LINE
FOR PH 7.5 DARK BECAUSE THERE WAS ONLY ONE POINT ... ... 35 FIGURE 3.4.4. INCREASE IN EXPONENTIAL DECAY CONSTANT AT DIFFERENT WAVELENGTHS AS A FUNCTION
OF PH DUE TO THE PRESENCE OF IRON IN UV EXPOSED SAMPLES... ... 36 FIGURE 3.4.5. AVERAGE CHANGE IN ABSORBANCE OBSERVED OVER A TEN HOUR PERIOD COMPARED TO THE
LOSS IN ABSORBANCE ONE WOULD EXPECT IF ALL FE(III) WAS CONVERTED TO FE(II)...38
FIGURE 3.5.1. PERCENT PHOTOBLEACHING EXPECTED FROM THE FENTON'S STUDY AFTER THREE HOURS IN PH 2.7 HUMIC ACID SOLUTIONS WITH IRON COMPARED TO ACTUAL OBSERVED VALUES ...42
1. Introduction
It is well known that over-exposure to ultraviolet (UV) radiation can have detrimental effects on organisms and the environment. UV exposure has been linked to melanomas of the skin, and can severely affect the well being of terrestrial and aquatic organisms. Sessile organisms, such as macroalgae and seagrasses, cannot avoid exposure to UV radiation in aquatic environments. These plants and animals rely on their natural environment to shield them from the harmful effects of UV exposure (WMO, 1994).
Recent studies indicate that light absorption by colored dissolved organic matter (CDOM) is one of the primary mechanisms by which organisms are shielded from UV light in aquatic systems. Studies conducted by Scully and Lean (1994) suggest that CDOM absorption accounts for more than 85% of the variation in UV transparency among various temperate lakes. Scully and Lean also found that UV-A attenuation was linearly related to CDOM fluorescence and was a power function of CDOM concentration in temperate lakes.
In a later study, Morris et al (1995) confirmed this conclusion by examining the absorbance of light in waters from different lakes. They found that the transmission of light through water in lakes was highly dependent on the humic acid content of the lakes studied. Between 33-68% of total UV absorbance in these same lakes could be attributed to their CDOM content.
If this is the case, then it is important to examine the factors which play a role in determining the concentration of CDOM in aquatic systems. Photo-oxidation of organic matter in these systems may significantly impact CDOM concentration. Therefore, it is important to understand the photo-oxidation process and the factors which affect the rates
at which it occurs. This study examines the role iron plays in catalyzing the photo-oxidation of CDOM, humic substances in particular.
1.1 Dissolved organic matter in aquatic systems
Dissolved organic matter (DOM) is a term used to describe all the dissolved organic material in an aquatic system. This includes a wide array of substances, each with its own unique properties. Light absorption properties will differ depending on which category of DOM is examined. Wetzel categorizes DOM into two different categories in his 1983 textbook Limnology: nonhumic and humic. Nonhumic substances are smaller molecules, typically low in molecular weight, such as carbohydrates, proteins and amino acids. These compounds generally do not absorb much light, and have very short half-lives in aquatic systems because they are easily degraded by micro-organisms. Humic substances are higher molecular-weight compounds which are harder for micro-organisms to degrade. Their composition includes conjugated ring and linear systems which can absorb more light than their nonhumic cousins. The term humic acid refers to those compounds which precipitate at very low pH values (<2). In the natural environment, a large fraction of humic substances fall into the humic acid category. Studies suggest that most of the DOM in lakes, CDOM in particular, is humic in nature. So, I will be using the terms CDOM, DOM, and humic acids interchangeably in this introduction.
The concentration of dissolved organic matter in a given lake is a function of the rates at which it is being supplied and depleted. The steady state concentration of DOM
is generally 2-10 mg/L in lakes and rivers (Morel and Hering, 1993). DOM in aquatic systems is a product of decaying plant and animal material, primarily terrestrial in origin. Organic matter accumulates on land mostly in the form of decaying vegetation, such as the leaves which fall to the ground in autumn. When a rainstorm occurs, water washes some of the organic matter into receiving water bodies. This process contributes a large fraction of the DOM that can be found in streams and lakes.
Several studies exist surrounding the DOM budget in a set of Ontario lakes. One study by Dillon and Molot (1997) concluded that the primary source of DOC in a set of lakes located in Ontario was from the surface soils of nearby peatlands. Furthermore, Hinton et al (1997) showed that in autumn between 57-68% of the DOM in the same lakes was due to stormwater run-off. Although this number was lower during the spring, it was still estimated that 29-40% of the DOM could still be attributed to run-off from
storms during the warmer seasons.
Once DOM enters an aquatic system, there are many things which could happen to it. Some of the DOM may sorb to particles which settle to the sediment floor. DOM may also be degraded by micro-organisms in the water. These compounds can also absorb UV radiation and break down into many different degradation products. Some of these products degrade further, mineralizing into CO2. Some are broken down until they are of manageable size for bacteria, after which the products are consumed.
If UV exposure is a significant sink of dissolved organic matter, the CDOM concentration in an aquatic system could be highly dependent on the amount of UV exposure the water is receiving. Some studies have shown that increases in UV light a lake receives may decrease the concentration of humic acid. This decrease in CDOM
concentration causes the water to become more transparent, allowing more UV light to enter the system. This term is called "photobleaching." For example, the diffuse attenuation coefficient is a measure of how far light can penetrate in a body of water. The higher the coefficient is, the more light is attenuated with depth. In lakes the diffuse attenuation coefficient was found to decrease 39 to 81% from winter to summer when the amount of UV radiation entering the atmosphere is much higher (Morris and Hargreaves,
1997).
Many scientists are concerned that increased UV radiation caused by the thinning of the Earth's ozone layer may decrease the steady state CDOM concentration of aquatic systems. This can severely affect the amount of UV light organisms in aquatic environments are exposed to. Not only is there more UV hitting the water body, but there is less CDOM to screen the harmful rays. Organisms in aquatic systems may feel double the impact from an increase in UV radiation entering the atmosphere. Consequently, it is important to examine the mechanism by which this occurs to determine if there is a serious threat.
1.2 Photo-oxidation of DOM
The mechanism by which humic substances photo-oxidize is not fully understood. Many studies attempt to identify factors which play a role in the degradation of DOM, humic substances in particular (Aguer, 1996 and Lindell 1994). The first step in ascertaining the mechanism by which humic substances photo-oxidize is to determine the
rate at which the reaction occurs. One way to do this is to measure the rate of oxygen consumption, as oxygen is the primary electron acceptor in this process (eqn 1.2-a).
DOC + 02 - oxidized DOC + 02- (1.2-a) The oxidation of DOC produces superoxide radicals (eqn. 1.2-a). These radicals can react to form hydrogen peroxide.
HO 2/O2- + H
+ --
H202 (1.2-b)
As early as 1931, scientists have noted that humic lakes are generally under-saturated with respect to oxygen concentration (LUnnerblad, 1931 as quoted by Lindell and Rai, 1994 and Wetzel 1983). Recent studies conclude that this is partially due to the photo-oxidation of humic substances due to UV exposure. Dissolved oxygen concentrations decreased significantly in lab experiments exposing solutions of humic material to UV light (Lindell and Rai, 1994). The rates at which humic substances degrade could account for the decreased concentrations of oxygen typically found in natural water systems.
Although oxygen consumption is a good indicator of overall DOM oxidation, it is not clear how the rate of photobleaching is related to the rate of oxygen consumption. Studies such as those by Scully and Lean and Morris et al indicate that UV photobleaching does occur, and that it is significant in natural systems. Furthermore, it is not clear whether the two are affected by the same factors.
1.2.1 Wavelength dependence of DOM photo-oxidation
A study performed by Kouassi and Zika (1990) suggests that the light absorption properties of humic acid vary according to the chromophores of which the substance is comprised. Kouassi and Zika irradiated samples of humic acid solution in seawater with both UV radiation and natural sunlight, and found that the changes in absorbance relied heavily on the wavelength observed. One possible explanation for this is that different components of humic acid may preferentially absorb light at different wavelengths, and degrade at different rates. Humic acid contains a wide array of different chromophores (Clair and Sayer 1997). In the process of degrading, some of these compounds may degrade into smaller components which absorb at different wavelengths as well. Because of this, it is possible that photobleaching will occur faster at some wavelengths than at others.
In a later study, Vodacek (1992) found that the absorption of light in CDOM samples was highly dependent on the solution's pH. The speciation of many humic chromophores may depend on the pH of the solution. Vodacek concluded that the pH-dependence of these chromophores may explain the spectral variation found in many freshwater lakes.
1.2.2 Fe catalysis for photo-oxidation
Organic matter can degrade via direct photodegradation as UV light hits an organic molecule, forming 02 and H202 (eqn. 1.2-a and 1.2-b). There are several
mechanisms by which this process can be catalyzed. For example, the presence of metals such as iron has been noted to speed the photo-oxidation process.
A study performed by Miles and Brezonik (1981) concluded that the presence of iron catalyzes the process of oxygen depletion associated with photo-oxidation. The study observed the effect of both pH and iron has on the rate of humic substance photo-oxidation. Samples were collected from several bodies of water in Florida, and oxygen consumption as a result of humic acid degradation was observed. Samples spiked with ferric iron demonstrated a significantly higher consumption rate of oxygen. This rate was found to be linearly dependent on the Fe(III) concentration. The rate was found to also increase linearly with pH and CDOM concentration.
However, the water samples used in Miles and Brezonik's work were from Fe-and DOM-rich bogs, Fe-and therefore Fe Fe-and DOM concentrations were much higher than one would normally expect in streams and lakes. At lower concentrations of both, one would expect a much slower rate of overall photo-oxidation, and the actual mechanism of oxidation and Fe catalysis may differ.
There are several ways the presence of iron can catalyze the rate of humic substance oxidation. Humic substances can attach themselves directly to the surface of iron oxide crystals or bind to dissolved iron in solution. When these complexes are exposed to light, ligand-to-metal charge transfer reactions can occur. The excited complex can either thermally deactivate, returning the complex back to its original state, or dissociate forming oxidized humic material, and reduced iron.
Alternatively, photo-oxidation of humic material on the surface of iron oxides can occur via an indirect mechanism. The iron oxide, itself, can absorb UV light which transfer valence band electrons to the conduction band. This leaves electron "holes" in the valence band of the iron oxide. These holes may be scavenged by the organic matter
complexed to the iron oxide. This, too, results in oxidized humic material. However, this requires the iron oxide to be in crystalline form. Therefore, this type of mechanism is not expected in the solutions examined in this study.
The rate of photo-oxidation can be catalyzed by indirect reactions, as well. The cycling of iron between its Fe(II) and Fe(III) forms is driven by the oxidation of DOM. When ligand-to-metal charge transfer reactions occur (see above), Fe(III) is reduced to Fe(II).
Fe(III) + DOM - Fe(II) + oxidized DOM (1.2.2-a) Another potential source of Fe(II) is the reduction of Fe(III) via photo-produced 02. The photo-oxidation of DOM also produces hydrogen peroxide via 02 (see above), which in turn reacts with Fe(II) to Fe(III), hydroxide, and hydroxyl radicals. This process is called Fenton's reaction.
Fe(II) + H202 - Fe(III) + OH' + OH- (1.2.2-b) The radicals produced in this reaction can also degrade DOM (Voelker, 1994 and references cited therein).
The primary mechanism by which DOM degrades is very important. Whereas certain mechanisms such as direct photolysis will preferentially photobleach at certain wavelengths, other mechanisms such as reactions with hydroxyl radicals may be less selective among functional groups, and therefore cause more uniform bleaching across the spectrum of light. So the wavelength distribution of light energy entering an aquatic system may rely on the mechanism by which the photo-oxidation of DOM occurs.
1.3 Objectives of this study
Since the presence of iron has been documented to increase the rate of oxygen consumption in the photo-oxidation process, it is reasonable to assume that it will also affect the rate of photobleaching. However, this phenomenon has not been documented. This study attempts to identify how the presence of iron affects the rate at which humic substances degrade under UV exposure. Based on this information, the objectives of this study are threefold:
1) Measure the effect of iron on the rate of oxygen consumption in humic acid solutions which exhibit conditions more like stream and lakes as a gauge of humic acid photo-oxidation. As stated previously, Miles and Brezonik studied iron effects in solutions with extremely high CDOM and Fe concentrations.
2) Attempt to ascertain some information of the mechanisms behind both photo-oxidation and photobleaching. This will be done by measuring hydrogen peroxide and ferrous iron concentrations to learn of the importance Fenton's reaction has in the overall mechanisms. In addition, measuring hydrogen peroxide formation will serve as another gauge of the photo-oxidation rate.
3) Observe the effect iron, pH, and wavelength will have on the overall rate of photobleaching in a humic acid solution. The ultimate objective is to compare the effects of Fe and pH on overall DOM photo-oxidation with their effects on photobleaching.
2. Methods and Materials
This study is broken into three parts. First, an attempt was made to confirm that the presence of iron increases the rate of oxygen consumption due to humic substance photodegradation. Second, humic acid solutions were exposed to UV radiation and measured for hydrogen peroxide and Fe(II). The purpose of this experiment was to gain knowledge of the mechanism by which photobleaching actually occurs. Finally, several experiments were run to determine the effect iron has on the rate of humic acid photobleaching.
2.1 Experimental setup
The photochemical setup used in these experiments was designed by Ace Glass Company. Equipment included a turntable with a 50 test tube capacity. Held in the center of the turntable was a 450 watt medium-pressure mercury UV lamp sitting in a quartz cooling well. Table 2.1.1 lists the peaks produced by the mercury lamp along with their relative energy. Millipore Q-water was circulated through the cooling well using a recirculating water chiller to keep the test tube temperature constant. A Pyrex sleeve was placed around the mercury lamp to cut-off wavelengths below approximately 300 nm. This was done to better represent sunlight conditions. This turntable was placed in a water tank to ensure even temperature throughout the experiment. The entire setup was enclosed by a UV safety cabinet also designed by Ace Glass.
Mercury Line Radiated (angstroms) Energy (Watts)
13673 (infrared) 2.6 11287 3.3 10140 10.5 fo-( l 10 7-- f,1 T---5780 (yellow) 20.0 5461 (green) 24.5 4358 (blue) 20.2 4045 (violet) 11.0 3660 (U.V.) 25.6 3341 2.4 3130 13.2 _3025_--- 7.2---3025 7.2 2967 4.3 2894---
1.6---Table 2.1.1. Spectral energy distribution of radiated mercury lines in Ace-Canrad
Hanovia medium pressure quartz mercury-vapor lamps. Data provided by Ace Glass Company.
2.2 Humic acid preparation
Humic acid stock solutions were prepared by dissolving 100 mg of acid washed Aldrich humic acid into 1 liter of water. These solutions were buffered using 10 mM sodium bicarbonate (NaHCO3). In addition, a 100 mM stock solution of NaC10 4 was
prepared by dissolving 7.027 g of NaCIO4*H20 into 500 mL of Millipore Q-water.
The humic acid initially contained high concentrations of iron. Before making the stock solution, the Aldrich humic acid was washed following a procedure as detailed by Janet Hering in her 1988 Ph.D. thesis. Subsequent iron concentrations were undetectable using the ferrozine method as described by Voelker,1994. The detection limit of this colormetric method was approximately 0.2 ptM. This value was estimated assuming an average error of 0.003 in the absorbance measurement.
Mercury Line Radiated (angstroms) Energy (Watts)
2804 2.4 2753 0.7 2700 1.0 2652 4.0 2571 1.5 2537 (reversed) 5.8 2482 2.3 2400 1.9 2380 2.3 2360 2.3 2320 1.5 2224 3.7 Total Watts: 175.8
2.3 Measurement of oxygen depletion
The first set of experiments attempted to demonstrate the effect of iron on the oxygen consumption rate due to humic substance photodegradation. Humic acid solutions were made using the acid washed material as described previously. Solutions were made with final concentrations of 10 mg/L humic acid, 1 mM NaHCO3, and 10 mM
NaCIO4.
Solutions were tested at pH 2.7 and 7.5. Sulfuric acid was added to bring solutions to the appropriate pH. Following addition of acid, half of the solutions were spiked with 10 ptM FeCl3. Solutions intended for UV exposure were placed in stoppered
quartz test tubes and placed in the photochemical setup. Solutions were also placed in Pyrex tubes wrapped with black electrical tape to observe the dark reaction as a control. After turning on the mercury lamp, tubes were removed at two hour intervals from the photochemical setup.
The Winkler method is a traditional way to measure oxygen concentration. An altered version of the Winkler procedure developed by Pai, Gong, and Liu (1993) was used to measure oxygen consumption in the samples via a colorimetric method. Manganese chloride, alkaline iodide, sulfuric acid, and potassium iodate reagents were prepared as dictated in Pai et al's paper. Solutions removed from the photochemical setup were spiked with manganese chloride and alkaline iodide reagents. Each tube was allowed to sit for two hours in the stoppered quartz tubes. A few acid washed glass beads were added to each tube before re-stoppering them to ensure that no air bubbles would
form when the tube was re-stoppered. Afterwards sulfuric acid reagent was added, and the absorption of the resulting solution was measured at 456 nm using a 1 cm quartz cuvette. Unlike Pai's method, standard additions were not used; rather a single measurement was made for each sample.
2 - 1.5 E 1 R2 = 0 R1 0 0.0005 0.001 0.0015 3*b*Cstd*Va/(Vb+Vc)
Figure 2.3.1: Example of a calibration curve for the adapted Winkler method using standard additions of potassium iodate solution. Cstd is the concentration of iodide in solution. Va is the volume of potassium iodate added. Vb is the volume of the sample. Vc is the volume of sulfuric acid added. b is the pathlength of the cuvette.
Four calibration curves were made, each with a linear regression R2 value of 1 (Fig. 2.3.1). The average extinction coefficient for these calibrations was 1055 M-' cm'. The standard deviation was approximately 48. Although lower than the extinction coefficient calculated by Pai et al whose value was around 1080, the value 1055 was used to calculate molar concentrations of oxygen in solution.
Absorption due to humic acid was subtracted out before oxygen concentrations were calculated. Several experiments were run in which the absorption of light at 456 nm due to humic acid was measured in humic acid solutions (see section 2.5). The average
absorption values due to humic acid were calculated and subtracted before oxygen concentrations were calculated from the Winkler experiments.
2.4 Measurement of hydrogen peroxide and iron (II) production
Measurements of hydrogen peroxide and Fe(II) were made in an attempt to learn whether Fenton's reaction has a significant role in photobleaching. Humic acid solutions were made to the same specifications as in the oxygen experiments. Samples were measured every 30 minutes for hydrogen peroxide and Fe(II).
The method used is described in Dr. Bettina Voelker's 1994 Ph.D thesis. 1.5 mL of sample was placed in a 1 cm cuvette. The samples were spiked with 0.3 mL of pH 6 phosphate buffer, 75 tL of 10-2 M bipyridine in 10"3 M HC10
4, and 25 tL of 10-2 M
EDTA. The samples were then measured at 522 nm as an indication of iron II concentration. Afterwards, 25 piL each of DPD solution and peroxidase solution were added. DPD concentration was 0.1 g in 10 mL of 0.1 N H2SO4. Peroxidase concentration
was 10 mg in 10 mL of Millipore Q-water. After one minute, the absorbance of the solutions was measured at 552 nm to measure hydrogen peroxide.
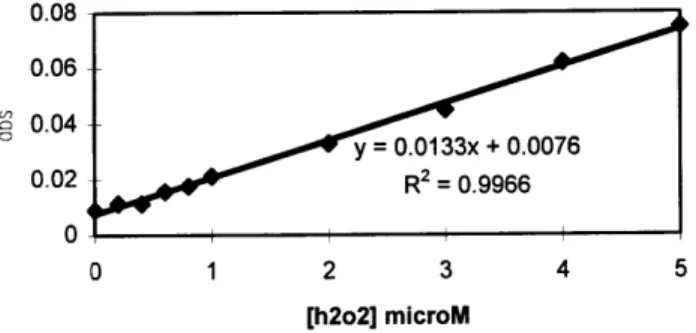
The extinction coefficient for the calibration curve produced in this study is 13300 M-'cm-' (fig. 2.4.1). This is significantly lower than the 21000 M-'cmm1 values cited by Bader et al (1988). It is unclear why this is the case, although there are several possible explanations. It is possible that something was wrong with the H202 stock solution, and that the concentration in the stock was actually lower than expected. Another possible explanation is that Aldrich humic acid is interfering with the formation of the DPD
product. Further analysis must be made to come to more definite conclusions. This discrepancy in the calibration curves must be kept in mind when analysis is performed on the hydrogen peroxide studies in this thesis.
0.08 0.06 0.04 y = 0.0133x + 0.0076 0.02 R2 = 0.9966 0 0 1 2 3 4 5 [h2o2] microM
Figure 2.4.1: Calibration curve of hydrogen peroxide method using standard additions in 10 mg/L Aldrich humic acid solution.
2.5 Measurement of bleaching by Fenton's reaction
In order to observe the oxidation of humic substances due solely to Fenton's reaction, a pH 2.7 solution of 10 mg/L humic acid was spiked with Fe(II) and H202 such
that the concentrations of each were around 10 tM. The absorbance of the solution was measured. Then, the container with this solution was wrapped in aluminum foil and kept at room temperature for a period of approximately 24 hours. The absorbance was measured again and compared to a solution to which only peroxide was added.
2.6 Measurement ofphotobleaching rate
Several experiments measured the effect iron has on the rate of humic acid photobleaching. Experiments were performed at three pH values: 2.7, 4.0, and 7.5. Again, solutions were brought to the appropriate pH using sulfuric acid. Solutions were tested both with and without Fe(III). Those with iron were brought to a concentration of 10 pM FeC13. Light and dark reactions were observed over a period of 10 hours. Again,
solutions were either placed in stoppered quartz test tubes or Pyrex tubes wrapped with black electrical tape.
Samples were placed into the photochemical setup and exposed to UV radiation. Samples were taken out of the photocabinet and measured every two hours for absorbance.
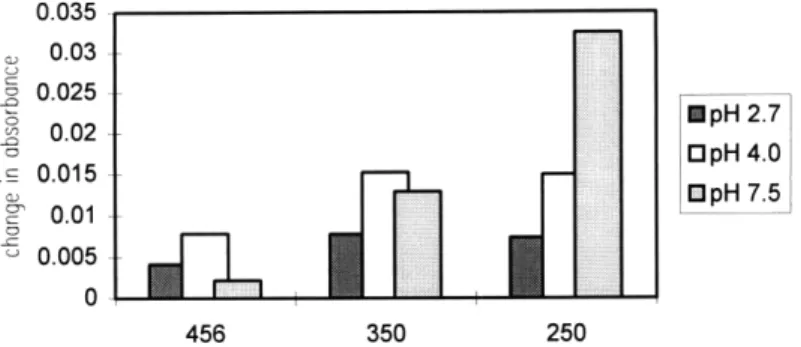
One concern when measuring these samples is the presence of Fe(III), which absorbs light. One possible way to account for this is to subtract the initial difference between the iron-spiked solutions and iron-free solutions from the rest of the samples. Measurements were made to determine the change in color which would occur if 10 pM of Fe(III) were added to a humic acid solution at pH 2.7, 4.0 and 7.5. The results are shown in figure 2.6.1.
0.035 0.03 0.025 - 0.02 . 0.015 2 0.01 0.005 0 456
Figure 2.6.1. Increase in absorption
added.
M pH 2.7
OpH 4.0
E pH 7.5
350
of humic acid solutions in which 10 pM Fe(III) is
Unfortunately, Fe(III) is known to absorb light in solutions whereas iron(II) does not. If there is a significant amount of Fe(II) being formed in solution, the subtractive procedure may over-compensate at later times. Alternatively, a way eliminate the effect of Fe(III) in the samples is to spike solutions with OHNH3C1 reductant. Both procedures
were performed and the results compared.
3. Results and Discussion
3.1 Results of oxygen study
Since oxygen is the primary electron acceptor during humic acid photo-oxidation (eqn. 1.2-a), measuring oxygen consumption is a good gauge of the overall rate at which humic acid is being oxidized. Measurements of oxygen levels over time were made to determine the effect iron has on the rate of humic acid photo-oxidation.
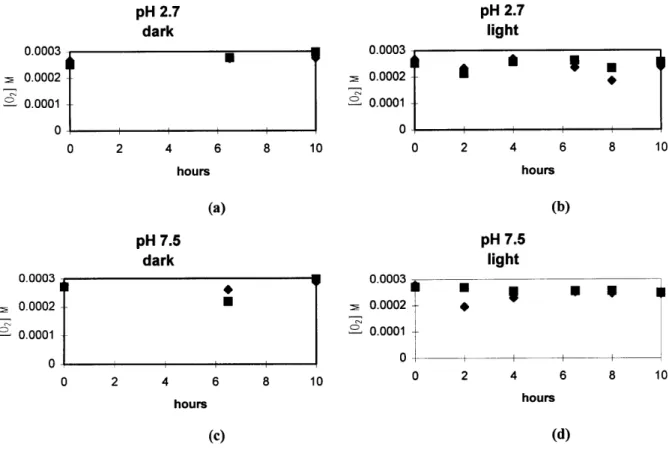
Oxygen concentration was measured in UV exposed samples every two hours. Measurements were made in dark controls at 6 and 10 hours. The results are shown in figure 3.1.1. pH 2.7 dark pH 2.7 light 0.0003 0.0002 0.0001 0 0 2 4 6 8 10 hours (a) pH 7.5 dark 0 2 4 6 8 10 hours 0.0003 - 0.0002 2 0.0001 0 0 2 4 6 8 10 hours (b) pH 7.5 light 0.0003 0.0002 2 0.0001 0 0 2 4 6 8 10 hours (d)
Figure 3.1.1. Graphs of oxygen concentration versus time in humic acid solutions. Diamonds represent oxygen concentration in solutions spiked with iron. Squares represent oxygen concentration in solutions without iron. . The term light refers to
samples exposed to UV light, whereas dark refers to solutions not exposed to UV light.
0.0003
0.0002 ' 0.0001
There was a high amount of scatter in the oxygen measurements in the experiments. As a result, it was difficult to measure any significant oxygen depletion. Miles and Brezonik's results suggest that the oxygen consumption rate in pH 3.6 waters spiked with 10 tM of Fe(III) will be less than 0.02 mg/L/hr, or 0.625 ipM/L/hr. In water samples with an initial oxygen concentrations around 2.5 * 10-4 M, like the samples used in this study, the oxygen concentration would drop less than 3% over a period of 10 hours. Note that this is only an estimate because the light conditions used in this study are not exactly comparable to the light conditions used in Miles and Brezonik's experiments. However, the rate of H202 production measured in the next section indicate
that the rates are not extremely different (see following section).
Also important to note is that the consumption rates calculated in Miles and Brezonik's study used Austin Cary cypress swamp water, which contains higher DOM concentrations than the solutions used in this study. Since it was found that the rate of oxygen consumption increased with increasing CDOM concentration, the rate of consumption in the experiments of this study would be even lower than the rate found by Miles and Brezonik. This small rate of oxygen consumption would be masked by the large scatter in the oxygen measurements. Thus, the findings of the experiments performed can neither corroborate nor disprove Miles and Brezonik's findings.
Even given the high degree of scatter, information about the rate at which the overall oxidation of DOM occurs can still be ascertained. The average standard deviation for the dark control experiments was around 20 tM over the ten hour period. The maximum standard deviation observed was 40 [M. Since these samples were not
exposed to light, little-to-no humic acid oxidation was expected. Thus, it can be assumed that the scatter in the samples is completely due to the variability in the method used.
If the amount of oxygen consumed had been larger than the observed maximum
standard deviation of 40 pM, then the consumption would have been noticed. Since oxygen consumption was not observed, it is likely than less than 40 tM of oxygen was consumed in the 10 hour period. This gives a maximum consumption rate of 4 pM/hr.
There are many reasons why the method used produced such wide scatter. One likely explanation for the high degree of variance is oxygen contamination of the samples. Oxygen may have seeped in past the edges of the stopper during the course of the experiment. In addition, oxygen may have entered as the stopper was removed and replaced when reagents were added. Pai et al took great care to prevent oxygen from entering their system. However, the method they used to mix reagents involves large amounts of solution. Due to the relatively small amounts of solutions in the test tubes, this method was not feasible. Although oxygen solubility is highly dependent on a solution's temperature, this was deemed to be not a factor in this study because temperature remained fairly constant throughout the experiment.
3.2 Results of hydrogen peroxide and ferrous iron study
The purpose of this experiment was to use hydrogen peroxide formation as an indicator of the over-all photo-oxidation of DOM.
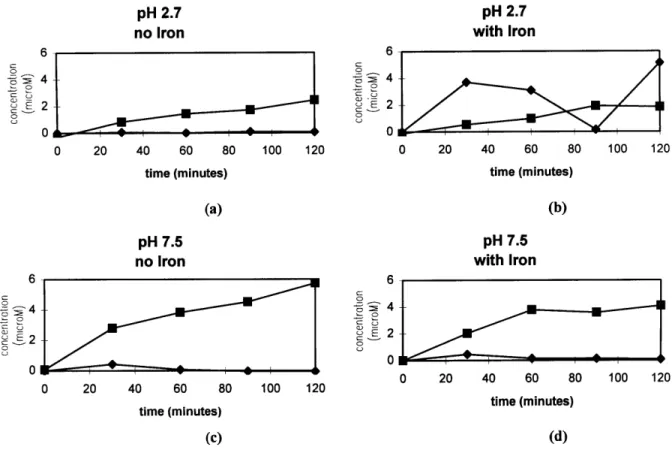
Hydrogen peroxide and ferrous iron measurements were taken every 30 minutes in light exposed samples in an attempt to determine how significant these reactions are in the overall photo-oxidation of humic acid. Results are shown in figure 3.2.1.
pH 2.7 no Iron pH 2.7 with Iron Q) Sg c, C) 42 2 -0 20 40 60 80 100 120 time (minutes) (a) pH 7.5 no Iron 0 20 40 60 80 100 120 time (minutes) 0 20 40 60 80 time (minutes) (b) 100 120 pH 7.5 with Iron 0 20 40 60 80 100 120 time (minutes) (d)
Figure 3.2.1. Graphs of hydrogen peroxide and ferrous iron concentrations versus time
in humic acid solutions. Diamonds represent ferrous iron concentration. Squares represent hydrogen peroxide concentration. The term "with iron" describes humic solutions in which Fe(III) was added. "No iron" describes solutions in which no iron was added. gE 6 4 2 0 v
Hydrogen peroxide concentrations steadily increased throughout the duration of the experiment (fig. 3.2.1). In experiments where no iron was added, the rate of hydrogen peroxide formation was much higher in pH 7.5 solutions. If a linear regression was fit to each curve, the formation of hydrogen peroxide would be around 0.02 tM/min for pH 2.7 and 0.05 pM/min for pH 7.5.
The presence of iron complicates this picture some. Not only is hydrogen peroxide being produced, but it is also reacting with iron. The Fe(III) in the system is being reduced to Fe(II) which then reacts with hydrogen peroxide. In this experiment, the only Fe(II) detected was present in the pH 2.7 samples spiked with iron (Fig. 2.3.1.b). An unexpected drop in Fe(II) concentration was seen 90 minutes into the pH 2.7 experiment in which iron was added. This is most likely due to an error made in the experimental procedure.
Part of the reason Fe(II) is not observed at the higher pH is that the rate Fe(II) oxidation at pH 7.5 is orders of magnitude higher than the rate at pH 2.7. Fe(II) is consumed before it can be measured colorimetrically. The rate of the Fe(II) oxidation via reaction with hydrogen peroxide has been measured by Millero and Sotolongo (1989). Using the empirical equations developed in their study, an estimate of the expected rate of hydroxyl radical formation in the humic acid solutions can be made. This rate constant was estimated to be 130 M-'s' at pH 2.7 and 82000 M's-' at pH 7.5. From the graphs in figure 3.2.1 the steady state concentration of hydrogen peroxide is known to be around 4 rM, the half life of Fe(II) would be on the order of 6 hours in pH 2.7 solutions. This is compared to the 30 seconds in pH 7.5 solutions.
The measurement of hydrogen peroxide and Fe(II) takes several minutes. During this time, Fe(II) present in solution is reacting with hydrogen peroxide. This reaction is
slow in pH 2.7, so it is reasonable to assume that the concentrations of Fe(II) measured in the lower pH solutions is accurate. However not much information can be ascertained about the Fe(II) concentrations in pH 7.5 solutions due to the high rate of the Fe(II)-peroxide reaction. With only 10 jtM total Fe in the solutions, even if all the iron was in Fe(II) form it would oxidize before it could be successfully measured in the pH 7.5 solutions.
So information about the magnitude of hydrogen peroxide formation in iron-spiked samples can be estimated at pH 2.7. Assuming a steady state concentration of 4 pM for peroxide and 2 1M for Fe(II), roughly 4 [tM of hydrogen peroxide must be
produced each hour to maintain the steady state concentrations observed in the pH 2.7 solutions. This is about three times higher than the rate of formation seen in the control
samples in which no iron was added.
Unfortunately, little information can be ascertained concerning the rate of peroxide formation in the pH 7.5 solutions. Due to the speed of the Fe(II) reduction reaction with peroxide, it is impossible to extrapolate what iron concentrations were present in the pH 7.5 samples. Without this knowledge, the rate of hydrogen peroxide formation cannot be calculated.
3.3 Results of bleaching by Fenton's reaction
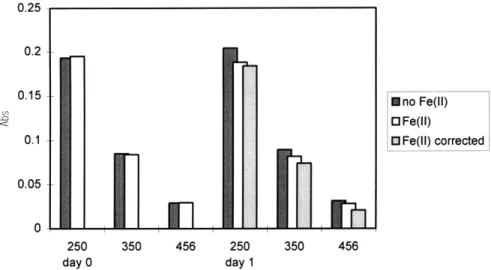
In order to observe the oxidation of humic substances due solely to Fenton's reaction, a pH 2.7 solution of humic acid was spiked with 10 jM Fe(II) and H202. The change in absorption was measured and compared to a solution in which no iron was added. A summary of the results is shown in figure 3.3.1.
There is a visible difference between the solution with and without iron added. After the 24 hour period the absorbance of the solution in which Fe(II) was added was lower than in the solution in which Fe(II) was not. This decrease was greater at larger wavelengths (Figure 3.3.2).
In each case there was an approximate 10% decrease in absorption at each measured wavelength. It should be noted, however, that there was little difference in the absorbance of the solution spiked with iron before the 24 hour period compared to afterwards. Rather, there was an increase in the solution in which no iron was added.
The reason for this is unclear.
Adjustments were made to account for the transformation of colorless Fe(II) into colored Fe(III). If it is assumed that all of the 10 tM Fe(II) in the experiment was converted to Fe(III) by hydrogen peroxide, then there will be a corresponding increase in the humic acid solution due to the presence of iron. This can be subtracted out using the numbers given in the figure 2.6.1.
0.25 0.2 0.15 0.1 0.05 0 250 350 456 250 350 456 day 0 day 1
Figure 3.3.1. Corrected absorbances in 10
with hydrogen peroxide and Fe (II).
mg/L solutions of humic acid at pH 2.7 spiked
Correcting for the assumed presence of 10 pM of Fe(III) significantly increases the change in absorption seen over the course of the 24 hour period (fig. 3.3.2).
35 30 25 20 15 10 5 0 200 250 - - uncorrected --- corrected 300 350 400 450 500 wavelength (nm)
Figure 3.3.2. Percent decrease, both corrected and not corrected, between absorbance in
10 mg/L humic acid solutions with hydrogen peroxide and Fe(II) and with no iron after a period of 1 day.
ino Fe(II) OFe(ll)
Based on rate constants calculated from Millero and Sotolongo's study, it is safe to assume that most of the Fe(II) was transformed to Fe(III) during the 24 hour duration of this experiment. As such, the amount of bleaching observed should be due to the formation of 10 jM of hydroxyl radicals, formed via the conversion of Fe(II) to Fe(III)
by hydrogen peroxide.
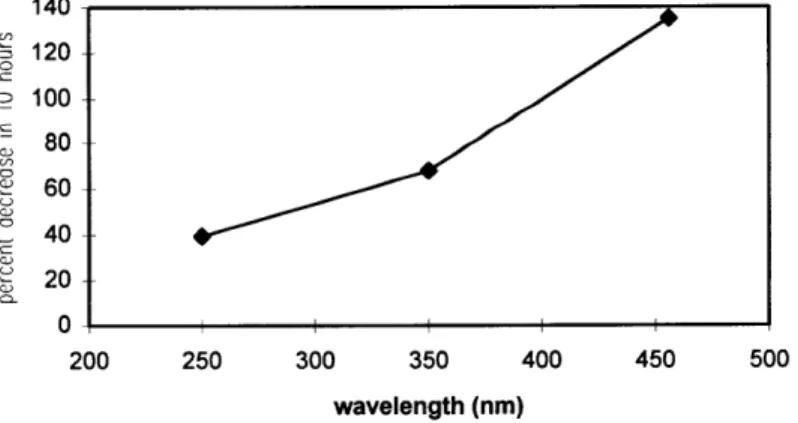
So, based on this experiment we can predict the amount of bleaching which
should occur in the humic acid samples over time. For example, at pH 2.7 the rate of hydrogen peroxide formation is around 4 pM. This means that roughly 4 tM of hydroxyl radicals are produced every hour. Since the effect of 10 p.M of radicals was observed in the above experiment, we can now extrapolate to determine the amount of change one
should expect after 10 hours, assuming a constant rate of hydroxyl radical production. In 10 hours we expect around 40 pM to be produced. So, we should expect four times the bleaching observed in the Fenton experiments. The expected change in humic acid
absorption due to Fenton's reaction over a 10 hour period is shown below in figure 3.3.3.
140 0 120 0 100 80 60 40 20 200 250 300 350 400 450 500 wavelength (nm)
Figure 3.3.3. Expected percent decrease in humic acid absorption due to Fenton's reaction in pH 2.7 solutions.
There are two significant things to note based on these results. The first is that Fenton's reaction may, indeed, be a significant factor in the photobleaching of humic substances. Also of note, one would expect bleaching to occur at a significantly higher rate when higher wavelengths of light are observed.
One must keep in mind that although this experiment provides a lot of information, it is difficult to come to any definite conclusion based on this experiment. The change in absorbance was measured by comparing two humic acid solutions: one spiked with peroxide and Fe(II) and the other spiked with only peroxide. Most of the change observed was due to an unexplainable increase in the absorption of the humic acid solution which only had peroxide in it. Another source of error is the possibility of humic acid sorbing to the walls of the glass vessel in which it was contained, giving the appearance of bleaching. This phenomenon is discussed in more detail in the next section of this thesis. Finally, this experiment was only run once and as such it should be considered only preliminary. Further tests should be performed to determine if the above results are significant.
3.4 Results ofphotobleaching studies
Several experiments were run measuring the rate of photobleaching in solutions of pH 2.7, 4.0, and 7.5. Rates were measured both in the presence and absence of iron. The pH of the systems remained always within 0.25 pH units of the original value. Measurements of absorbance were taken every two hours for samples exposed to UV
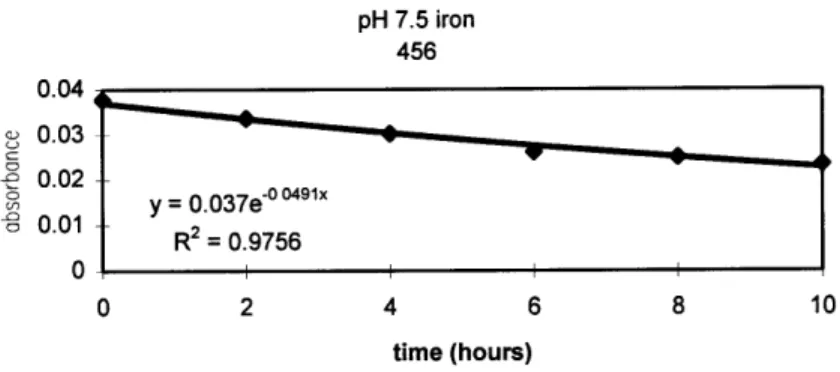
light, and at 6 and 10 hours for the dark controls. Exponential curves were fit to graphs of absorbance versus time of exposure. Exponential curves take the form:
Abst = Absoe-kt (9)
Where k is the exponential decay rate constant. A higher k indicates a higher rate of photobleaching in the humic solutions. Figure 3.4.1 show an example of a typical curve fit. pH 7.5 iron 456 0.04 0.03 - 0.02 y = 0.037e-491x 0.01 - R2 = 0.9756 0 I I 0 2 4 6 8 10 time (hours)
Figure 3.4.1. Example of data obtained from photobleaching experiment. Change in
absorbance at 456 nm over time in a pH 7.5 humic acid solution with iron exposed to UV radiation.
Exponential rate constants were calculated for each experiment. Figure 3.4.2 and 3.4.3 are summaries of the exponential decay constants calculated. Graphs of all the decay curves can be found in appendix A. A table of the mean values, standard deviations, and 95% confidence intervals can be found in appendix B.
No Iron 0.1 - 0.08 0.06 - 0.04 0.02 0 pH 2.7 pH 4.0 pH 7.5 (a) With Iron 0.1 0.08 S0.06 2 0.04 ) 0.02 0 pH 2.7 pH 4.0 pH 7.5 (b) 11250 nm 350 n0 456 nm dark
Figure 3.4.2. Average exponential decay rate constants (hr-1) for humic solutions photobleaching at different pHs and wavelengths. Solid colors represent rate constants in UV exposed solutions.
pH 2.7 light II I 250 300 350 400 450 wavelength pH 4.0 light 0.1 0.08 0.06 0.04 0.02 V 2 0.1 0.08 0.06 0.04 0.02 0 2 00 250 300 350 400 450 500 wavelength (c) pH 7.5 light 00 0.1 0.08 0.06 0.04 0.02 n pH 2.7 dark 200 250 300 350 400 450 500 wavelength 0.1 0.08 0.06 0.04 0.02 200 200 c o o x 250 300 350 400 450 wavelength (e) pH 4.0 dark 250 300 350 400 wavelength 450 500 pH 7.5 dark 0.1 0.08 0.06 0.04 0.02
8
0 200 250 300 350 400 450 500 wavelength (f)Figure 3.4.3. Graphs depicting exponential decay constants (hr') as a function of
wavelength for humic substances photobleaching as function of pH. Circles represent solutions without iron present. Diamonds represent solutions with iron. Filled in symbols represent solutions in which reductant was added prior to measuring absorbance. Lines represent the mean exponential decay rate as a function of wavelength. There is no line for pH 7.5 dark because there was only one point.
c c o , x a, 0.1 0.08 0.06 0.04 0.02 0 200
v#IzA
--oo CIz-zzzzzzz.
m VThe results indicate that the rate of photobleaching increases significantly in the presence of iron at the lower pH values. The effect iron had on the rate of degradation in light exposed samples was proportional to the pH of the solution (Fig. 3.4.4). No significant affect of iron was observed in solutions not exposed to UV light.
0.07 - 0.06 0.05 - 0.04 --- 456 0.03 -- W- 350 - 0.02 250 0.01 0 -0.01 0 2 4 6 8 pH
Figure 3.4.4. Increase in exponential decay constant at different wavelengths as a function of pH due to the presence of iron in UV exposed samples.
The photobleaching rate was different depending on which wavelength of light absorbance was measured. Without iron, the rate of bleaching increased linearly with wavelength (Fig. 3.4.3a, c, and e). However, in the presence of iron the most photobleaching occurred at the 350 wavelength in the pH 4.0 and 2.7 tests. The difference between the exponential decay constants at these three wavelengths, though, was not deemed to be significant using a Student's T test.
One possible explanation behind why there is such a pH and wavelength effect on the rate of humic acid photo-bleaching is the possibility that different chromophores on humic acid seem to preferentially absorb different wavelengths of light. One study by Kouassi and Zika (1990) concluded that the fluorescence of DOM seawater solutions
changed differently depending on what wavelength of light the solution was exposed to. They hypothesized that the results they observed could be attributable to the fact that humic acid contains different chromophoric groups with different photophysical properties.
Another study performed by Vodacek (1992) determined that there was a significant pH dependence on the absorption of light in freshwater DOM samples. They note that acid lakes emit shorter wavelengths of light when they fluoresce compared to more neutral lakes. They believe that this phenomenon can be explained by the pH dependence of the oxidation process. Their conclusions state that the photo-oxidation of CDOM should be inhibited at lower pH.
One issue that may affect the apparent rate of photobleaching in the humic solutions is the transformation of colored Fe(III) into colorless Fe(II) during the course of the experiment. This change in color may erroneously increase the calculated rate of photobleaching in the experiments. However, the bleaching observed in the photo-oxidized samples is significantly greater than the loss of color one would get if all the Fe(III) was converted to Fe(II) in many cases (Fig. 3.3.5).
One should be careful of the cases where the loss of color due to Fe(III) conversion into Fe(II) is significant. In particular, the absorbance of iron seems to increase as pH increases. This may be due to light scattering caused by iron oxide particulates, which form at higher pH values. However, measurements indicate that not all the iron present in the samples was in Fe(II) form at the time of the measurements. Since iron is constantly cycling between its Fe(II) and Fe(III) forms, it is more likely that there was some unknown fraction of the iron was in Fe(II) form.
The addition of reductant to the sample before measuring the absorption would correct for this loss of color at lower pH values where the oxidation of Fe(II) back to Fe(III) by hydrogen peroxide is slow. However, problems were encountered when reductant was added to some of the humic acid samples. Many of the solutions showed a higher degree of scatter when reductant was added. One possible explanation is that the humic acid was interfering with the reductant. However, this does not explain why this scatter was only seen in some of the curves. In the few experiments where this scatter was not seen, the reductant decreased the rate of photo-bleaching, but the rate constants calculated were still around the same value as in experiments where no reductant was added.
0.09 0.08 0.07 0.06 - 0.05 0.04 0.03 0.02 -0.01 pH 2.7 pH 4.0 pH 7.5
l250nm
350
nm
456
nm
e(III)Figure 3.4.5. Average change in absorbance observed over a ten hour period compared to the loss in absorbance one would expect if all Fe(III) was converted to Fe(II)
Finally, there was some observed loss of color in the dark control samples. This loss rate is much higher than the rate of oxidation expected based on oxygen consumption results in dark control experiments conducted Miles and Brezonik. This loss of color depended neither on pH nor the wavelength of light observed. One possible explanation is that humic substances are sticking to the walls of the test tubes, hence going out of solution.
3.5 The overall picture
Now that each individual experiment has been analyzed in detail, it is important to examine the experiments as a whole to determine what can be ascertained about the overall photobleaching picture.
Oxygen is consumed through DOM photo-oxidation to produce superoxide radicals (eqn 1.2-a). In the first set of experiments, it was determined that the rate of oxygen consumption was too small to observe using the adapted Winkler method. In fact, the oxygen consumption rate in the solutions had to be below 4 tM/hr, because anything higher would be detected despite the scatter of the oxygen measurements.
The radicals formed in oxygen consumption reacts to form hydrogen peroxide (eqn 1.2-b). Therefore, hydrogen peroxide formation can be used as a gauge of the rate of photo-oxidation. Through the measurement of hydrogen peroxide formation under the same conditions, we see that the oxygen consumption rate is indeed smaller than this extrapolated value. The rates calculated using hydrogen peroxide formation were
actually 1.2 jIM/hr for pH 2.7 solutions and 3 jtM/hr for pH 7.5 solutions in the absence of iron. The rate of peroxide formation increased when iron was added. Even so, the rate of formation was around 4 tM/hr in pH 2.7 solutions, just at the estimated detection limit of oxygen consumption. The consumption of oxygen is roughly twice the consumption of peroxide. Even so, the consumption rates observed are still around the detection limit of the experiment. So, the fact that no oxygen consumption was observed in the prepared solutions makes sense.
Due to the low oxygen consumption in the solutions, it was difficult to ascertain the effect iron had on the overall photo-oxidation process. Gauging from peroxide measurements, iron was demonstrated to have a significant affect on the rate of photo-oxidation at pH 2.7. This agrees with results from Miles and Brezonik's study which stated that this would occur.
Unfortunately no information can be obtained on the rate of photo-oxidation at pH 7.5. If photo-oxidation is affected by iron in the same manner as photo-bleaching, one would expect high oxidation rates in lower pH solutions. In addition, because superoxide also reacts with Fe(II) the stoichiometry of the peroxide formation from superoxide becomes more complicated. Therefore, it is difficult to compare iron effects on photobleaching with its effect on photo-oxidation. Further refinement of the both the oxygen and peroxide measuring process needs to be made before such an analysis can occur.
Results of the Fenton's reaction experiment suggested that photo-oxidation due to hydroxyl radicals may be extremely significant in the photobleaching process.
Extrapolation from the results of the Fenton experiment indicate that a high percentage of the humic acid should be photobleached over the 10 hour experiments conducted in section 3.4. If Fenton's reaction dominates the photobleaching process, then one would expect a higher rate of photobleaching at higher observed wavelengths.
However, the exact opposite was observed when the photobleaching experiments were conducted. The rate constant did not increase with increasing wavelength. In addition, the observed decrease in humic acid absorption over the ten hour period was much smaller than predictions made by extrapolating the results of the Fenton's
experiment. One should keep in mind the danger of extrapolating the Fenton's reaction experiment, which represents around 2 hours of bleaching, to the 10 hour experiments preformed in the photobleaching experiments. Such extrapolation assumes that bleaching will be linear throughout the duration of the experiment. If more chromophores are consumed during the first few hours of the experiment, then this assumption will not be correct.
A more accurate way of comparing the Fenton's experiment with the photobleaching results is to estimate the amount of bleaching that would occur after 10 jM of radicals are produced. This roughly corresponds to three hours in pH 2.7
solutions. Using the rate constants estimated in section 3.4, the amount of bleaching after three hours can be estimated. A comparison of the results is shown in figure 3.5.1.
35 30 25 20 -4-- Fenton's --- Observed 15 C10 5 0 I 200 250 300 350 400 450 500 wavelength
Figure 3.5.1. Percent photobleaching expected from the Fenton's study after three hours
in pH 2.7 humic acid solutions with iron compared to actual observed values.
The results of this comparison are much more reasonable. The effects of wavelength roughly corresponded at the two lower wavelengths. Although the predicted pattern did not hold at 456 nm, the difference is well within the 95% confidence interval for this value. These results suggests two things. The first is that the bleaching process is indeed not linear. Whereas the 10 hour linear extrapolations do not agree, the three hour comparisons do. The second conclusion is that Fenton's reaction may indeed be significant in the photo-bleaching of humic substances.
One important factor to keep in mind is that the Fenton's experiment was only conducted once, and there was reason to suspect the data obtained from this one trial. If substantive conclusions are to be made concerning the role of Fenton's reaction in photobleaching, further studies will be needed.
4. Conclusions
The presence of 10 !M Fe(III) was found to significantly increase the rate of humic acid photobleaching. The increase was larger for lower pHs. Additionally, the rate of photobleaching was found to be dependent on the wavelength observed when measuring absorption. Studies which attempted to observe iron effects on photo-oxidation were unsuccessful due to high scatter in the experimental method used. As a result, it was difficult to compare iron effects on photobleaching to iron effects on photo-oxidation.
The experiments conducted to ascertain information about the mechanism by which photobleaching occurs, indicated that Fenton's reaction may be significant in the photobleaching process. Further examination of the photobleaching results seems to agree with this assessment. However, the results were not conclusive, and further studies are needed to corroborate these findings.
There are several paths one could take to continue this research. More information is needed on the rate of humic acid photo-oxidation in stream and lake conditions. Although there was too much scatter in the oxygen measurements performed in this study, further refinement of the adapted-Winkler method could improve the oxygen consumption measurements needed to draw substantive conclusions. Once this information is obtained, it is necessary to compare Fe(III) effects on photo-oxidation to Fe(III) effects on photobleaching.
There are a multitude of studies which can be performed to examine the mechanism by which photobleaching primarily occurs. The experiments concerning
Fenton's reaction performed in this study are cursory at best, and there is still much to be learned about the significance of this one reaction. Fenton's reaction is one of several mechanisms that may occur when iron is introduced into a humic system. Each of these mechanisms should be studied in detail if a full understanding of the photobleaching phenomenon is to be obtained.
Finally, there are many studies which can be conducted to further examine the photobleaching phenomenon, itself. It would be useful to quantify how the rate of photobleaching is affected by iron concentration. Further studies could be conducted to examine how humic acid degrades when subjected to specific wavelengths of light. If there is preferential photobleaching based on what wavelengths of light are entering an aquatic system, then one would expect different photobleaching effects when subjected to different wavelengths. Finally, these studies should also be conducted under more natural light conditions to determine if the effects seen in these studies will be significant in the environment.
Although there are still many things not known about the mechanisms behind photobleaching, the phenomenon of photobleaching itself has been documented in the natural setting. The increases in UV anticipated due to thinning in the ozone layer could have dire consequences in aquatic environments. Aquatic organisms which rely on the presence of DOM to shield them from harmful UV light will feel twice the effect than their terrestrial cousins. Not only will the amount of UV light entering the system be greater, but the increase in UV will decrease the amount of DOM shielding. Because of these potential effects on the environment, it is very important to understand the
multitude of factors which play a role in controlling DOM photobleaching, a phenomenon in which iron is just one player.