Economic Modeling of Intermittency in Wind Power Generation
byAlan Yung Chen Cheng
A.B., Engineering Sciences Modified with Environmental Policy - Dartmouth College, 2003 B.E., Environmental Engineering - Dartmouth Thayer School of Engineering, 2003
Submitted to the Engineering Systems Division and the Department of Civil and Environmental Engineering in partial fulfillment of the requirements for the degrees of
Master of Science in Technology and Policy Master of Science in Technology and Policy
and Master of Science in Civil and Environmental Engineering at the
Massachusetts Institute of Technology inme 2005
O 2005 Massachusetts Institute of Technology. All rights reserved.
A _ T
Signature of Author
Engineering stems Did Department of Civil and Environmental En ring
May 13, 2005
Certified by
gCertified
by "'' 'i
!Henry D.
Jacoby
Co-Director, MIT Joint Program on the Science and Policy of Global Change Professor, Sloan School of Management Thesis Supervisor
Certified by
DavidH. Marks Morton and Claire Goulder Family Professor of Civil and Environmental Engineering & Engineering Systems Director, Laboratory for Energy and the Environment
j p
s
Thesis ReaderAccepted by
Andrew J. Whittle Professor of Civil and Environmental Engineering Chairman, Departmental Committee for Graduate Students
Accepted by
-Accpte Dava J. Newman Professor of Aeronautic and Astronautics and Engineering Systems Director, Technology and Policy Program I' IWY
LIBRARIES
Economic Modeling of Intermittency in Wind Power Generation
byAlan Yung Chen Cheng
Submitted to the Engineering Systems Division and
the Department of Civil and Environmental Engineering on May 13, 2005 in partial fulfillment of the requirements for
the Degrees of Master of Science in Technology and Policy and Master of Science in Civil and Environmental Engineering
Abstract:
The electricity sector is a major source of carbon dioxide emissions that contribute to global climate change. Over the past decade wind energy has steadily emerged as a potential source for large-scale, low carbon energy. As wind power generation increases around the world, there is increasing interest in the impacts of adding intermittent power to the electricity grid and the potential costs of compensating for the intermittency.
The goal of this thesis research is to assess the costs and potential of wind power as a greenhouse gas abatement option for electricity generation. Qualitative and quantitative analysis methods are used to evaluate the challenges involved in integrating intermittent generation into the electricity sector. A computable generation equilibrium model was developed to explicitly account for the impacts of increasing wind penetration on the capacity value given to wind. The model also accounts for the impacts of wind quality and geographic diversity on electricity generation, and the impacts of learning-by-doing on the total cost of production. We notice that the rising costs associated of intermittency will limit the ability of wind to take a large share of the electricity market. As wind penetration increases, a greater cost is imposed on the wind generator in order to compensate for the intermittency impacts, making the total cost from energy from wind more expensive. Because the model explicitly accounts for the impacts of intermittency, the decision to add wind power to the grid is based on the marginal cost of adding additional intermittent sources to the system in addition to the cost of generating wind energy
This model was incorporated into the MIT Emissions Prediction and Policy Analysis model in order to analyze the adoption of wind technology under three policy scenarios. In a business as usual scenario with no wind subsidies or carbon constraints, wind energy generation rises to 0.80 trillion KWh in 2090 and accounts for 9% of the total electricity generation. In a scenario that stabilized greenhouse gases at 550 parts per million, high carbon penalties motivate the entry of 1.16 trillion KWh of wind energy generation in 2055 that accounts for 22% of the total electricity generation. With a production tax credit subsidy for wind generation, wind energy generation increases by average of 12% over the base case scenario during the years the policy was in effect. However, when the subsidy tapers off, wind generation in later periods remains unchanged.
Thesis Supervisor: Henry D. Jacoby
Acknowledgements:
I would like to begin by acknowledging my research supervisor and mentor Professor Jake Jacoby. His constant support of my research endeavors, and unwavering confidence in me and in this research topic, have been key contributors to my success as a graduate student as well as to the success of this thesis. His passion for the research and his sense of balance in work and life has made the past several years
enjoyable both professionally and personally.
My work here at MIT is constantly shaped by my interaction with the Joint Program on the Science and Policy of Global Change. I wish to thank all of the faculty, staff and students of the Program for providing a supportive, interactive and dynamic research environment. In particular, I wish to thank Sergey Paltsev and Jim McFarland for always leaving their doors open and always guiding me as I made my way through the EPPA model. I would not have made it without your help. Therese, thank you for always looking after me. I could not have possibly asked for more. Professors Bill Nuttall and David Reiner, thank you for so warmly welcoming me to England. The opportunities I had at the University of Cambridge have not only help my research here but have also inspired me to teach and to grow as an educator.
One of the wonderful aspects of MIT is the incredibly brilliant and dedicated students it attracts. My fellow graduate students at the Joint Program and at TPP have been my friends, colleagues and teachers at the same time. Travis, Kira, Dulles, Ram, (and Misha), thank you for the intellectual inspiration and for the comic relief.
In closing, I would like to thank my family for their continuing support. It has not been easy; moving to a new country, picking up a foreign language and starting new professions. I cannot thank them enough for the many sacrifices they made along the way. I know it was a dream of theirs for me to graduate from MIT. I hope that my next stage in life will make them just as proud.
Table of Contents:
Abstract: ... 3
A cknow ledgem ents: ...5
Table of Contents: ... 6
Table of Figures: ... 7
CHAPTER 1: Introduction and Background ... 9
1 Introduction ...9
1.1 The Growth of Wind ...9
1.2 Current Policies Affecting Wind ... 10
1.2.1 Fixed price policies... 10
1.2.2 Fixed quantity policies ... 1
1.2.3 Emissions Trading Schemes ... 12
1.2.4 Wind Policies in the United States ... 12
1.2.5 Renewables Policies in the European Union ... 14
1.2.6 Renewables Policies in Japan ... 14
1.3 Dealing with Intermittency in Wind ... 15
1.4 Outline of Thesis ... 16
CHAPTER 2: The Challenge of Coping with Intermittency ... ... 17
2 Introduction - Impacts of Integrating Wind ... 17
2.1 Utility Power Planning and System Reliability ... 18
2.2 Valuing Wind Energy Contributions ... 19
2.3 Capacity Credit and Wind Penetration ... 21
2.4 The Role of Storage ... 23
2.4.1 Pumped hydro storage ... 24
2.4.2 Compressed air energy storage ... 24
2.4.3 Advanced battery energy storage (BES) ... 25
2.5 Approach of Other Models ... 25
2.5.1 MARKAL - International Energy Agency (IEA) ... 25
2.5.2 MiniCAM 2001 - Pacific Northwest National Laboratory (PNNL) ... 25
2.5.3 NEMS - Energy Information Agency (EIA) ... 26
2.5.4 WinDS - National Renewable Energy Laboratory (NREL) ... 26
CHAPTER 3: Modeling Intermittent Sources in a General Equilibrium Context ...29
3 Why General Equilibrium Models ... 29
3.1 The Structure of the MIT EPPA Model ... 29
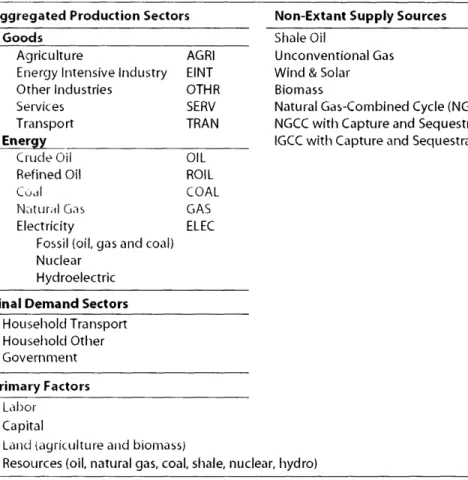
3.1.1 Aggregate Production Sectors ... 30
3.1.2 Modeling Non-extant Supply Options ... 32
3.2 Modeling Intermittent Energy as Perfect Substitutes ... 33
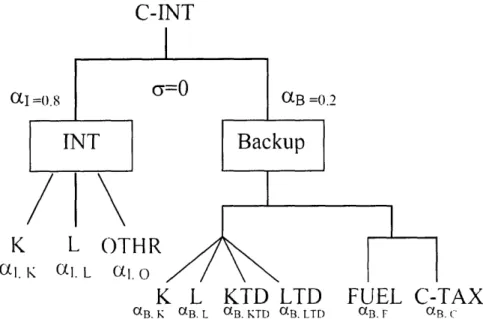
3.2.1 Composition of C-INT ... 34
3.2.2 Composition of INT and Backup ... 35
3.3 Mark-Ups Affecting Scale Up of Wind in the Model ... 36
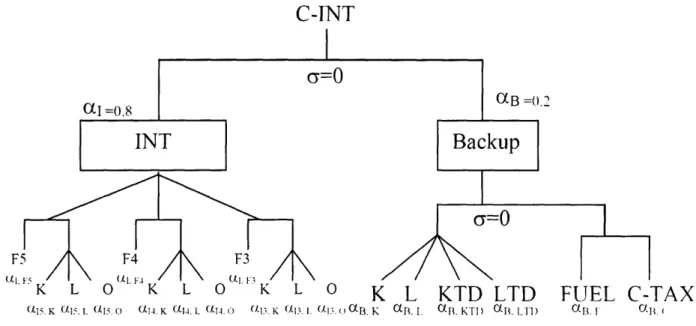
3.3.1 Wind Quality and Geographic Diversity of Power Sites ... 37
3.3.2 Penetration Level Mark-ups ... 39
3.3.3 Experience and Learning Mark-ups ... 40
CHAPTER 4: Results from the MIT EPPA Model ... 43
4 Introduction - Description of Cases ... 43
4.1 Scenario I - Business as Usual ... 44
4.2 Scenario 2 - 550 GHG Stabilization ... 49
4.3 Scenario 3 - Production Tax Credit . ... ... 54
CHAPTER 5: Summary and Discussion ... 57
References
...
59
6Table of Figures:
Figure I - Renewable Electricity Standards (WindIndustry, 2005) ... 13
Figure 2 - Effective load carrying capacity of wind energy conversion systems (WECS) ...22
Figure 3 - Summary of Energy Models (US EPA, Renewable Energy Modeling Series, 2003) ...28
Figure 4 - Regional Structure of EPPA 4 ... 30
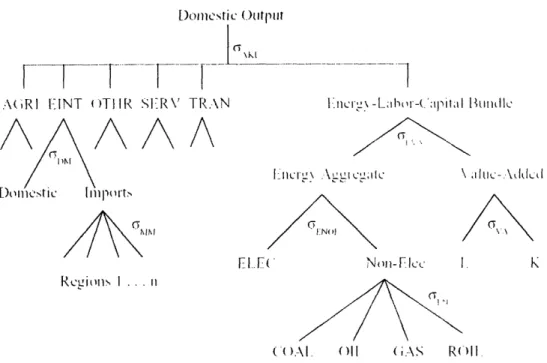
Figure 5 - Production Structure of the EPPA Model ... 31
Figure 6 - Production Structure of EINT and OTHR Sectors ... 32
Figure 7 - Wind Power as an Imperfect Substitute ... 33
Figure 8 - Wind Power as an Imperfect Substitute (Partial Capacity Credit) ...34
Figure 9 - Composition of C-INT ... 34
Figure 10 - Cost Inputs to INT and Backup ... 36
Figure 11 - Classes of Wind Power Density ... 37
Figure 12 - Wind Class Disaggregation ... 38
Figure 13 - ELCC and Markup Due to Wind Penetration ... 40
Figure 14 - Markup due to Learning ... 42
Figure 15 - EUR Electricity Generation - BAU Scenario ... 44
Figure 16 - Total Electricity Generation (By Technology) - BAU Scenario ...45
Figure 17 - Wind Generation (by Input Cost Share) - BAU Scenario ... 46
Figure 18 - Wind Generation (by Input %) - BAU Scenario ...48
Figure 19 - Electricity Generation - 550 Stabilization ... 49
Figure 20 - EUR Electricity Generation (TKWh) - 550 GHG & BAU ...50
Figure 21 - Wind Share of Total Electricity Generation - 550 & BAU ... 51
Figure 22 - Cost Percentages for Wind - 550 Stabilization ... 52
Figure 23 - Cost Structure for Wind - 550 Stabilization ... 53
Figure 24 - EUR Electricity Generation (TKWh) - PTC ... 54
Figure 25 - EUR Electricity Generation (TKWh) - BAU & PTC ...55
Figure 26 - Wind Share of Total Electricity Generation (BAU, PTC) ... 56
CHAPTER 1: Introduction and Background
I IntroductionThe electricity sector is a major source of the carbon dioxide emissions that contribute to global climate change. In the United States, electricity generators fired by fossil fuels are responsible for roughly 40% of all human carbon dioxide emissions (EIA, 2004). Potential climate impacts, coupled with the growing demand for electricity in both developed and developing countries, are motivating a shift towards less CO2-intensive generation technologies. Switching a substantial fraction of U.S. electricity generating capacity from fossil fuels to renewable technologies such as geothermal, biomass, or wind-powered turbines would help to reduce carbon emissions from this sector. In addition to the reduced environmental impacts, energy from renewable resources increases our overall fuel diversity and lessens our dependence on fossil fuels. This diversification is particularly important because fossil fuels such as oil and gas are often subject to rapid price fluctuations and supply problems. Regrettably, after decades of development renewables remain a small share of existing electricity markets because of their relatively high cost.
1.1 The Growth of Wind
Spurned by the massive oil crises in the 1970s, solar, wind and wave energy were hailed as nature's ultimate answer to our energy needs. They did not contribute to air pollution and were considered
unlimited in supply. The US Department of Energy made significant investments to develop these
renewable energy technologies. As it turned out, when concerns over oil security leveled off in the 1980s, research funding greatly diminished. Additionally, technological challenges and regulatory obstacles have made it difficult for renewable energies to compete with conventional technologies. As a result, the per kWh cost of solar energy is remains much too high to be competitive with traditional energy sources, and wave and tidal energy has not faired any better.2
Fortunately, out of the three technologies wind energy has taken off. Great strides have been made over the past two decades in improving the reliability, cost-effectiveness and overall understanding of wind energy. The global wind power industry installed 7,980 megawatts (MW) in 2004, resulting in a total installed generating capacity of 47,300 MW (GWEC, 2005). Penetration levels in the electricity sector have reached 20% in Denmark and about 5% in both Germany and Spain (GWEC, 2005). The north German state of Schleswig-Holstein has 1,800 MW of installed wind capacity, enough to meet 30%
I In the United States, solar, wind and geothermal sources account for less than 1% of total energy consumption (EIA, 2004).
2 Because of limited experience with marine renewables, it is difficult to be certain how economic they will be if developed to a mature stage. There is also limited experience with tidal barrages; only one large-scale complex of this kind has been constructed to date at La Rance in France. Most marine energy is too diffuse and too far from where it is needed to be economically exploited (Fraenkel, 1999, UNDP-WEC, 2000).
of the region's total electricity demand, while in Navarra Spain 50% of electricity consumption is met by wind power.
With continuous improvements in efficiency and reductions in capital cost, the per kWh cost of wind energy has declined by approximately 8 percent per year throughout the 1990s (DWEA, 2003). Larger turbine sizes, lower costs, public policy support and bigger wind farms all have enabled wind capacity to grow at an average annual rate of 35 percent over the past several years (DWEA, 2003). However, in spite of these improvements, significant barriers remain which must be overcome before wind energy can achieve substantial adoption within the general electricity market. The most significant of which is the cost of production. The next section highlights some of the current policies that meant to lower the costs and incentivize wind energy generation.
1.2 Current Policies Affecting Wind
Under current production costs, wind is only economically competitive in a few niche markets. Much of the growth we have seen in recent years is due to favorable policies that have incentivized wind energy generation. As the industry grows it will continue to depend on these policies. In this section, I discuss some of the current policies in place that are intended to affect investments and growth in wind energy. First, I outline the three different types of wind incentive systems: fixed-price systems, fix-quantity systems and emissions trading schemes. Then I look at three different regions: the United States, the European Union and Japan, to see how these policies have been implemented and their preliminary successes and failures. Later in this thesis we will build off of this discussion and present the results from several "policy cases" that reflect what we may expect to see in the future.
1.2.1 Fixed price policies
Under fixed price policies government sets electricity prices, or some cases price premiums, paid to the power producer and the market determines the quantity of electricity produced. There are four general variations of policies: investment subsidies, feed-in tariffs, fixed premium systems and production subsidies. They are described below.
Investment Subsidies - These are subsidies for investment that are given on the basis of rated
power. These were some of the first subsidies in place and did not take into consideration the actual plant productivity. As a result, many large wind farms got built regardless of whether they actually produced power. Recent subsidies have come in the form of production tax credits. These tax credits are not based on rated power but instead is given for actual electricity produced. An analysis of a production tax credit is presented in Chapter 4.
Fixed Feed-in Tariffs - Here, operators are paid a fixed price for every kWh of electricity they
feed into the grid. The incentive is currently used in Germany where legislation fixes the price of
electricity from renewable energy sources in relation to the generation costs of renewable technologies. It encourages advance planning because it is relatively straightforward.
Fixed Premium Systems - These systems are similar to the feed-in tariffs except in this case the
government fixes a premium to be added to the electricity price. This premium is supposed to reflect the external costs of conventional power generation. In actuality, countries that pass the fixed premium legislation still base their premiums in a manner to offset the estimated renewable electricity production costs relative to conventional generation rather than on the actual environmental benefit.
Surcharge-Funded Production Subsidy - Under this approach, consumers pay a surcharge on
all electricity purchases, and the revenue from the surcharge is distributed to renewable generators on a per-kilowatt-hour basis for each unit of electricity produced. The recipients of these payments and the level of the payments are determined in a periodic auction where the winners are those who bid the smallest increment of subsidy required per kilowatt-hour.
1.2.2 Fixed quantity policies
Under these policies the government sets the quantity of renewable electricity desired and leaves it to the market to determine how to meet those demands. The three main variations are renewable portfolio standards, tradable green certificates and tendering systems.
Renewable Portfolio Standards - These standards are requirements that a minimum percentage
of the electricity produced or sold in the region must come from renewable sources, typically excluding hydroelectric facilities. A number national renewables portfolio standards ranging from 5% to 20% have been proposed for different countries. Some regions have implemented nonbinding generation targets for wholesale electricity suppliers.
Tradable Green Certificates - In an extension of the portfolio standards, generators under this
system are obligated to supply a certain percentage of electricity from renewable energy sources. Retailers must purchase renewable certificates to show compliance with their obligation or else they are subject to a penalty for any shortfall. The prices are then settled on daily electricity market subject to meeting these minimum requirements. One possible complication with relying on this type of policy is that penetration of renewables becomes independent of the technical progress and the increasing
efficiency of scale of the technology. Even if wind farms become marginally cheaper to install, it will be unlikely that the industry will want to install more to go beyond the minimum requirement.
Tendering System - This approach typically takes the form of a solicitation by a governmental
energy agency, regulator, or regulated utility (under regulatory or legal requirement) for bids to supply a limited wind energy capacity in a given period. The power purchase agreements are usually for a 15 to 20 year period and the price is agreed upon a definite period, which removes political risk for the investors.
1.2.3 Emissions Trading Schemes
The Emissions Trading Scheme (ETS) is one of the key policies and measures developed under the European Climate Change Programme to ensure that the European Union and Member States limit or reduce emissions of climate-changing greenhouse gases in line with their commitments under the Kyoto Protocol. The EU greenhouse gas Emissions Trading Scheme began on 1 January 2005. The scheme is restricted to only one of the greenhouse gases - carbon dioxide - and to energy and industrial sectors. ETS lays the foundation for an electronic registry system that will keep track of the ownership of emission allowances as they change hands in the market. Under the system, emitters are set CO2 limits
and either pay a fine or buy permits from firms that undershoot their targets. The permit trading involves nearly 5,000 European companies within the industry and energy sector, which account for 46% of all EU carbon dioxide emissions.
The trading scheme will indirectly affect renewables in that ETS by itself will not guarantee that renewable targets will be reached as the policies only covers the greenhouse gas benefits of renewables. The philosophy behind emissions trading is that greenhouse gas reductions should be made at the lowest possible cost to society. With the lenient constraints, emissions trading will most likely have little impact on the profitability of investing in wind energy in the short term and it will have no impact on renewable energy technologies competitiveness vis-A-vis fossil fuel technologies. In the longer term, as the quotas are tightened (and/or free allocation is replaced by auctioning of allowances), and some of the "once-in-a-life-time" options, such as switching to gas and increasing efficiency, have been utilized, wind power and other renewable energy sources could benefit from a higher emissions allowance price and higher alternative abatement costs. An analysis of an emissions trading scheme that includes all greenhouse gases and its impacts on wind energy generation will be presented in Chapter 4.
1.2.4 Wind Policies in the United States
Here we begin to discuss the current policies in specific regions. In theory, one way to motivate a shift away from fossil fuels toward renewables would be to tax or cap carbon emissions from electricity generators. However, policy makers have not embraced carbon taxes as a means of controlling emission, and they are unlikely to be adopted in the United States. Even if a national carbon tax were adopted in the United States, it is likely to start out small and increase in size over time (Burtraw and Palmer, 2004). Similarly, aggregate emission caps coupled with emission trading are likely to start with modest reductions. The "slow, stop, reverse" approach to carbon mitigation has become a central tenet of U.S. policy debate. Modest emission reduction targets in the near term are expected to be met with modest
substitution away from coal to expanded use of natural gas, with very small incentives for greater
renewables use in the short run. Political preference for the go slow approach suggests that a policy aimed directly at increasing renewables may be necessary to realize any gains from learning-by-doing and to
achieve substantial contributions from renewables, which will be necessary to achieve more substantial emission reduction goals in the long term.
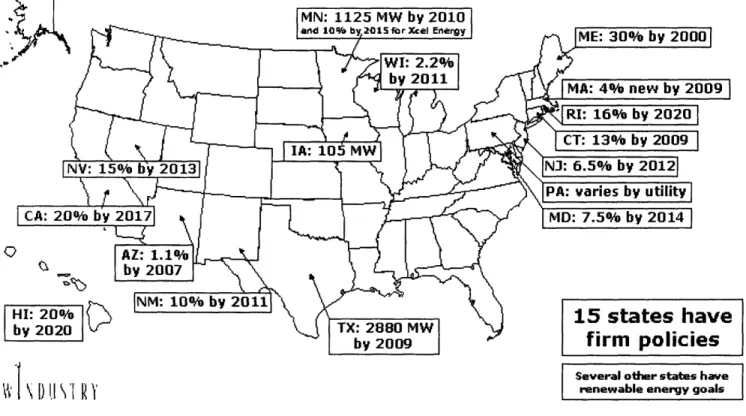
Several approaches are currently being used or considered to promote the use of renewables for electricity generation in the United States. A number of states - including Connecticut, Maine, Nevada, Massachusetts, New Jersey, Iowa and Pennsylvania - have adopted renewables portfolio standards (RPS) but the wind adoption in these states (and in the US in general) have been modest (EIA, 2004). These states are highlighted below in Figure 1. A number of bills proposing national renewables portfolio standards ranging from 5% to 20% by different deadlines-ranging from 2010 to 2020-have been debated before the U.S. Congress in recent years, but none has been passed into law.
'S.
Several other states havE
~WI~~
\s~~~~~~~ I~)\
~renewable
|~~ energy goalsFigure I - Renewable Electricity Standards (WindIndustry, 2005)
The wind energy production tax credit (PTC), a per kilowatt-hour tax credit for wind-generated electricity, is another approach that has been popular at the federal and state levels (Burtraw and Palmer, 2004). Available during the first 10 years of operation, it provides 1.5 cents per kWh credit adjusted annually for inflation. The adjusted credit amount for 2004 is 1.8 cents per kWh. Enacted as part of the Energy Policy Act of 1992, the credit has gone through several cycles of expiration and renewal. In the latest round, the PTC expired at the end of 2003 and later was renewed retroactively through the end of 2005. The inconsistent nature of this tax credit has been a significant challenge for the wind industry, creating uncertainty for long term planning and preventing steady market development. Some states, such
13
as California, have adopted another approach known as a surcharge-funded production subsidy. As described above, under this system consumers pay a surcharge on all electricity purchases, and the revenue from the surcharge is distributed to renewable generators on a per-kilowatt-hour basis for each unit of electricity produced.
1.2.5 Renewables Policies in the European Union
Renewable portfolio mandates are also becoming more popular in Europe. The European Union issued a Renewables Directive in October of 2001 that requires Member States to adopt national targets for renewables consistent with reaching the overall EU target that 12% of total energy and 22% of all electricity come from renewables by 2010. For the United Kingdom, the directive requires that 10% of total electricity consumption be generated using renewables by 2010.3 The United Kingdom has decided to implement a tradable credit scheme to help in achieving this goal, moving away from a subsidy scheme that had been used earlier.
In addition to implementing a quantity-based approach, several countries in Europe and elsewhere also have used a price guarantee, often referred to as a feed-in tariff, to promote the use of renewables. Germany's initial feed-in tariff law was in effect from 1990 until 2000. The total amount of the tariff payment each year was based on utility average revenues, so the payments would fluctuate by year. The feed-in tariff approach has been successful in promoting wind energy; in 2000 a new feed-in tariff law took effect to help Germany achieve its goal of doubling renewables share from 6% to 12% by 2010. Under the new law, grid operators, instead of utilities, pay the feed-in tariffs and the level of the payment depends on renewable type.
The third major approach to promoting renewables used in Europe is the competitive tender offer or bidding system. However, this does result in complications related to investors "gaming" the system. Examples in the UK have shown that when contractors win the bid they often wait as long as possible to build, thus lowering the production costs (DWEA, 2003). This approach is currently implemented in
Ireland, France, and the UK.
1.2.6 Renewables Policies in Japan
In Japan renewable electricity generation is covered by broader-based policies that have been adopted to promote a large category of underdeveloped energy resources, known as New Energy, throughout the economy. New Energy sources include most renewables, natural-gas-fired cogeneration, and fuel cells, but exclude hydro and geothermal. Currently, Japan has a target of achieving 3.1% of total primary energy supply from New Energy sources by 2010. According to the International Energy
Agency, there are also targets for increased market penetration of specific renewable technologies in
3 Different targets are set for different member states based on current renewable generation and potential resources available locally.
2010, including a 20-fold increase in wind capacity, a 14-fold increase in photovoltaic capacity, and a five-fold increase in biomass capacity.4
In 2002, Japan adopted the Special Measures Law Concerning the Use of New Energy by Electric Utilities. This law includes annual renewable penetration targets for electricity generators for the years between 2003 and 2010 and has a long-term goal of 1.35% of total electricity generation by 2010. The types of energy covered by this policy include solar, wind, biomass, small hydro, and geothermal.
The Japanese RPS policy is similar to those used in the United States and elsewhere. Electricity retailers are responsible for meeting the RPS, which will ramp up over time. Certified renewables
producers receive credits for "Applicable Amounts of New Energy Electricity" that they can sell bundled with electricity-to-electricity retailers or trade separately on the renewables credit market. Renewables credits are bankable for up to one year and retailers are free to borrow up to 20% of their obligation in a current year from the subsequent year. Retailers who fail to comply with the renewables requirements will face penalties. However, there is a price cap of 11 yen per kWh on the price of renewables credits and retailers who cannot purchase credits for that price are exempt from fines (Keiko, 2003). Japan also has a national program to subsidize increased use of renewables by local governments and by small business, and a substantial program to support research and development into renewable technologies.
1.3 Dealing with Intermittency in Wind
Production cost limitations are further complicated by an additional challenge, intermittency. Wind power is generated only when the wind blows, and this intermittency is at the heart of many important wind integration issues and the focus of this thesis. Wind power is variable and thus not as easily scheduled or controlled as thermal, nuclear, fossil or hydroelectric generators. Even high-performing wind installations have relatively low annual capacity factors of between 20 and 40 percent (DWEA, 2003).5
Until recently, most of the world's wind power facilities consisted of one or two turbines interconnected with the local distribution network, but increasingly the growth in wind generation capacity is achieved through large wind farms interconnected to high voltage regional transmission
systems. Small wind installations on low voltage networks have posed little or no threat to grid reliability. However, faced with the likelihood of substantial additional wind generation capacity to meet energy and environmental policy goals within the next ten years, many planners in major energy markets are
4 See htt ://library.iea.org/dbtw-wpd/pamsdbre.aspx'?id=90,accessed February 18, 2005.
5 Although one would generally prefer to have a large capacity factor, it may not always be an economic advantage. In a very windy location, for instance, it may be an advantage to use a larger generator with the same rotor diameter This would tend to lower the capacity factor (using less of the capacity of a relatively larger generator), but it may
mean a substantially larger annual production. To a certain extent you may have a choice between a relatively stable power output (close to the design limit of the generator) with a high capacity factor - or a high energy output (which will fluctuate) with a low capacity factor.
evaluating wind integration strategies to help ensure that their power systems also remain stable and reliable.
1.4 Outline of Thesis
The goal of this thesis research is to assess the costs and potential of wind power as a greenhouse gas abatement option for electricity generation. Qualitative and quantitative analysis methods are used to evaluate the challenges involved in integrating intermittent generation into the electricity sector.
This chapter gave an introduction to the topic and highlighted some of the current policies that impact wind energy investments and implementation. Chapter 2 introduces the challenge of integrating an intermittent power source to the electricity system. It starts with a discussion of utility power planning and system reliability and then moves onto valuing wind energy contributions. I look at some of the major questions regarding intermittency and the associated transmission and backup constraints and present findings from past research. I also describe how other models represent wind energy.
Chapter 3 proposes a new method of representing wind in a computable general equilibrium (CGE) model that takes into account the dynamic impacts of degrading wind resources and of rising wind penetration on the electricity market. Chapter 4 presents the results from the model. The first part shows a "business as usual" run of the model, in which no carbon policies or wind subsidies are applied. The second part evaluates the potential impacts and costs associated with implementing potential policies described above. I present the results from two policy scenarios: a 550 parts per million (ppm) greenhouse gas concentration stabilization scenario and a production tax credit scenario. Finally Chapter 5 concludes with some final thoughts on the policy implications and areas for future research.
CHAPTER 2: The Challenge of Coping with Intermittency 2 Introduction - Impacts of Integrating Wind
As the use of wind power increases around the world, there is increasing interest in the impacts of adding intermittent power to the grid. This is because wind power plants only generate electricity when the wind is blowing, and the plant output depends substantially on the wind speed.6Currently, wind often fluctuates from hour to hour and minute to minute and exact wind speeds cannot be predicted with high accuracy over daily periods. Consequently, electric utility system planners and operators have been concerned that variations in wind-plant output may increase the operating costs of the power system as a whole. This concern arises because the system must maintain an instantaneous balance at all times between the aggregate demand for electric power and the total power generated by all contributing power plants. In general, the costs associated with maintaining this balance are referred to as ancillary-services costs. The utility operators and automatic controls routinely perform this task based on well-known operating characteristics for conventional power plants and a great deal of experience accumulated over many years.
System operators have been concerned that variations in wind-plant output will force the conventional power plants to provide compensating variations in order to maintain system balance, thus causing the conventional power plants to deviate from operating points that have been chosen to minimize the total cost of operating the entire system. The operators' concerns are compounded by the fact that conventional power plants are generally under their control and thus are dispatchable, whereas wind plants are controlled instead by nature. While these are valid concerns, it is important to understand that the key issue is not whether a system with a significant amount of wind capacity can be operated reliably, but rather to what extent are the system operating costs increased by the variability of the wind.
The unique operating characteristics of the intermittent renewable technologies cause difficulties when evaluating intermittent energy resources against conventional options. Several key questions need to be addressed:
1. Utility planning and system reliability: How are the costs of operating the power system affected by the inclusion of wind power in the generation mix?
2. Valuing wind energy contributions: How can these cost impacts be evaluated? Do wind plants
require backup with dispatchable generation, and if so, to what extent?
3. Capacity value and penetration: How do these cost impacts vary with wind power's penetration of the system generation mix and with variations in other key system characteristics like generation mix, fuel types and costs, and access to external markets for energy purchases and sales?
6 The theoretical power from a wind turbine is a function of the wind speed cubed. Thus, a doubling of wind speed will result in an eight-fold increase in wind power.
4. The role of storage: Can storage increase the value of intermittent generation? What are the options and their costs?
The following four sections will address each of these questions individually.
2.1 Utility Power Planning and System Reliability
In order to value wind energy contributions we first need to examine the "rules of the game" that current utility planners take into account when deciding how to value capacity additions. Utility planners use one of several indices to evaluate system reliability: reserve margin (RM), loss-of-load-expectation (LOLE), loss-of-energy expectation (LOEE), and frequency and duration (F&D) index. By calculating how wind plants affect system reliability, we can evaluate the cost impacts of integrating those wind plants.
* The reserve margin is the generation reserve capacity expressed as a percentage of
weather-normalized expected peak load. It is a static measurement of the system capacity adequacy and does not consider plant and fuel availabilities.
* Loss of load expectation (LOLE) is the basis for most methods of assessing the capacity credit of a
wind plant. The LOLE is normally expressed in terms of days per year and indicates the expected number of days in a year in which the projected load exceeds the available generation capacity. Of course the goal of the utility is to keep this probability small making an appropriate trade-off between cost-minimization and reliability. However, it does not take account of the severity of the generation deficiency, nor does it give any information on the frequency or duration of the deficiency.
* The loss of energy expectation (LOEE) is a more appealing index because it gives the expected
energy that will not be served by the available generation capacity and thus indicates the severity of the generation deficiency.
* The F&D criterion is an extension of the LOLE index that also gives information on how often the
expected generation deficiency will occur and how long it will last. The criterion is a combination of the Sustained Average Interruption Frequency Index and the Sustained Average Interruption Duration
Index. The F&D index is not as widely used in generation planning as the LOLE index.
Despite the advantages of the probabilistic reliability indices, the deterministic reserve margin is still widely used in the utility industry for generation planning.
When adding different generation technologies to the grid, such as a wind farm, these expansion options are assessed in terms of their capacity and energy values. The energy value is usually the cost of providing the energy with an alternative expansion plan. The capacity value is the value of improved reliability (expressed in LOLE) that the resource expansion plan provides to the system. The calculation of the capacity value is based on the effective load carrying capability (ELCC) of the particular resource
expansion option.7 The ELCC of a resource can be determined by calculating the LOLE with and without the resource.
Another approach can be used for the last step of the calculation. Instead of increasing the load to bring the LOLE down to the original value, perfectly reliable capacity can be added to the original system (without a new resource) until the reliability measurement reaches the same value as with the new
resource. This results in a "firm capacity equivalent" for the resource. For example, if adding additional wind power plants results in lowered reliability, we add firm capacity, in the form of a representative gas plant, to compensate for the reliability loss. The addition of wind and the necessary backup will result in an equally reliable system. Depending on how load increases and firm capacity additions are treated in the models, the ELCC and firm capacity equivalent can have the same or slightly different values. Many researchers and utility planners use the term "capacity credit" for both ELCC and firm capacity equivalent.
2.2 Valuing Wind Energy Contributions
The capacity value of intermittent renewable technologies is often overlooked. Some utilities contend that, because PV and wind generation output depend on uncontrolled resources and cannot be used to meet the system demand on command, no capacity value or credit can be given unless there is adequate energy storage. This argument implies that if intermittent renewable generation options are adopted, utilities have to make available other "firm capacities" to back up the intermittent renewables in order to maintain the same reliability. However, reliability analyses have shown that intermittent
renewable generation does contribute to the system reliability and can be used to reduce the capacity requirement of the utility system (Flaim and Hock, 1983; Wan and Parsons, 1993). Unlike conventional generators, however, the capacity value of intermittent renewable energy strongly depends on the correlation between the utility load and the pattern of wind resource availability.
Several factors play an important role in establishing the capacity credit of wind energy systems. The timing of wind plant output relative to the utility demand profile is critical. If wind plant output does not coincide with utility peak loads, the wind energy system will have a low capacity credit. A second factor influencing capacity credit is penetration level. As seen later in this section, there is a noticeable saturation effect in capacity credit as the penetration level of wind power increases.
Smith and Ilyin (1990) have performed ELCC computations on installed wind power in California for PG&E. An experimental 2.5 MW MOD-2 unit (now discontinued) located at Solano County, California, achieved an ELCC of 74% of its rated capacity in 1987. The ELCC of wind turbines installed at Altamont Pass, California, showed large year-to-year variations, reaching 22% of the total
7 Garver (1966) defined the ELCC of a resource as the amount of constant load increase the system could carry while maintaining the original system LOLE.
installed capacity (name plate rating) in 1987 but only 14% in 1988.8 The seasonal wind patterns at both the Solano County MOD-2 site and Altamont Pass are highly regular, and the available wind energy at both sites correlates well with PG&E's seasonal load (i.e. winds at both sites are much stronger in the summer when the demand on the PG&E system is higher). Moreover, the daily wind pattern at Solano County tends to peak, producing maximum power, during the PG&E peak load hours (3:00 - 4:00 p.m. PDT). The daily wind pattern at Altamont Pass tends to produce a maximum output after PG&E's peak load hours. Differences in wind patterns at Solano County and Altamont Pass cause the variations in wind power capacity value. These results indicate clearly that the capacity value of intermittent renewable energy resources depends on the utility system load pattern and is site specific.
The results to date also confirms one of the major concerns often expressed about wind power: that a wind plant would need to be backed up with an equal amount of dispatchable generation (Parsons and Milligan, 2004). It is now clear that, even at moderate wind penetrations, the need for additional generation to compensate for wind variations is substantially less than one-for-one and is generally small relative to the size of the wind plant.9
The results presented here must be considered in the context of a centrally planned electricity system. In that system, the system operator produces a schedule representing the preferred mix of generation to meet demand; included in the schedule are the quantity of output (generators) and
consumption (loads), details about any adjustment bids, and the location of each generator and load. The schedule details the quantities and location of trades among scheduling coordinators and is balanced with respect to generation, transmission losses, load and trades. When deciding to integrate intermittent
sources, the generator can dispatch certain plants and increase reserves in order to optimize operation over the entire system.
All of this has the potential to change with electricity deregulation. Since the beginning of 1998, many states in the US have considered and implemented partial electric industry restructuring. This move towards more competitive electricity markets has several potential impacts:
8 If the ELCC is calculated against the actual maximum output of wind farms during the year instead of total
installed capacity to account for any non-operational and overrated wind turbines, the ELCC value at Altamont wind farms would increase to about 40% in 1987 and 20% in 1988. Using the same formula, the ELCC value at Solano County would increase to 80% in 1987.
9 Halberg (1990) reported that capacity credit of a wind energy system at low penetration would be approximately equal to the installed wind power capacity multiplied by its average yearly capacity factor. At higher penetration, the wind power capacity credit will reach an asymptotic value, which is a function of wind energy availability and existing system generation mix. In the case of the Dutch electric system, the capacity credit starts from 26% at a low penetration level to 7% at a high penetration level (31 % of the installed capacity). Coelingh et al. (1989) found that for 1,000 MW of wind power (representing 9% of the total system load) in the Netherlands system, the calculated capacity credit would be 184 MW. Their calculations also showed the saturation effect of capacity credit.
* With deregulation come competitive retail markets that allow for bidding of energy in the day-ahead and real-time markets. The capacity credit given to intermittent sources such as wind will be critical in determining how competitive they become.
* However, these competitive retail markets also bring with them an opportunity for consumers to demand and receive "green electricity." Many utilities around the country now allow customers to voluntarily choose to pay more for electricity generated by renewable sources.
2.3 Capacity Credit and Wind Penetration
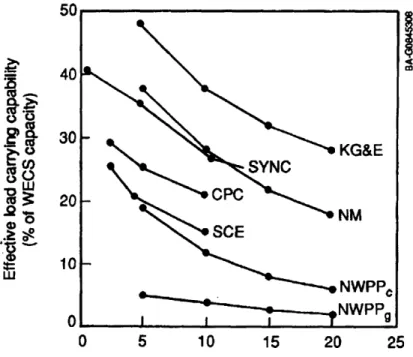
Several early studies examined the ELCC of wind power systems in an actual utility environment. Flaim and Hock (1983) summarize the results in Figure 2. Two important observations can be made from the figure. First, the effective load carrying capability of the wind farms varies widely among different utilities, ranging from 5% to almost 50%. Second, as the wind energy system penetration increases, the ELCC drops quickly to a constant level. This means that the incremental ELCC value from each successive addition of wind power generation becomes smaller and smaller and approaches zero at a sufficiently high penetration level. Because each wind generator produces only during certain hours, more wind generators will produce more power during those hours and minimize the effect of generator outage. The net system loads during those hours will become less, and the LOLE during those hours will
diminish. However, even as the number of wind generators continues to increase, new peak loads emerge at other times when the wind speed is low or there is no wind at all. These new peak loads determine the capacity requirement of the system regardless of wind penetration. Dispersing wind turbines over a wide area will reduce the rate of decrease of the ELCC but will not completely eliminate the phenomenon.
-9
2.5~
a
.
COg 0
.9
;
stI
8 0 5 10 15 20 25Penetration level (WECS capacity as percentage of peak load or system capacity)
Figure 2 - Effective load carrying capacity of wind energy conversion systems (WECS)
Additional research by the U.S. National Renewable Energy Lab (Parsons and Milligan, 2004; Smith and DeMeo, 2004) has addressed the question of integration impacts at varying levels of wind penetration. They concluded the following:
* First and most important, the incremental cost of ancillary services attributable to wind power is low at low wind penetration levels; as the wind penetration level increases, so does the cost of ancillary services (Smith and DeMeo, 2004).
* Second, the cost of ancillary services is driven by the uncertainty and variability in the wind plant output, with the greatest uncertainty in the unit-commitment time frame, or day-ahead market (Smith and DeMeo, 2004). Improving the accuracy of the wind forecast will result in lower cost of ancillary services.
* Third, at high penetration levels the cost of required reserves is significantly less when the combined variations in load and wind plant output are considered, as opposed to considering the variations in wind plant output alone (Parsons and Milligan, 2004).
Perhaps the most significant long-term problem for intermittent renewable generation is the noticeable saturation effect in capacity credit as the penetration level increases. The output of conventional generators generally is independent of location. As more and more conventional units are added to the system, the load carrying capacity of additional units as the same as the previous units. In contrast, the
22
output and value of intermittent renewable generation technologies depends on the density of natural energy flow and is site specific.
When the amount of renewable energy generation connected to a system is only a small fraction of the total system capacity, the impact on the system load-following and reserve margin requirements will be minimal. The demand for electricity is stochastic in nature, and the system controller sees the output intermittency of the renewable energy generation as merely an extension of natural load fluctuations. The output intermittency of renewable energy generation and the utility's intrinsic load variations are generally independent of each other; their combined effect on the system control is random load fluctuations, perhaps with somewhat wider variance.
Intermittent renewable energy technologies derive most of their value from displacing generation from conventional units that use higher-cost fuels. With an increased penetration level, more and more conventional generating units may be needed on line and partially loaded to add load-following capability and operating reserve to the system. The increased cycling duties and decreased efficiency caused by the partial loading of these generators will increase fuel consumption and maintenance costs. At certain penetration levels the savings offered by intermittent generations could be offset by the above operations, making it uneconomical to add intermittent generations into utility systems. '
2.4 The Role of Storage
Storage may increase the value of intermittent generation. However, studies generally show that dedicated storage systems for renewables are currently not viable options for utilities because of the high capital costs of storage technologies (Denholdm and Kulcinski, 2003; DeCarolis and Keith, 2002; Schienbein, 1997). As the technology matures, the cost of these storage systems will change over time and we should keep them in mind."
Electric utilities have considered using energy storage systems as a load-leveling device. Pumped-storage hydro has long been established as the primary type of energy storage plant for electric utilities, and its operations and economics are well understood. The technical feasibility of battery storage
"' Case Study: Eltra Danish electric utility company, has the world's highest wind power penetration rate at 60 percent. Yet the systems' grid managers consistently maintain reliability through contracted thermal plant spinning reserves as well as extensive transmission interties with adjacent systems. These interties are vital load-balancing tool for Eltra, with a total capacity of over 65 percent of the system's pea load. Although Eltra has reported significant load-balancing impacts from the high proportion of wind power on its system, the utility has not determined the amount of operating reserves specifically lined to providing backup wind power generation. Eltra is well aware of its potential vulnerability during periods of light demand and is careful to contract for sufficient operating reserves and monitor intertie capacity.
I A report produced by the Iowa Department of Natural resources is a great source of information about storage systems (2001). It discusses wind hybrid technology options that mix wind with other power sources and storage devices to help solve the problem of intermittency. It also presents the average cost and cost-benefit of each application along with references to manufacturers.
systems for electric utilities has been demonstrated (EPRI, 1986). Compressed air and other types of energy storage systems are also being investigated for electric utility applications.
The combination of intermittent energy technologies and energy storage systems has the potential of reducing output fluctuations. A properly sized energy storage system can supplement intermittent energy resources by providing firm capacities during periods of cloudy or calm weather. However, this combination also increases the cost of intermittent renewable energy resources to electric utilities. In addition to system load leveling, energy storage systems reduce operating costs and improve the operating flexibility of electric power systems because they are capable of providing non-spinning reserve for the utility system. Storage can add flexibility and value to utility operations, but it should generally be a system-wide consideration based on the merit of the storage system.
In the section below I outline some of the recent studies done on the feasibility of different options for energy storage.
2.4.1 Pumped hydro storage
Pumped hydro is capable of storing large amounts of energy. Usually this technique, which is based on moving water from a reservoir at low elevation to a reservoir at higher elevation, is employed in electric utility-scale applications. When power is required, the water runs though a hydroturbine to generate electricity. Pumped hydro, where applicable, is cost-effective, but it is usually limited to existing hydro plants, which are geologically selective. An important limiting factor to the use of pumped hydro is degradation of natural habitat. Schienbein (1997) adds that when pumped hydro is coupled with wind turbines the number of practical sites is greatly reduced. Therefore, this type of energy storage is typically limited to electric utility operations, and then only under special circumstances.
Using existing hydropower facilities as energy storage systems for renewable energy technologies is a promising concept, but more research is needed to determine the effect on existing hydropower operations and to assess the environmental impact of potentially increased fluctuations of downstream flow (Wan & Parsons 1993).
2.4.2 Compressed air energy storage
Compressed air energy storage (CAES) systems are based on conventional gas turbine technology. The principle of CAES is the utilization of the elastic potential energy of compressed air. Energy is stored by compressing air in an airtight underground storage cavern. To extract the storage energy, compressed air is drawn from the storage Bessel, heated and then expanded through a high-pressure turbine, which captures some of the energy in the compressed air. The air is then mixed with fuel and combusted, with the exhaust expanded through a low-pressure gas turbine.
2.4.3 Advanced battery energy storage (BES)
Flow batteries are a hybrid between electrochemical batteries and fuel cells. They use pumps to circulate a pair of electrolytes past an ion-exchange membrane similar to the ones employed in many fuel cells. Ions pass across the membrane from one electrolyte to the other to charge and discharge the battery.
Life cycle costs and greenhouse gas emission contributions are detailed in Denhold and
Kulcinski, 2003. GHG emissions from pumped hydro when coupled with renewable energy systems are lower than those from BES or CAES.
Alternative energy storage technologies, such as flywheels, capacitors, hydrogen and magnetic fields are not yet suitable for utility scale electricity storage due to their high cost and/or low round trip conversion efficiencies (Denholdm and Kulcinski, 2003).
2.5 Approach of Other Models
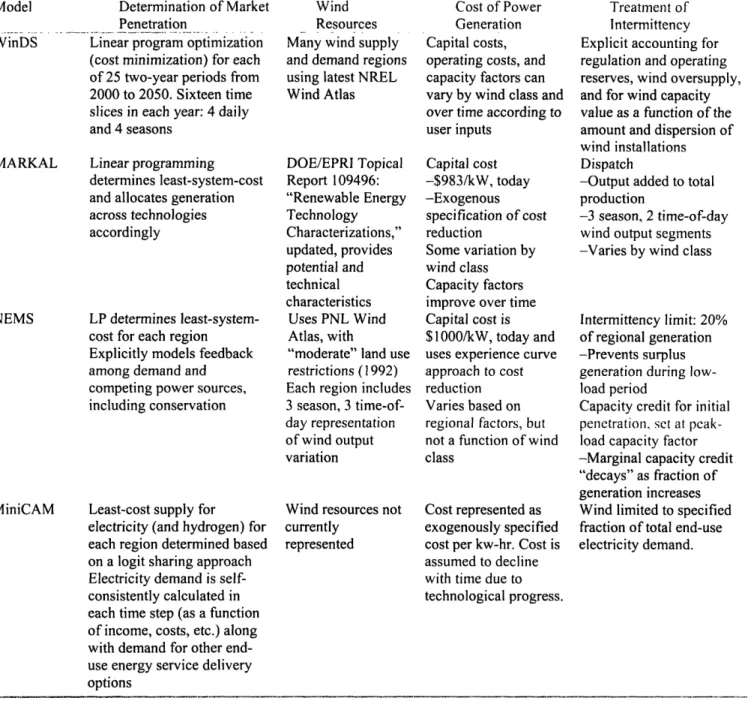
In this section I describe how several other energy models represent wind resources, cost of power generation and intermittency in wind power generation. A summary of the models and their treatment of wind energy is provided in Figure 3. This discussion sets the context for the modeling and analysis work done on the MIT EPPA model.
2.5.1 MARKAL - International Energy Agency (IEA)
The Market Allocation (MARKAL) model is a partial equilibrium bottom-up energy system technology optimization model employing perfect foresight and solved using linear programming with numerous model variants that expand the core model to allow for demand response to price and elastic demand, uncertainty, and endogenous technology learning
Under this model energy demand is exogenous and renewable energies are characterized by investment and operating costs. For renewables such as wind and solar, the specific season/day-night capacity factors describing the operational characteristics of the technologies are provided and do not change over time. For targeted technologies of interest, endogenous technology learning can be employed to examine the drop in investment cost of the technologies as their deployment increases (Smekens,
2004).
2.5.2 MiniCAM 2001 - Pacific Northwest National Laboratory (PNNL)
The Mini-Climate Assessment Model (MiniCAM) is developed by the Joint Global Change Research Institute (Edmonds et al., 1997; Brenkert et al., 2003). It is a partial-equilibrium model (energy and land-use) including numerous energy supply technologies, agriculture and land-use model, and a
reduced-form climate model. Emissions include CO2, CH4, N20, and SO2. The US EPA is one the major users of the MiniCAM and has employed it to analyze various policies to address climate change. The MiniCAM has been widely used in international energy modeling, in venues such as the
Intergovernmental Panel on Climate Change (IPCC) and the Stanford Energy Modeling Forum (EMF).
The model includes solar PV, wind, hydroelectric (including geothermal), biomass (two separate supply streams: traditional/ waste biomass and grown biomass from dedicated farms), storage
technologies for solar and wind, and space-satellite solar. Wind and solar costs are input as exogenous parameters by time period and by region. Intermittence of solar and wind is represented by placing limits on maximum penetration within any region's end-use electricity market. Hydroelectric is resource constrained by region. Biomass from dedicated farms is derived from the model's Agriculture and Land Use module, in which biomass crops compete for acreage with food crops.
2.5.3 NEMS - Energy Information Agency (EIA)
The National Energy Modeling System (NEMS) model is a product of the U.S. Department of Energy, Energy Information Administration, Office of Integrated Analysis and Forecasting (EIA, 2004). It is a general equilibrium energy-economic model of U.S. energy markets with energy-related emissions. The emissions modeling includes energy system-wide carbon dioxide and methane emissions, with the capability to include carbon dioxide fees or caps, and emissions caps, trading, and banking of emission credits for carbon dioxide, sulfur dioxide, nitrogen oxides, and mercury in the electricity generation sector. NEMS is used annually to produce the Annual Energy Outlook and other analyses with projections 20 to 25 years into the future, and model results calculated on an annual basis over that time period.
NEMS characterizes renewables for central station electricity supply -biomass, conventional hydroelectricity, geothermal, landfill gas, solar PV, solar thermal, and wind. Resources are characterized for each technology, by NEMS region and, for intermittent technologies, by time of day and season. All fossil, nuclear, and renewable technologies incur uniform interconnection charges within region; wind incurs small additional interconnection charges varying by distance to the existing lines. NEMS accommodates limited interregional electricity trade and trade with Canada.
Intermittent penetration is limited within region and by reducing capacity contributions to reserve margin. Currently, there is a fixed limit on intermittent's share of regional generation ( 10-15% of regional generation). Large capital cost reductions happen over time but performance is fixed. As of 2005 there is a move to replace fixed capacity credit with variable capacity credit, which is a function of intermittent penetration. This approach allows higher penetration of intermittent capacity, but requires increasing investment in "back-up" capacity.
2.5.4 WinDS - National Renewable Energy Laboratory (NREL)
The Wind Deployment Systems (WinDS) model is a multi-regional, multi-time-period model of capacity expansion in the electric sector of the U.S. It is developed and maintained by the National Renewable Energy Laboratory and is designed to estimate market potential of wind energy in the U.S. for the next 20 - 50 years under different technology development and policy scenarios. It utilizes a linear program optimization (cost minimization) for each of 25 two-year periods from 2000 to 2050 and solves
over sixteen time slices in each year: four daily and four seasons. There are four levels of regions (wind supply/demand, power control areas, NERC areas, and interconnection areas) and four wind classes (3-6).
WindDS proceeds one period at a time minimizing total system costs (the sum of capital, operating, fuel, transmission, ancillary services, interruptible load costs, and wind forecasting error penalties). The solution is also subject to constraints on: wind resources, transmission, ancillary services,
load and peak requirements, and conventional technologies' performance and availability.
Model Determination of Market Penetration
WinDS Linear program optimization (cost minimization) for each of 25 two-year periods from 2000 to 2050. Sixteen time slices in each year: 4 daily and 4 seasons
MARKAL Linear programming
determines least-system-cost and allocates generation across technologies accordingly
NEMS LP determines least-system-cost for each region
Explicitly models feedback among demand and competing power sources, including conservation
MiniCAM Least-cost supply for
electricity (and hydrogen) for each region determined based on a logit sharing approach Electricity demand is self-consistently calculated in each time step (as a function of income, costs, etc.) along with demand for other end-use energy service delivery options
Wind Resources Many wind supply and demand regions using latest NREL Wind Atlas DOE/EPRI Topical Report 109496: "Renewable Energy Technology Characterizations," updated, provides potential and technical characteristics Uses PNL Wind Atlas, with
"moderate" land use restrictions (1 992) Each region includes
3 season, 3
time-of-day representation of wind output variation
Wind resources not currently
represented
Cost of Power Generation Capital costs, operating costs, and capacity factors can vary by wind class and over time according to user inputs Capital cost -$983/kW, today -Exogenous specification of cost reduction Some variation by wind class Capacity factors
improve over time Capital cost is $1000/kW, today and uses experience curve approach to cost reduction Varies based on regional factors, but not a function of wind class
Cost represented as exogenously specified cost per kw-hr. Cost is assumed to decline with time due to technological progress.
Treatment of Intermittency Explicit accounting for regulation and operating reserves, wind oversupply, and for wind capacity value as a function of the amount and dispersion of wind installations Dispatch
-Output added to total production
-3 season, 2 time-of-day wind output segments -Varies by wind class
Intermittency limit: 20% of regional generation -Prevents surplus generation during low-load period
Capacity credit for initial penetration, set at pecak-load capacity factor -Marginal capacity credit
"decays" as fraction of generation increases Wind limited to specified fraction of total end-use electricity demand.
Figure 3 - Summary of Energy Models (US EPA, Renewable Energy Modeling Series, 2003)
28
X1____-~~~~---CHAPTER 3: Modeling Intermittent Sources in a General Equilibrium Context
3 Why General Equilibrium ModelsIn most of the models, the cost of power generation is exogenously determined, and trade between regions and substitutions between sectors are not considered. In order to fully analyze the forces driving GHG emissions we need to consider not only energy supply and its emissions but also factors influencing demand and the origins of a number of other climate-relevant emissions. Computable general equilibriull (CGE) models allow us to consider multiple interacting agents and multiple production sectors. As a result CGE models can have a high level of detail and can reproduce important features of the economy.
The MIT Joint Program on the Science and Policy of Global Change has developed a CGE model that analyzes the processes that produce greenhouse-relevant emissions and assesses the consequences of policy proposals intended to control these emissions (Babiker et al., 2001; Reilly et al., 2003, McFarland
et al., 2004). The model includes several non-extant energy technology options: including shale oil,
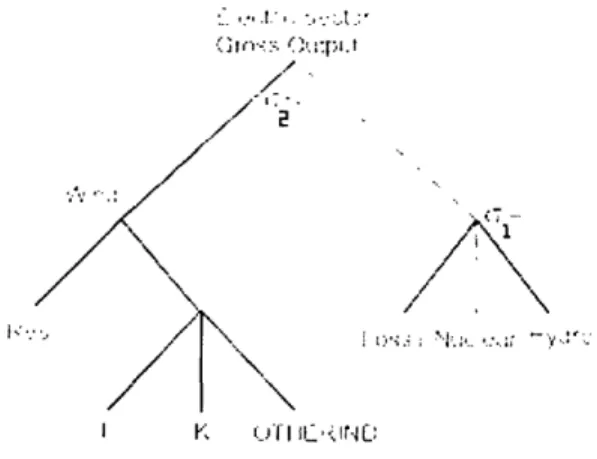
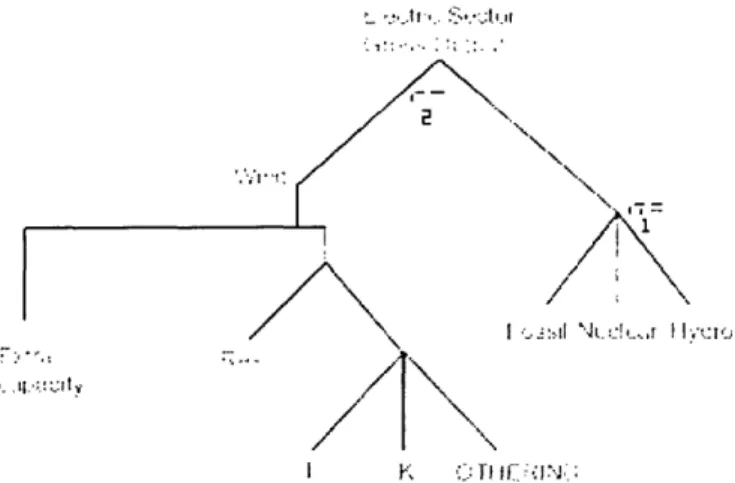
natural gas combined cycle, wind, solar and biomass. Currently, all produce perfect substitutes for oil, gas or electricity as appropriate, except for the intermittent sources, wind and solar power. Because of the nature of their formulation, the amount of intermittent energy tends to be share preserving and will not allow large-scale expansion of wind without recalibration over time. The research below presents a new accounting framework that will improve the representation of intermittent energy in CGE-type models.
3.1 The Structure of the MIT EPPA Model
The MIT Emissions Prediction and Policy Analysis (EPPA) model is a multi-region, multi-sector, recursive-dynamic multi-regional computable general equilibrium (CGE) simulation of economic growth, energy use and greenhouse gas (GHG) emissions over the next 100 years. CGE models use data on the
input-output structure of the economy and estimated trends in the supplies of key economic inputs (e.g. labor and energy resources) to simultaneously compute the prices and flow quantities of goods and services in the economy in the future. Because the simulation computes prices, quantities and income, it is a useful tool for understanding the effects of GHG emissions constraints on different markets and
different economies.
Version 4 of the model used for this analysis has been updated in a number of ways from Version 3 documented by Babiker et al. (2001). It includes non-CO2 GHGs, greater disaggregation of
technologies in the electric sector, and updated evaluation of economic growth and resource availability (Hyman et al., 2003; McFarland et al., 2004; Reilly et al., 2003). Its Social Accounting Matrix (SAM) is built on the Global Trade and Analysis Project (GTAP) data set, which accommodates a consistent representation of energy markets in physical units as well as detailed accounts of regional production and