Ecohydrology of a Seasonal Cloud Forest in Dhofar
by
Anke Hildebrandt
Dipl. Ing., Technical University of Dresden (2000)
Submitted to the Department of Civil and Environmental Engineering
in partial fulfillment of the requirements for the degree of
Doctor of Philosophy in the Field of Hydrology
MA SSACHUSETTS INSTITUTE'
at the OFTECHNOLOGY
MAY
3
12005
MASSACHUSSETTS INSTITUTE OF TECHNOLOGY
June 2005
_
LIBRARIES
0 2005 Massachusetts Institute of Technology. All rights reserved.
A u th or ...
...
...
...
Department of Civil and Environmental Engineering
March 29, 2005
Certified by...
Elfatih A.B. Eltahir
Professor, Civil and Environmental Engineering
Thesis Supervisor
Accepted by ...
Andrew J. Whittle
Chairman, Department Committee on Graduate Students
Ecohydrology of a Seasonal Cloud Forest in Dhofar by
Anke Hildebrandt
Submitted to the Department of Civil and Environmental Engineering on March 29, 2005, in partial fulfillment of the requirements for the degree of
Doctor of Philosophy in the Field of Hydrology Abstract
The hydrology of a semiarid broadleaf forest in Dhofar (Oman) is investigated by performing a field experiment and a modeling study. Based on the results of the field experiment, the ecosystem in Dhofar is classified, for the first time, as a seasonal deciduous cloud forest. Owing to the seasonal cloud cover, the soil storage in this ecosystem is filled and emptied in such a fashion that allows trees to allocate most of the water to transpiration by their relatively deep roots. In addition to annual rainfall amounts of about 100 millimeters, more water is gained by trees directly through interception of cloud droplets (horizontal precipitation). Through-fall measured below the canopy is about twice the rainThrough-fall measured above the canopy. Stemflow contributes about one third of the total water received by the soil.
Soil moisture observations are consistent with increased infiltration in proximity of the tree trunks. Sap flow and meteorological observations indicate that
transpiration is suppressed during the wet season, which allows for deep infiltration of the water received at the surface. This soil water storage supports transpiration by the relatively deep-rooted trees for up to four month into the dry season. All these factors combine to shape and enhance the water conserving nature of the ecosystem, and to allow for tree dominance in an otherwise too dry environment.
A dynamical vegetation model is used to investigate tree- grass competition in this arid region. The model simulations elucidate the role of clouds in reducing the
available energy for transpiration during the wet season. Without representing this role in the model, the simulated soil water storage by the end of the wet season is
not enough to allow for tree survival and dominance. The same model is used to investigate the role of the soil in controlling relative performance of trees and grass in this ecosystem. A characteristic rooting depth that is optimal for tree growth is identified, function of soil type and climate. This is the smallest depth at which transpiration is maximized and all other water sinks such as surface runoff or drainage are minimized. The optimal rooting depth is deeper when the evaporative demand during the wet season is low, similar to conditions in Dhofar. Such
conditions improve competitiveness of trees in the model simulations. A horizontal precipitation module is used to illustrate how the contribution of this process is markedly reduced over grass as compared to trees. When the horizontal precipitation module is coupled to the vegetation model, two stable states are simulated by the model. Equilibrium vegetation simulated by the model starting from forest (grass) initial conditions is dominated by trees (grass). Deforestation, in the model, reduces soil water input and hence would tend to inhibit re-emergence of trees as a dominant land cover. Implications of this feedback for the re-forestation efforts in Dhofar are discussed. The results of this study should provide a solid basis for sound environmental management of the ecosystem.
Thesis Supervisor: Elfatih A. B. Eltahir
Acknowledgements
This Research was supported by a grant from the Ministry of Regional
Municipalities, Environment and Water Resources of the Sultanate of Oman and a fellowship from the Martin Society of Fellows for Sustainability.
During my work on this research I have received generous support from different sources. First of all, I wish to thank my advisor Professor Elfatih Eltahir for his guidance, his patience, and exciting discussions that shaped this work and helped me to organize my findings and ideas, and to make progress in my research. I would also like to thank the two other members of my committee, Professor Dara
Entekhabi and Professor Charles Harvey, for their support and advice.
The field campaign for this research would not have been possible without the committed help from the Ministry of Regional Municipalities, Environment and Resources in the Sultanate of Oman. Said Muqadam was the understanding liaison between MIT and the ministry. Mansoor Amerjeed and Mahaad Shamas reliably collected most of the field data used in this research, regardless of the very challenging weather during the khareef season, when frequent field visits were necessary. Many other employees of the ministry went out of their way to provide us with their insight and also helped us with logistical support, such as
transportation, and building material. Mohammed Al Aufi's and Kunal Surana's (MIT) committed help and friendship was indispensable during the installation of the field site in Oman, their hard work is highly appreciated. Kunal, Mohammed and I formed the most efficient, constructive and at the same time happy team I have ever worked in! Sahara Moon Chapotin form Harvard donated the sapflow sensors for this project. Professor Harry Hemond, Professor Heidi Nepf and Dr. John Germaine provided lab space and advice. My mother, Dr. Barbara
Hildebrandt, verified the structural integrity of the tower. John Frank traveled all the way to Oman to build a lightning rod for our sensor tower, and kept me in good
spirit, during challenging times. Paulina Varchavskaya tought me to solder the required electrical circuits at odd times of the day.
My thesis had patient editors. Especially Dr. Payal Parekh and Arne Bomblies donated a great deal of their time, and Dr. Daniel Hudon and Rebecca Neumann helped with some parts.
Arriving rather disoriented from Europe, I found myself in a warm work
environment at Parsons Lab. Sheila Frankel has to be thanked for bringing energy to the lab at any time she's in. Vicky Murphy, Gayle Sherman and Jim Long are reliable institutions at Parsons, understanding of confused grad students and a source of forms, smiles, keys, chocolate and "don't worry"s. The members of the Eltahir group were a great resource to draw from: Dr. Jeremy Pal, Professor Guiling Wang and Dr. Kirsten Findell provided help and impulses at the beginning and during the time of my studies. Arne Bomblies and Jonathan Winter made life brighter each day of the last two years, and lent a hand whenever needed. Daniel Collins, Dr. Frederic Changnon and Susan Dunne discussed research with me and saved my day every once in a while. I would also like to thank Cynthia Stewart for her kind patience during the last months.
During my time at MIT I have met remarkable people and started friendships that I hope will last. Thanks to my friends for standing by me, Paulina
Varshavskaya, Dr. Mine Ozkar, Dr. Payal Parekh, Dr. Ana-Maria Castravet, Fanny Monteiro, Nicole Gasparini, Ghanim Al Mahari, Sauri Gudlavalletti, Dr. Daniel Hudon, Luke Zettlemoyer, Benjamin Bruet, John Frank, the BADcoop.
I would like to thank the Voswinkel family. I am also indebted to Patrick La Barre, Philippe Muenger and Gerard Milmeister.
I would like to thank my parents, Drs. Barbara and Bernd Hildebrandt, for supporting me throughout, naturally not without criticism, but without condition (and even when they were right).
Contents
List of Figures... 11
List of Tables... 19
1 Introduction 21 1.1 The Geography of the Dhofar Forest ... 22
1.2 The Vegetation Paradox in Dhofar ... 29
1.3 Cloud Forest Hydrology... 34
1.4 Outline ... 36
PART I - FIELD EXPERIMENT 39 2 Field Experiment Setup 41 2.1 Introduction... 41 2.2 Site properties ... 41 2.3 M ethods ... 43 2.3.1 M eteorological M easurements...43 2.3.2 Throughfall... 43 2.3.3 Stemflow ... 46 2.3.4 Soil moisture ... 46 2.3.5 Sapflow... 48 2.4 Data analysis... 49
2.4.1 Time frame of measurement and missing data ... 49
2.4.2 Potential evaporation... 50
2.4.3 Cloudiness... 53
2.4.4 Sapflow... 54
2.4.5 Soil moisture... 55
2.4.6 Rainfall and Throughfall ... 57
2.4.7 Stemflow ... 67
2.5 Conclusion ... 69
3 The Ecosystem in Dhofar: A seasonal cloud forest 71 3.1 Introduction... 71
3.2 Background ... 72
3.3 Observation ... 73
3.3.1 General Climate Conditions During the Year ... 73
3.3.2 Incoming Radiation, Cloudiness and Temperature...76
3.3.3 M easured W ater Fluxes... 79
3.3.4 Soil M oisture... 92
3.3.5 Transpiration and Potential Evapotranspiration...95
PART II -Modeling Analysis 101
4 The Biosphere Model 103
4.1 Introduction ... 103
4.2 The B asic Concepts ... 103
4.3 M odel Structure ... 105
4.4 Modification of Water Uptake Profile ... 108
4.5 M odel Lim itations...111
4.6 Sum m ary ... 113
5 Role of Cloud Cover in Forest Survival 115 5.1 Introduction ... 115
5.2 M odel Input ... 116
5.3 M odel Experim ents ... 121
5.4 M odel R esults ... 122
5.4.1 Case A: 100% Cloud Cover During khrareef...123
5.4.2 Case B: 0% Cloud Cover During khareef...126
5.4.3 Comparison between the Two Scenarios...127
5.4 Summary and Conclusion...128
6 Role of the Soil Environment in Controlling Forest Survival 131 6.1 Introduction ... 131
6.2 Literature R eview ... 133
6.3 Model Setup and Input Data...136
6.4 M odel R esults ... 138
6.4.1 Free Drainage Boundary Condition ... 138
6.4.2 No Drainage Boundary Condition...143
6.4.3 Decreased Cloud Cover ... 146
6.5 Discussion and Conclusion ... 149
6.6 Limitation of the Modeling Analysis...152
7 Role of Horizontal Precipitation in Forest Survival 155 7.1 Introduction ... 155
7.2 Literature R eview ... 156
7.3 Horizontal Precipitation Model...159
7.4 Derivation of Input Data ... 167
7.5 First Estimate on the Influence of Vegetation Type on Horizontal Precipitation Using an Off-Line Model...176
7.6 Implementation in IBIS...181
7.7 Results from Coupled Modeling of Dynamical Vegetation and Horizontal Precipitation ... 182
7.8 Discussion and Conclusion ... 189
8 Sunmary, Conclusions and Future Work 193 8.1 Hydrology of a Seasonal Cloud Forest ... 193
8.2 M odeling Study ... 193
8.2.1 Simplified Parameterization of Root Water Uptake ... 195
8.2.2 Role of Radiative Cloud Properties for Tree survival...195
8.2.3 Role of Soil Depth for Tree Survival...196
8.2.4 Horizontal Precipitation Feedback...197
8.4 Future W ork ... 200
8.4.1 M odeling ... 201
8.4.2 Future W ork in Dhofar ... 202
List Of Figures
1-1 Satellite Image of the Arabian Peninsula. The region of interest is circled in red; note the half moon shape of the coastal mountain range. Picture provided by the SeaWiFS Project, NASA/Goddard Space Flight Center, and ORBIMAGE, http://visibleearth.nasa.gov... 23 1-2 Annual cycle of temperature and precipitation for Quairoon Hairiti (at
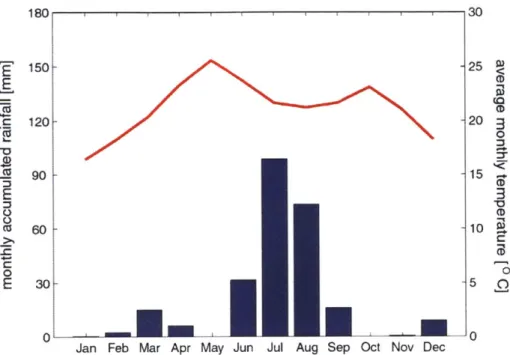
about 800m elevation), a station within the Jabal al Quara... 25
1-3 Scheme of the situation in the Dhofar plane during khareef on a North-South cut through the Jabal al Quarra. The distance between the left and right corner of the profile is about 20-40km depending on
the location ... 25 1-4 Typical deciduous forest in Dhofar. (a) Cloud immersed during the
khareef end of July 2003; (b) after the leaf shed end of December 2003. Photographs by Anke Hildebrandt (a) and Mahaad Shamas (b). ... 26
1-5 (modified from Morris and Miller, 1988, p xii). Distribution of vegetation types along the elevation gradient from the coastal plain
(A) through the the Jabal al Quarra to the desert (B). The vegetation is described in Table 1-2. (1) coastal plain; (2) - foothills; (3) - seaward facing slopes, (4) seaward facing plain; (5) dry plateau... 27 1-6 (from Bonan, 2002, p 400) Generalized relationships among major
plant formations, mean annual temperature, and annual
precipitation. Adopted from Whittaker (1975, p. 167)... 30 1-7 (from Lieth and Whittaker, 1975, p 227). Average annual net primary
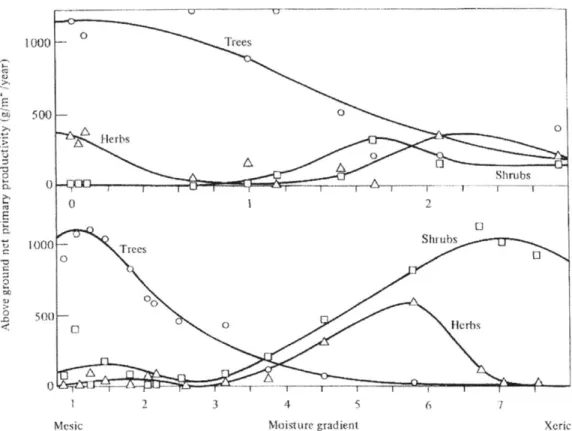
productivity (dry matter) in various tropical ecosystems. * -mean (or individual value); - range; and c standard error of the mean... 31 1-8 (from Lieth and Whittaker, 1975, p 287). Trends in stratal
productivity along moisture gradients. o tree stratum; o shrub stratum; A herb stratum; all values dry matter above ground. Weighted-average indices or relative position of samples along moisture gradient are indicated on horizontal axis.
Top: Great Smoky Mountains, Tennessee, Cove forests (mesic) through oak forest to pine heath (xeric) Note: Values for herb stratum values are multiplied by 10 to show these on the same scale. Data of Whittaker (1966).
Bottom: Santa Catalina Mountains, Arizona. High-elevation fir forest (mesic) through pine forest, woodlands, and desert grassland to
Sonoran semi-desert (xeric). Note: Values for both shrub and herb strata were multiplied by 10, the arborescent shrubs and small trees of the semi-desert have been treated as shrubs.) Data of Whittaker
and N iering (1975)... 32 1-9 (from Huggert, 1995). Vegetation zones within bioclimatic 'space'. (a)
India; (b) Cuba. Sources: (a) after Walter (1962), (b) after Borhidi (1991).
Addition to the original Figure: Red mark - situation in Dhofar. ... 33 2-1 Field site of Gogub. The deciduous anogeissus dhofarica trees
surrounds the tower with mounted meteorological sensors at 9m
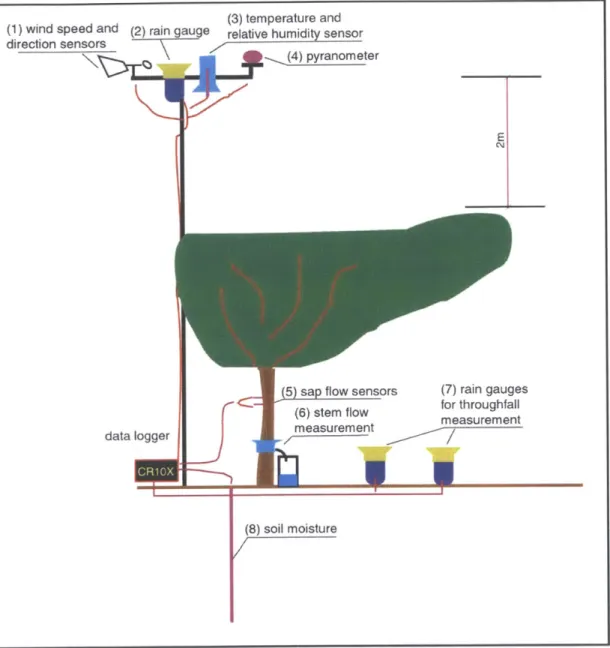
h eigh t... . 42 2-2 Overview over the sensors used on the experimental site in Gogub. ... 44
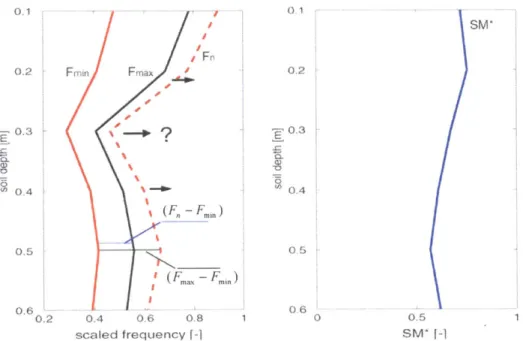
2-3 Illustration of the calculation of SM*. (left) the minimum (solid) and maximum (dashed) observed scaled frequencies are plotted for the permanent C-probes at 0.1m, 0.2m, 0.3m, 0.4m, 0.5m and 0.6m depth. The black curve is an example of an actual scaled frequency observed, Fn-Fmin and Fmax-Fmin correspond to Equation 2.18. (right) referenced soil moisture SM* corresponding to the black curve on the left side. ... 57
2-4 Relation between the data obtained from two different methods for throughfall measurement: Average from an array of 4 randomly distributed tipping bucket rain gauges (x-axis), and from a plastic sheet with area 1.8m x 2.4m, with outlet to a tipping bucket (y-axis). Presented are 3-hourly accumulated values. The correlation
coefficient is 0.93, and the slope on the regression curve is 1.03. ... 60
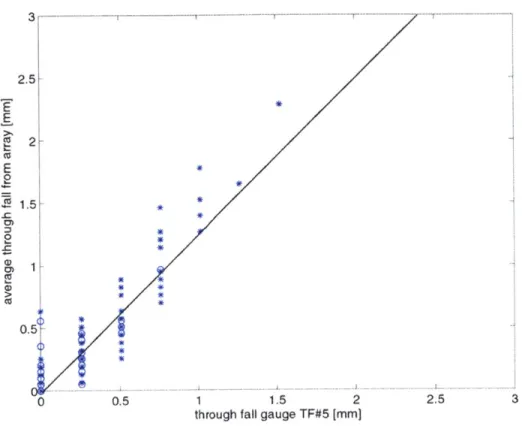
2-5 Time series of measured rainfall and throughfall September 5 9pm to September 8 midnight, 15min accumulated fluxes. Top - throughfall measured with plastic sheet, middle- throughfall measured with array of 4 tipping bucket rain gauges, bottom rainfall measured with tipping bucket rain gauge 2.5m above the tree canopy. ... 62 2-6 Relation between throughfall captured by throughfall gauge TF#5
(x-axis) versus average throughfall from an array of 4 randomly distributed throughfall gauges (y-axis), the slope of the regression
curve is 1.26. ... 64
2-7 Time series of measured rainfall and throughfall September 1 12am to September 9 12am, 15min accumulated fluxes. Top - throughfall measured with plastic sheet, middle- throughfall measured with array of four tipping bucket rain gauges, bottom rainfall measured with
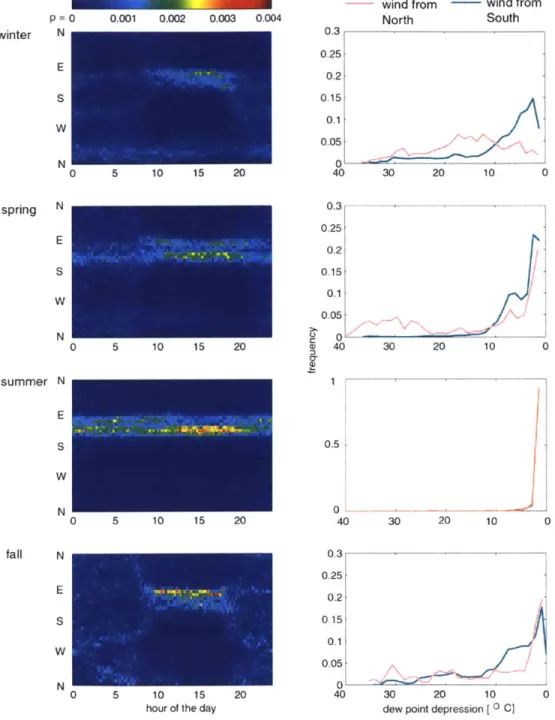
tipping bucket rain gauge 2.5m above the tree canopy. ... 66 3-1 (left) Probability of occurrence of winds with a given direction at
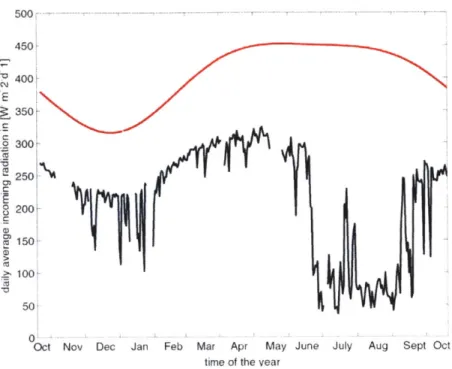
dimensional histogram; (right) Probability of occurrence of a certain dew point depression, when winds are from the South (red line) and winds are from the North (blue line). Plotted are 15min mean values measured October 18 2003- October 16 2004, normalized over the total num ber of observations. ... 75 3-2 Daily mean incoming short-wave radiation for October 19 2003 to
October 19 2004: Measured at the climate station in Gogub (black),
theoretical on top of the atmosphere (red)... 77 3-3 Cloudiness parameter / (as defined in Eq. 2.12) October 19 2003 to
October 19 2004, based on daily averages of incoming radiation. ... 77 3-4 Daily temperatures at the climate station in Gogub for October 19
2003 to October 19 2004, black line - daily mean, red circles - daily
maximum, blue circles - daily minimum. ... 78 3-5 Daily cumulated throughfall (top), rainfall (middle) and the difference
between the two (bottom) from August 3 2003 to October 15 2003. ... 81
3-6 Relation between accumulated throughfall and stemflow for periods (n=16) when stemflow containers were not overflowing in 2003 (red) and 2004 (black). The line shows the regression with intersect at 0,
inclination 0.49 and r2=0.89 ... 84 3-7 Daily cycle of dew point depression from 15min intervals from
September 21-October 15 2003 (period outside of the khareef, when small dew point depressions are most frequent); mean dew point depression (black line), minimum during the record (blue circle),
maximum during the record (red circle)... 88 3-8 Daily values of measured (a) cloudiness; (b) potential evaporation; (c)
throughfall; (d) referenced soil saturation; and (e) sap velocity for the khareef in 2003. The black bar on the time-axis signifies times when data when data logger file got lost, or before the measurement
campaign started (June, July 2003). ... 89 3-9 Daily values of measured (a) cloudiness; (b) potential evaporation; (c)
throughfall; (d) referenced soil saturation; and (e) sap velocity for the khareef in 2004. The black bar on the time-axis signifies times when data when data logger file got lost, or where data were not available
yet (D ecem ber 2004). ... 90 3-10 Relation between accumulated throughfall and stemflow for periods
(n=16) when stemflow containers were not overflowing in 2003 (red) and 2004 (black). The line shows the regression with intersect at 0,
inclination 0.49 and r2=0.89 ... 94 4-1 (adopted from Foley et al., 1996). Framework of IBIS... 106
4-2 Rooting density function (left) and corresponding water uptake profiles (right) plotted for tree (solid line) and grass (dotted) for (a, c) model by Jackson et al. (1996), with /=0.72 for tropical
grassland/savannah and f=0.82 for tropical deciduous trees, and (b, d) the simple assumptions used for this research, The example plotted is for a soil depth of 2m, maximum rooting depth for grasses is 1m. ... 111
5-1 Model input for wind speed (top), temperature (second from top), relative humidity (second from bottom) and precipitation (bottom). The input are in hourly averages, whereas here only the daily
averages are plotted and the red line on top and blue lines indicate the maximum and minimum of the hourly time series. Marked in yellow solid are missing value periods, they were replaced with immediately preceding periods (marked in transparent yellow). ... 118 5-2 Sketch illustrating the difference between surface area of the plot
(Aplot) and surface area active for infiltration (Ainf). Hydrologic fluxes are computed by referring a volume of water to the surface area (Apiot), whereas infiltration from stemflow is non-homogenous and occurs only in A inf... 120
5-3 Model output for control simulation of expected conditions in Gogub, 100% cloud cover during the khareef, 3m deep sandy loam with free drainage boundary condition, and 400mm annual net precipitation; (a) monthly accumulated water budget; (b) monthly average volumetric soil water content; (c) monthly leaf area indices and (d) monthly average net radiation (bottom right).
Note: the dotted lines in the graph (b) show the soil layers that are
beyond the reach of grass. ... 124
5-4 Soil moisture expressed as referenced value SM* (Eq. 2.18). (a) prediction from IBIS simulation, expected conditions in Gogub, 100% cloud cover during the khareef, 3m deep sandy loam with free
drainage boundary condition, and 400mm annual net precipitation (b) measured in Gogub (January through December 2004)... 125 5--5 Same as figure 5-3, except that 0% cloud cover is assumed everyday of
the year; (a) monthly accumulated water budget, (b) monthly average volumetric soil water content; (c) monthly leaf area indices and (d)
m onthly average net radiation... 127 6-1 Predicted conditions at the end of a 500 year simulation with free
draining sandy loam, 100% khareef cloud cover, and varying soil depth. (a) LAI for upper (deciduous trees) and lower (C4 grass)
canopy (b) corresponding water budget for the same case, expressed in annu al fluxes... 139
6-2 Schematic of root water access with different rooting depth, (a) shallow rooted trees, (b) medium rooted trees, and (c) deep rooted
trees ... 14 0
6-3 Overview over predicted conditions at the end of a 500 year simulation with free drainage boundary condition and 100% khareef cloud cover for varying soil depths and soil types (clay loam, sandy loam and sand). (a) Predicted LAI of the upper canopy (deciduous trees) (b) corresponding total annual drainage; (c) corresponding total annual
tran spiration . ... 141
6-4 Difference between the monthly average soil storage in May (lowest soil storage before the khareef) and September (soil storage at end of khareef) at model equilibrium. Presented are the simulations at the respective efficient rooting depth. The storage is partitioned between (blue) the first 1m of the soil column (0-1.0m, accessible equally to trees and grasses) and (red) the storage below im (>1.0m, storage only accessible to trees). (a) free drainage, 100% cloud cover during the khareef; simulations at efficient rooting depth for clay loam (0-1m blue, 1-2.25m red), sandy loam 1m blue, 1-2.75m red), and sand (0-1m blue, 1-3.25m red); and (b) free drainage, 50% cloud cover during the khareef; experiments at efficient rooting depth for clay loam (0-1m blue, 1-1.75m), sandy loam (0-1m blue, 1-2m red), and
sand (0-1m blue, 1-2.25m red)... 142
6-5 Predicted conditions at the end of a 500 year simulation with a no-flow boundary condition, sandy loam, 100% khareef cloud cover, and varying soil depth. (a) LAI for upper (deciduous trees) and lower (C4 grass) canopy (b) corresponding water budget for the same case,
expressed in annual fluxes. ... 144
6-6 Overview over predicted conditions at the end of a 500 year simulation with zero drainage boundary condition and 100% khareef cloud cover for varying soil depths and soil types (clay loam, loamy sand and sand). (a) Predicted LAI of the upper canopy (deciduous trees) (b) corresponding total annual surface runoff; (c) corresponding total
annual transpiration. ... 145
6-7 Predicted conditions at the end of a 500 year simulation for a free draining sandy loam, at 50% khareef cloud cover, and for varying soil depth. (a) LAI for upper (deciduous trees) and lower (C4 grass) canopy (b) corresponding water budget for the same case, expressed in annu al fluxes... 147
6-8 Overview over predicted conditions at the end of a 500 year simulation with free drainage boundary condition and 50% khareef cloud cover for varying soil depths and soil types (clay loam, loamy sand and sand). (a) Predicted LAI of the upper canopy (deciduous trees) (b)
corresponding total annual drainage; (c) corresponding total annual
tran spiration . ... 148
6-9 Partitioning of transpiration into upper and lower canopy at different soil depths for free draining sandy loam (a) at 100% khareef cloud
cover; and (b) at 50% khareef cloud cover. ... 150 7-1 Scheme of horizontal precipitation occurring from aloft through
turbulent exchange, and from the side as an edge effect. ... 161 7-2 Schematic of a simplified tree cluster of circular shape; with turbulent
deposition of droplets from top (white) and from the sides (red). The active area for horizontal precipitation according to the Slinn (1982) formulation is just the top of the cluster (white eddies). It is assumed in this work that horizontal precipitation will be enhanced when
additional areas are exposed, like the sides of the cluster, thus the
total active area is the top and the sides of the surrounding cylinder... 165
7-3 Total settling velocity for cloud droplets and its components, turbulent and gravitational settling velocity, plotted as a function of droplet size for two different vegetation types: broadleaf trees with 6.5m canopy height and grass with 0.5m canopy height. The assumed wind
velocity at 30m above ground was 6m/s. ... 166 7-4 Generation of pairs of LWC and cloud droplet radius for the input time
series #1-#6 for the horizontal precipitation model. Blue graphs show the solution for LWC and droplet radius from the inverse model for the first time step (four hours) of khareef 2004 for clustering factor c=1.0 and c=1.4, all points along the graphs satisfy the horizontal precipitation model. Red graphs depict the parameterization for cloud properties from Eq. 7.14. The cross sections define the pairs of LWC and rd that were selected for the input time series #1 through #6, as
indicated in Table 7-3... 170
7-5 Time series #6 for input in for the horizontal precipitation model... 173 7-6 Comparison of predicted horizontal precipitation (x-axis) with
measurements (y-axis). (a) for series of LWC and rd for time series #2; (b) for constant LWC=0.98g/m3 and rd=17pm... 175 7-7 Results of the forward simulation of the off-line model for horizontal
precipitation when forced with input series (#1-#6) over different vegetation canopies. (a) Output for turbulent deposition (vt-LWC); (b) sum of rainfall (const, 104mm, below the black line) and vertical
deposition (vg-LWC, above the black line), (c) total precipitation... 180
7-9 Development of the model until equilibrium; initial condition was forest, the input for cloud properties was series #4. (above) annual
LAI during the simulation, (below) annual cumulated total
precipitation (Pt), annual accumulated transpiration (trans), annual cumulated contribution from gravitational settling (vg-LWC), annual
cumulated contribution from turbulent settling (vt-LWC)... 183 7-10 Same as Figure 7-8, but for grassland as initial vegetation... 184 7-11 IBIS output for tree height at equilibrium for the different for
different time series of LWC and rd used (series #1-#6), and two
different initial conditions (grassland and forest)... 187 7-12 Same as Figure 7-10, but for constant input C1-C6. ... 188
List Of Tables
1-1 Vegetation distribution along a N-S transect through the Jabal al
Quara show n in Figure 1-5... 27 2-1 Summary of conducted measurements, and sampling frequency... 45
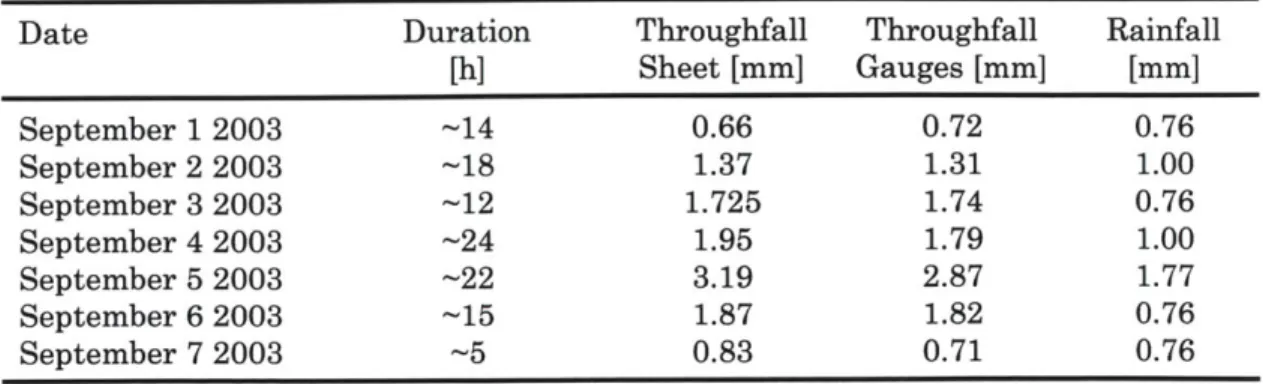
2-2 Throughfall (two different measurement methods) and rainfall collected for precipitation events from September 1 through
S eptem b er 7. ... 62 2-3 Correlation coefficients and slope on the linear regression for the
relation between rainfall and throughfall at different accumulation
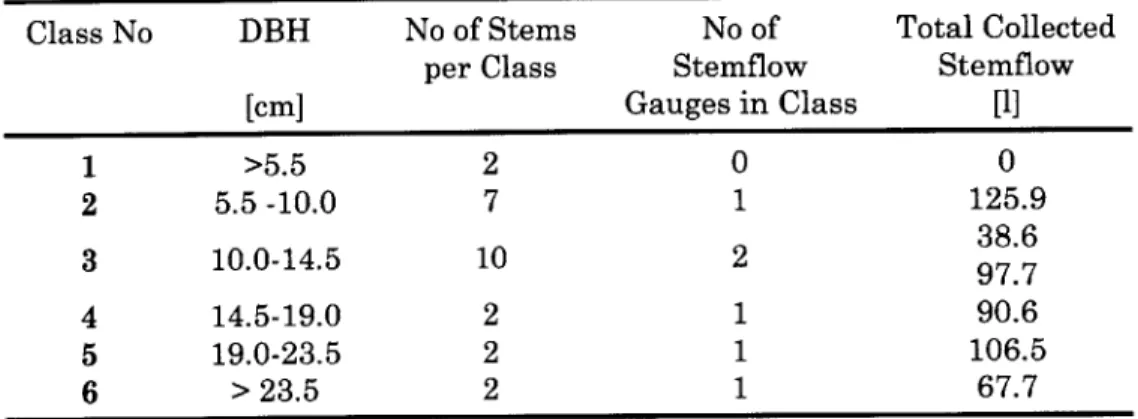
intervals, measurements from khareef in 2003... 66 2-4 Numbers of stems per stem class size and total collected stemflow per
class in 2004 ... 68 3-1 Listing of measured rain, through-fall and stem-flow for the years
2003 and 2004 ordered highest measured stem-flow to lowest measured stemflow. Marked light gray are periods with overflowing stem flow collectors. The percentage in the last column is %=
stemflow[mm]/net precipitation, where total precipitation is the sum of stemflow and throughfall for a given period. The period September 1 to September 15 2004 had khareef throughfall, but no stemflow was recorded... 83 5-1 Overview over input for all IBIS model runs, for all simulations done
in this research, unless explicitly stated ... 117 5-2 Overview over LAIs for upper (trees) and lower (canopy) at the end of
model runs with accumulated khareef precipitation of 300mm, 400mm and 500mm, and for 100% cloud cover during khareef (with clouds),
and rem oved cloud cover (no clouds)... 122
6-1 Overview over the model experiments performed for the sensitivity analysis on soil texture and rooting depth. All experiments were
performed for sand, sandy loam and clay loam... 137 6-2 Overview of the efficient depths predicted for each soil type for
different scenarios. Given are LAIs, soil evaporation (Eo), and transpiration (Ev). Other sinks in the water balance are negligible
7-1 List of characteristic radii of the collectors (A, Equation 7.11) and the parameter for the calculation of the impaction efficiency (a, Equation
7.10) for the horizontal precipitation model. The factors are originally by Zhang et al. (2001) defined for different prevailing landscapes called Land Use Category (LUC) in the Canadian Aerosol Module
(CAM). The parameters were re-assigned according to IBIS
Vegetation Types (PVTs). In the original formulation the parameter A takes different values for different seasons of the year. Since the cloud immersion period is equivalent with the growing season, the
growing season values were selected... 164
7-2 Calculated k and their standard deviations for all clouds below 2km for cases where no drizzle detected (reproduced from McFarquhar and H eym sfield, 2001). ... 171 7-3 Overview of the input for LWC and droplet radius. (above) derived
time series of droplet radius and LWC from inverting a horizontal precipitation model and assuming an idealized canopy with z0=0.1-h,
and d=2/3-he, where hc=6.5m (measured). Given are the means and standard deviations of droplet diameter and LWC, with zero values
excluded. (below) constant LWC and droplet radius. ... 174
7-4 Results from the forward simulation using the horizontal precipitation model and the derived time series of droplet radii and LWC from Table 7-1 over different idealized canopies with zo=0.1-h, d=2/3-he and he as indicated. Changed was he for grass and the enhancement factor for clustering (c, Eq. 7.12) for tree clusters. The dark shaded areas are the control cases for which the time series were developed. They yield the input precipitation (196mm horizontal, 300mm total)... 177 7-5 Same as Table 7-4 for constant input C1-C6... 178 7-6 Results of the model experiments with IBIS and coupled horizontal
precipitation module. The top shows simulations initialized with deciduous trees, the lower part simulations initialized with grassland. Dark shaded are initial LAIs and white areas are annual values for the last year of the simulation (500 years for all simulations, except for series #1-#3 when initialized with grassland). Shown are annual LAI, tree height (he), annual accumulated total precipitation (Pot), total annual horizontal precipitation (Phz) and contributions from gravitational (vgLWC) and turbulent deposition(vt -LWC). The total annual precipitation includes rainfall (Pt=100mm) such that
P o, = 1.33 -(P,, + Ph )... 185 7-7 Same as Table 7-5, but for constant input pairs C1-C6... 186
Chapter 1
Introduction
"... strategies to combat desertification [...] will be most effective, if
they are based on sound systematic observation and rigorous scientific knowledge and if they are continuously re-evaluated
United Nations Convention to Combat Desertification (1994)
About one third of the earth's land surface is considered arid or semiarid. Although dry, much of this area is used economically, with as much as two thirds used as rangeland (Verstraete and Schwartz, 1991). Human development is closely related to the exploitation of natural resources, like water, soil and use of ecosystems. The pressure on ecosystems rises in parallel with population growth, wealth, and demand for energy and food. The consequences for fragile arid and semi-arid environments have in part been disastrous. Land conversion to range, farm or industrial land has led to loss of soil fertility, depleted water resources, loss of biodiversity or loss of the land to desertification. Clearly, to achieve sustainable development both the needs of the people and the environment have to be
considered. In order to understand how those two goals can be met at the same time in a certain setting, the needs of ecosystems, the needs of humans and consequently the impact of humans to a vulnerable ecosystem must be assessed.
This research discusses a semiarid environment in the region of Dhofar in Oman, where development and increased wealth have led to high pressure on the
surrounding ecosystem, especially from browsing1 cattle (i.e. feeding on the leaves of trees and shrubs). The increase of browsing had dramatic effects leading to
degradation and removal of the existing vegetation. This development has raised the concerns in the local population that the degradation may lead to desertification of the ecosystem. Therefore, efforts are under way to protect the ecosystem and to reforest areas where vegetation was lost. However, these efforts are made difficult due to two factors. First, no record is available on the original distribution of the vegetation, and second, little information about the growth requirements -especially water requirements- of the original vegetation is available. This work intends to increase knowledge about the water availability and requirements of the forests of Dhofar, as well as factors that facilitate tree growth in this environment. It aims at providing decision makers with a knowledge base that helps making educated decisions for forest management as well as for planning of future studies on the forests.
In the following sections we first give an introduction to the geography of the Dhofar region in Oman. We then comment on the connection between hydrologic fluxes and plant development in arid and semiarid regions, and broadly summarize the special hydrologic conditions in cloud forests and their distribution. The last
section gives an outline for the thesis.
1.1 The Geography of the Dhofar Forests
The ecosystem is a coastal cloud oasis, which is completely surrounded by desert. Figure 1-1 shows a satellite image of the Arabian Peninsula, the area of interest marked with a red circle. Visible within the red circle is the half moon shape of a coastal mountain range. During the summer, moist air from the ocean pushesagainst the mountains, resulting in intense cloud immersion. The clouds bring light rainfall and create a moist and cool microenvironment, which allows for lush
vegetation and forest growth.
1 Browsing: livestock feeding on leafs of trees and shrubs, as opposed to grazing (feeding on grass)
Figure 1-1: Satellite Image of the Arabian Peninsula. The region of interest is circled in red; note the half moon shape of the coastal mountain range. Picture provided by the SeaWiFS Project, NASA/Goddard Space Flight Center, and ORBIMAGE, http://visibleearth.nasa.gov.
Location
The region of interest is the coastal plain of Salalah (Oman) and the surrounding hills, called the Jabal al Quara. It is located at about 170N and 540E in the
Southern part of the Arabian Peninsula. The town of Salalah is located in a coastal plain, called Salalah Plain. The plain faces the Indian Ocean to the South. It is bordered by a mountain range of 800-1000m height, which encircles the city in a 80km long half moon shape and extends further along the coast for about 200km to the West. The largest North-South extension of the plain is about 20km.
Climate
The climate of this region is semiarid with a mean annual temperature of about 260C in Salalah (elevation 20m) and 210C at Qairoon Hairiti (a climate station in the Jabal al Quara at 880m elevation). Annual rainfall is 114mm in the plain
(climate station Salalah airport) and 252mm at Quairoon Hairiti.
Figure 1-2 shows the annual cycle of temperature and rainfall as measured in Quairoon Hariti (1989-2001). The climate is seasonal with a wet season in summer and predominantly dry conditions during the rest of the year. The temperature curve shows a dip during the summer. This temporary decline is a result of the persistent cloudiness during the three month khareef season. The precipitation in
spring and winter is a result of occasional strong rainfalls, which occur once every few years, whereas the precipitation in summer is a result of seasonal and yearly returning persistent drizzle rains, the khareef. Precipitation in the region is of four different types (Brooks and Shen, 2000). Each type has different origin, frequency and rainfall intensity:
(1) Tropical cyclones bring heavy rain to the region and occur from mid May to December, once every few years.
(2) Cool air originating from the Northeast monsoon circulation brings precipitation of low intensities a few times per year.
(3) Local strong convection cells may develop at any time of the year. (4) Drizzle rain (khareef) occurs regularly during the wet summer season. Of these rainfall sources the khareef is the most reliable one. The khareef season lasts from mid June through mid September. Figure 1-3 depicts the climatic situation during the khareef. Southerly winds from the ocean bring moist air to the plain that is blocked by the Jabal al Quara mountain range. Consequently, the air is pushed up against the mountains, cools adiabatically and saturates, resulting in cloud immersion and persistent drizzle at the windward facing mountain slopes. As a result, these mountain ranges are covered with lush vegetation and seasonal forests, which are in leaf during the wet khareef season. Figure 1-4 shows typical cloud immersed vegetation during the khareef and the same area after the end of the growing season and leaf shed.
J M A M y J__
Jan Feb Mar Apr May Jun Jul Aug Sep Oct Nov Dec
Figure 1-2: Annual cycle of temperature and precipitation for Quairoon Hairiti (at about 880m elevation), a station within the Jabal al Quara.
S
wind from the desert temperature
profile
wind from
the ocean
plateau
desert
escarpments coastal plain
foothills
forests shrubs grass/bare
Figure 1-3: Scheme of the situation in the Dhofar plane during khareef on a North-South cut through the Jabal al Quara. The distance between the left and right corner of the profile is about 20-40km depending on the location.
180 E 0 E 150- 120-90 -60 - 30-25 CD 20 3 0 15
-3
10(D 10 0 5 0 0N
An(b)
(a)
Figure 1-4: Typical deciduous forest in Dhofar (a) cloud immersed during the khareef
end of July 2003 (b) after the leaf shed end of December 2003. Photographs by Anke Hildebrandt (a) and Mahaad Shamas (b).
The area is located in a zone of large-scale subsidence in the upper atmosphere, leading to persistent stable conditions. Thus, the temperature profile is subject to a temperature inversion, which in summer is located at about 850mb (1000-1500m) (Abdul-Wahab, 2003). Since rising air parcels cannot penetrate the inversion layer, the inversion layer defines the upper cloud limit. Along the inversion the clouds extend backward towards the South, away from the mountain range and lead to cloudy skies and drizzle above the coastal plain. However, the coastal plain receives less rain than the mountains.
Vegetation
The region around Salalah is surrounded by the world's largest sand desert, Rub al'Khali or the Empty Quarter. However, with the help of the cloud cover lush, species rich vegetation thrives. Overall, this ecosystem supports more than 750 terrestrial plant species, of which about 50 are endemic (Miller and Morris, 1988).
Cloudiness in the mountains varies with elevation and according to the exposure of the slopes to the wind from the sea. Therefore, various distinct ecosystems
. Diagrammatic representation of a section through Dhofar
70km 60km 50km 40km 30km ZOkm 10km
1000m"
Figure 1-5: (modified from Morris and Miller, 1988, p xii). Distribution of
vegetation types along the elevation gradient from the coastal plain (A) through the the Jabal al
Quara
to the desert (B). The vegetation is described in Table 1-2. (1) coastal plain; (2) - foothills; (3) - seaward facing slopes, (4) seaward facing plain; (5)dry plateau.
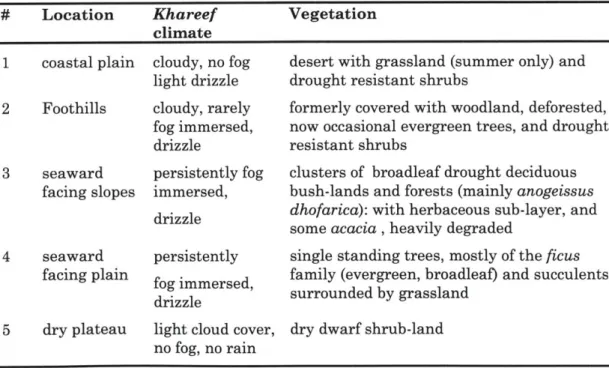
Table 1-1: Vegetation distribution along a N-S transect through the Jabal al
Quarra
shown in Figure 1-5.# Location Kha reef Vegetation
climate
1 coastal plain cloudy, no fog desert with grassland (summer only) and light drizzle drought resistant shrubs
2 Foothills cloudy, rarely formerly covered with woodland, deforested, fog immersed, now occasional evergreen trees, and drought drizzle resistant shrubs
3 seaward persistently fog clusters of broadleaf drought deciduous facing slopes immersed, bush-lands and forests (mainly anogeissus
drzl dhofarica): with herbaceous sub-layer, and some acacia , heavily degraded
4 seaward persistently single standing trees, mostly of the ficus facing plain family (evergreen, broadleaf) and succulents
fog mmered, surrounded by grassland drizzle
5 dry plateau light cloud cover, dry dwarf shrub-land no fog, no rain
distribution of those zones varies with cloud exposure. Figure 1-5 and Table 1-1 summarize the distribution of the ecological zones along a transect through the Jabal al Quara according to Miller and Morris (1988). The coastal plain is covered with xeric vegetation, grassland and some evergreen shrubs. When moving up along the steep mountain slopes more and more shrubs and trees appear; they than form clusters and forests of varying canopy height. Although, the woody plants are of both deciduous and evergreen phenology, deciduous types dominate. Finally, the slopes become less steep and open to high plains, populated by single standing evergreen trees (mostly of the ficus family) surrounded by grassland. When moving away from the high plains, which still receive much cloud and drizzle during the khareef, to the plateau behind the mountain crests, the vegetation again becomes xeric and scarce and finally opens to the sand desert.
The focus of this work will be on the broadleaf deciduous tree cover on the foothills and the seaward facing mountain slopes where dense fog prevails during the khareef. These are the areas with potentially the densest vegetation and which have been affected most by over-browsing and land degradation. The predominant tree species in those areas is anogeissus dhofarica, a broadleaf drought deciduous tree species, which is endemic to the area. Its appearance ranges from low shrubs with canopy gaps to clusters and forests with tress heights of up to 7-8m and closed canopy and a thick herbaceous sub layer.
Forest Use and Degradation
The history of population and sustainable exploration of the coastal plain and mountains of Dhofar goes back thousands of years (Miller and Morris, 1988). Traditionally, the forests have served as a source of food, fuel, fodder, and medical
substances (Miller and Morris, 1988). Animal browsing, in particular, was and is one of the main uses for the forest. Because the prosperity of the people has
substantially improved during the last three decades, the population of cattle has also increased dramatically. Under the pressure of increased browsing, mainly from camels, the once contiguous forest is now degraded and fragmented (Ghanim Al Mahri, Salim Al Ash, August 2002, July 2003, personal communication). In recent years, awareness of the degradation of the forest has increased and efforts are being made for protection and re-forestation. However, there is little published
information about the original extent of the forest or shrub-land and no knowledge about the factors that determine its distribution. This research will help to gain insight into the factors that control and limit plant growth in this region.
1.2 The Vegetation Paradox in Dhofar
Although Dhofar has a distinct wet season, the climate is still dry overall, and water is the dominant limiting factor for plant survival. This section is intended to remind the reader of some aspects of plant survival under water limiting conditions. This is done because most of the research in this thesis will deal with understanding a paradox we found during our investigations of the ecohydrology in Dhofar:
According to climate-vegetation charts, like the one indicated in Bonan (2002, Figure 1-6), we expect annual precipitation for forest to be around 1000mm. The climate in Quiroon Hairiti however has only measured a quarter of this amount. The
presented research makes an effort to explain how trees survive in the Jabal al Quara nevertheless.
Use of water and carbon (i.e. net primary productivity) by plants is strongly linked. In order to uptake C02 from the atmosphere for photosynthesis, plants need to keep their leaf stomata open. Since the inside of the stomata is moist, the plant inevitably loses water as soon as the stomata open. In order to avoid losing leaf tugor (pressure within the leaf) and thus the functionality of the leaf, the plant is forced to close the stomata when water supply to the leaf is limited. By doing so the plant cuts its C02 supply off, and sunlight cannot be transformed into internal energy. Therefore water loss (i.e. transpiration) and carbon gain are strongly coupled, and as a result, availability of water is one of the major determining factors for the net primary productivity of an ecosystem. Net primary productivity depends also on a number of other factors including, temperature, seasonality of the climate, soil type, and availability of nutrients.
In broad terms, the vegetation structure is related to net primary productivity (Figure 1-7) and can therefore be related to water availability, such as shown in Figure 1-8 (both from Lieth and Whittaker (1975)). As the climate becomes drier the upper (tree) canopy opens more and more and gives way to lower canopy woody and
30 25 20 15 10 5 0 -5 -10 -15 Mean Annual Tempwature (*C)
Figure 1-6: (from Bonan, 2002, p 400) Generalized relationships among major plant formations, mean annual temperature, and annual precipitation. Adapted from Whittaker (1975, p. 167).
herbaceous plants until it disappears altogether. From these observations vegetation-climate charts were developed, such as the one by Bonan (2002), reproduced in Figure 1-6. We have included the situation in Dhofar with a red circle. Clearly, judging from this figure we do not expect to find tree vegetation in Dhofar -but we do. Another climate chart (Figure 1-9, from Huggert, 1995) relates the length of the dry season to the total available water during the year for two
different areas, Cuba and India. The wet season in Dhofar is three months long. According to these charts we would expect evergreen dry thorn forest, given an
annual precipitation of 250mm, not a deciduous forest.
In summary, vegetation-climate charts indicate that the tall tree vegetation found in Dhofar is not expected. In order to understand the impact of land degradation, determine areas suitable for reforestation and judge the danger for
4500 4000 3500 3000 2500 2000 1500 1000 500 V
I
f or"s V msn wool InSz 4 3
a4
I
1
I
0 4 0~ SFigure 1-7: (from Lieth and Whittaker, 1975, p 227). Average annual net primary productivity (dry matter) in various tropical ecosystems. * - mean (or individual
value); - range; and o standard error of the mean.
T
I
If
1000 - 0Trees E 00 Shrubs 0 0 0 -, 2 1000-- Trees Sub 2 500 -0 Herbs 2 3 4 5 6 7
Mesic Moisture gradient Xeric
Figure 1-8: (from Lieth and Whittaker, 1975, p 287). Trends in stratal productivity along moisture gradients. o tree stratum; o shrub stratum; A herb
stratum; all values dry matter above ground. Weighted-average indices or relative position of samples along moisture gradient are indicated on horizontal axis. Top: Great Smoky Mountains, Tennessee, Cove forests (mesic) through oak forest
to pine heath (xeric) Note: Values for herb stratum values are multiplied by 10 to show these on the same scale. Data of Whittaker (1966).
Bottom: Santa Catalina Mountains, Arizona. High-elevation fir forest (mesic) through pine forest, woodlands, and desert grassland to Sonoran semi-desert (xeric). Note: Values for both shrub and herb strata were multiplied by 10, the arborescent shrubs and small trees of the semi-desert have been treated as shrubs.) Data of Whittaker and Niering (1975).
Rain forests 0 Seasonal evergreen forests 0 0 M / Semi-deciduous for U -J 'ests M " -- R Humid
Ie0
/ Deciduous monsoon forestsAric
0 Th orn scrub forests
Savanna or semi-desert -Desert I 3,000 2,000-1,000 -E 0 0-*; 4,000 -C 3,000 -2,000 -1,000 -1 2 3 4 5 6 7
Number of dry months
8 9 10 11 12
Figure 1-9: (from Huggert, 1995). Vegetation zones within bioclimatic 'space'. (a) India; (b) Cuba. Sources: (a) after Walter (1962), (b) after Borhidi (1991).
Addition to the original Figure: Red mark - situation in Dhofar.
(b) Rain forests
f
Seasonal evergreen forests
' I U Semi-deciduous forests
00
00
00 0
0 Dry evergreen and thorn forests00 0 0 , - S eri-desert scrubs
0
n .
4,000 - (a)
complete desertification we first need learn more about the factors that limit and enhance natural tree survival in Dhofar.
1.3 Cloud Forest Hydrology
One of the unique features of the khareef season is the complete immersion of the mountain ranges in clouds. The phenomenon is so famous, within and beyond the borders of Oman, that it attracts visitors from around the Arabian Peninsula. Cloud immersion in ecosystems is common elsewhere, mainly in the tropics. Such ecosystems are called cloud forests. The following subsection therefore summarizes the main hydrological features of cloud forests.
Cloud forests occur in a variety of elevation and climates, and consequently have different ecological characteristics. However, they all share the same feature of regular cloud immersion. The most well known cloud forests are those located on wet tropical mountain ranges; a famous example is the Monte Verde cloud forest in Costa Rica. These forests are commonly located in elevation above the zone of montane rainforest and within the zone where clouds form. Cloud forests thrive within a belt of cloud cover, whose elevation depends on location factors like distance from the sea, latitude and sea surface temperature. Tropical cloud forest ecosystems are characterized by an astounding biodiversity and endemism (Bruijnzeel and Hamilton, 2000, Foster, 2001). Because of the high humidity and water availability from the atmosphere, tropical cloud forest canopies are densely and diversely vegetated with mosses, lichens, and epiphytes (bromeliads and orchids).
The cloud cover supports a moist, cool and low irradiance climate within the forests. Irradiance during cloudy conditions is estimated to be only about 10-50% compared to a sunny day (Bruijnzeel and Venklaas, 1998). At the same time the air is frequently saturated. Therefore, potential evaporation and transpiration are both low, with rough estimates of about 300-400mm/year potential evaporation and
250-310mm/year transpiration estimated from four different sites (Bruijnzeel and Proctor, 1995). Although these numbers represent values from a few short time investigations, they give a rough idea of the low water use of cloud forests. At the same time most cloud forests are located in areas with high annual rainfall (greater
than 2000mm). Besides rainfall, water in cloud forests is also gained from a process called horizontal precipitation. In horizontal precipitation, canopies collect cloud water on their leafs. As clouds move through the tree canopies, cloud droplets settle on the leaves and the collected water drips to the ground. This process can lead to situations where more water is available below the canopy than above.
Summarizing, most investigated cloud forests are marked by high rainfall, low water use and, in addition, they receive water from cloud stripping. It would be tempting to conclude that generally in cloud forests water is plentiful, and lack of water does not play a role in those ecosystems. But, this is not true for all cloud forests.
Although rarely mentioned, cloud ecosystems do occur in drier areas, and in those cases researchers often emphasize that the cloud cover is probably the reason for vegetation survival in an otherwise too arid environment. Examples are a montane dry forest in Hawaii with 500mm annual rainfall at 110C annual average temperature (Juvik and Nullet, 1995), rainforests in Australia and Africa, which both showed vegetation features characteristic for moister conditions in isolated areas where clouds were prevalent (Hursh and Pereira, 1957, Ellis, 1971, Hutley et al., 1997). More recently, the importance of fog for forest survival has been
investigated in a seasonal rain forest in China (Liu et al., 2005). In Hawaii and Australia, the cloud cover was shown to decrease transpiration and provide
additional water through horizontal precipitation, which enabled evergreen vegetation growth, despite the presence of a dry season (Juvik and Nullet, 1995,
Hutley et al. 1997). Moreover, cloud cover was assumed to contribute to leaf wetness and therefore early saturation of interception storage, which would allow for
throughfall at very low rainfall intensities (Juvik and Nullet, 1995).
Clearly, the forests in Dhofar do not show the same ecological features as most of the described cloud forests. For example, no epiphytes are found in Dhofar, since the dry season does not allow for the survival of those rootless canopy plants. Nevertheless, the cloud cover may play an important role for the survival of the ecosystem and for explaining the vegetation-rainfall paradox described above. Therefore, a great deal of the research reported here is devoted to investigating the role of cloud cover for the forest survival in Dhofar.
1.4
Outline
The thesis is divided into two main parts. The first part is concerned with a field experiment conducted in the Jabal al Quarra within a forest patch. The second part is dedicated to modeling.
Part I is composed of two chapters. Chapter 2 explains the setup of the field experiment, the data gathered, how they were analyzed and which variables were derived. Chapter 3 presents the results of the field study. These results present for the first time estimates of available water within the Dhofar forest and the seasonal cycle of water fluxes in and out of the ecosystem. It also explains how the forest depends in multiple ways on the presence of the cloud cover during the khareef and why it is therefore a seasonal cloud forest.
Part II is composed of four chapters. Chapter 4 introduces IBIS (Foley et al., 1996), the model used for the numerical experiments conducted in the subsequent chapters. The model was also modified with regard to the re-presentation of root water uptake, and those changes are explained. Chapter 5 shows that IBIS is able to simulate the deciduous tree vegetation and observed hydrology in Dhofar, when forced with observed meteorological input. It also shows that the cloud cover plays an important role in tree survival by decreasing net radiation during the khareef season and prolonging the growing season for trees. When the radiance during the khareef is changed to "sunny" conditions, the growing season is substantially
shortened and tree vegetation is replaced with grasses. Chapter 6 investigates the dependence of tree survival on available rooting depth, and shows that at a
characteristic rooting depth tree performance is maximized. This is the depth at which transpiration is maximized and all other losses minimized. The characteristic depth depends on the climate and soil type. Finally, Chapter 7 introduces an
additional module for IBIS that allows for modeling of horizontal precipitation. This chapter reports the results of a study on the role of horizontal precipitation in cloud forest survival. With the coupled model, we test the hypothesis that horizontal precipitation over grassland is not sufficient to allow for tree emergence. We demonstrate that (for most assumed cloud properties) equilibrium vegetation emerging from grass cover is dominated by grass cover, whereas under the same conditions equilibrium vegetation emerging from forests is dominated by forest. We
therefore conclude that tree reemergence from grassland may be substantially inhibited in Dhofar. Conclusions and recommendations for forest management and future work are discussed in Chapter 8.
PART I
Chapter 2
2.1 Introduction
One of the main purposes of this work is to improve our understanding of the hydrology and in particular the water balance of an established cloud forest in the Dhofar Mountains. Previous fieldwork in Dhofar had involved rainfall
measurements, but no knowledge was available on other hydrological variables. For example, at the beginning of this work, no information on soil moisture, radiation or evapotranspiration within the Dhofar forests was available. Also, while estimates for horizontal precipitation had been made using artificial vegetation, capturing devices and single standing trees, no measurements within the characteristic vegetation of the Dhofar forests had yet been conducted. Consequently, the total precipitation was unknown. Naturally, in order to understand impacts of
deforestation, it is first necessary to gain insight into hydrology of the undisturbed system. A field experiment was therefore set up in a pristine forest patch. The instrumentation was chosen such that it will allow for a qualitative and quantitative description of the water fluxes in and out of the forest. Furthermore, a climate station will deliver input data for the modeling study conducted in part II of this thesis. We measured meteorological data, as well as throughfall, stemflow, soil moisture and transpiration.
The following chapter first gives some information about the experimental site, then describes the instrumentation and measurements performed. Finally the processing of the data is described.
2.2 Site Properties
The field experiment was set up in the Dhofar Mountains, in a forest patch at about 17.120N, 54.60E approximately 450m above sea level and 20km away from the coast.
Figure 2-1 shows a picture of the site. Since the site it located near the village called Gogub, it will be referred to in the rest of this work by this name. The site itself is sloped between 0-100 southward (1700 from North), which is also the prevailing wind direction during the monsoon season. The vegetation is a mono-stand of annogeissus dhofarica, a perennial broad- leaved drought deciduous tree, which is
endemic to this region (Miller and Morris, 1988). It has been reported that trees put on leaves just before the first rains (Miller and Morris, 1988) and loose them during the dry season. Our personal observation is that the first rains trigger leaf-flush and leaves are shed in December; this is three month into the dry season (personal observation, communication Mansoor Amerjeed, Mahaad Shamas, Ghanim Al
Mahari, 2003/ 2004). The under-story is composed of annual herbs and grasses. The height of the upper canopy is about 6.5m. The lower canopy reaches heights of up to 0.5m during the monsoon season and dies back to bare ground after the end of the
Figure 2-1: Field site of Gogub. The deciduous anogeissus dhofarica trees surrounds the tower with mounted meteorological sensors at 9m height.