HAL Id: hal-02745226
https://hal.inrae.fr/hal-02745226
Submitted on 3 Jun 2020HAL is a multi-disciplinary open access
archive for the deposit and dissemination of sci-entific research documents, whether they are pub-lished or not. The documents may come from teaching and research institutions in France or abroad, or from public or private research centers.
L’archive ouverte pluridisciplinaire HAL, est destinée au dépôt et à la diffusion de documents scientifiques de niveau recherche, publiés ou non, émanant des établissements d’enseignement et de recherche français ou étrangers, des laboratoires publics ou privés.
Testing the ability of ADM1 to represent the anaerobic
digestion of microalgae
Francis Mairet, Olivier Bernard, Monique Ras, Laurent Lardon, Jean-Philippe
Steyer
To cite this version:
Francis Mairet, Olivier Bernard, Monique Ras, Laurent Lardon, Jean-Philippe Steyer. Testing the ability of ADM1 to represent the anaerobic digestion of microalgae. 8. IWA Symposium on Systems Analysis and Integrated Assessment, Jun 2011, San Sebastian, Spain. �hal-02745226�
Testing the ability of ADM1 to represent the anaerobic
digestion of microalgae
Francis Mairet*, Olivier Bernard*, Monique Ras**, Laurent Lardon**,Jean-Philippe Steyer** * COMORE-INRIA, BP93, 06902 Sophia-Antipolis Cedex, France
(e-mail: {francis.mairet, olivier.bernard}@inria.fr)
** INRA, UR050, Laboratoire de Biotechnologie de l'Environnement, Avenue des Etangs, Narbonne F-11100, France
(e-mail: {rasm, lardonl, jean-philippe.steyer}@supagro.inra.fr) Abstract
The coupling between a microalgal pond and an anaerobic digester is a promising alternative for sustainable energy production by transforming carbon dioxide into methane using light energy. In this paper, we test the ability of the original ADM1 and a modified version (using Contois kinetics for the hydrolysis steps) to represent microalgae digestion. Simulations were compared to experimental data of an anaerobic digester fed with
Chlorella vulgaris. The modified ADM1 fits adequately the data for the considered 140 day experiment, and
turns out to be a reliable predictive tool. Keywords
Anaerobic digestion, Chlorella vulgaris, hydrolysis, kinetic model, microalgae
INTRODUCTION
In recent years, microalgae have been widely investigated for biofuel production (Chisti, 2007). Coupling microalgae culture and anaerobic digestion has emerged as a promising process to convert solar energy into methane. Nevertheless, the anaerobic digestion of microalgae faces several hurdles (Sialve et al., 2009). A dynamical model of microalgae anaerobic digestion can therefore be of crucial help for apprehending the process complexity and for identifying optimal working strategies.
Modelling of anaerobic digestion has been widely developed since the seventies (Lyberatos and Skiadas, 1999), from simple models (e.g. considering one limiting reaction (Graef and Andrews, 1974) or two reactions (Bernard et al., 2001)) to more realistic representations (e.g. the IWA anaerobic digestion model # 1 - ADM1 - (Batstone et al., 2002) with 19 biochemical reactions). However, to our knowledge, none of these models has yet been applied using microalgae as feedstock. In this paper, we investigate the ability of the Anaerobic Digestion Model 1 (Batstone et al., 2002) to describe microalgae digestion. Model simulations are compared with experimental data of anaerobic digestion of the freshwater microalgae
Chlorella vulgaris (Ras et al., 2011).
METHODS
Experimental device
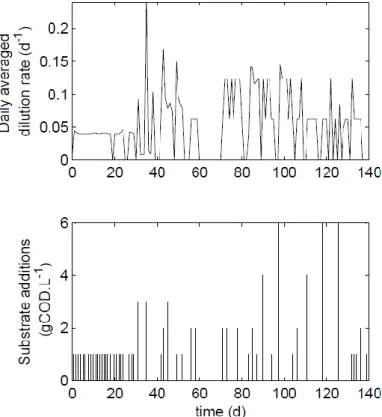
Anaerobic digestion of microalgae was performed over 140 days in a continuously mixed reactor at 35°C without pH control. The reactor was fed by daily additions with a
concentrated stock of the freshwater microalgae Chlorella vulgaris, harvested after settling. Figure 1 shows the daily dilution rate average together with the substrate additions. For more details on the experiment protocol see Ras et al. (2011).
Figure 1. Operating conditions for the anaerobic digestion of the freshwater microalgae Chlorella vulgaris.
Modelling approach
ADM1
ADM1 (Batstone et al., 2002) describes the different steps of anaerobic digestion: disintegration, hydrolysis, acidogenesis, acetogenesis, and methanogenesis. This model accounts for 19 biochemical reactions associated to 7 bacterial populations. ADM1 has been widely used to describe the anaerobic digestion of various substrates (Batstone et al., 2006; Parker, 2005).
Modification of the hydrolysis step
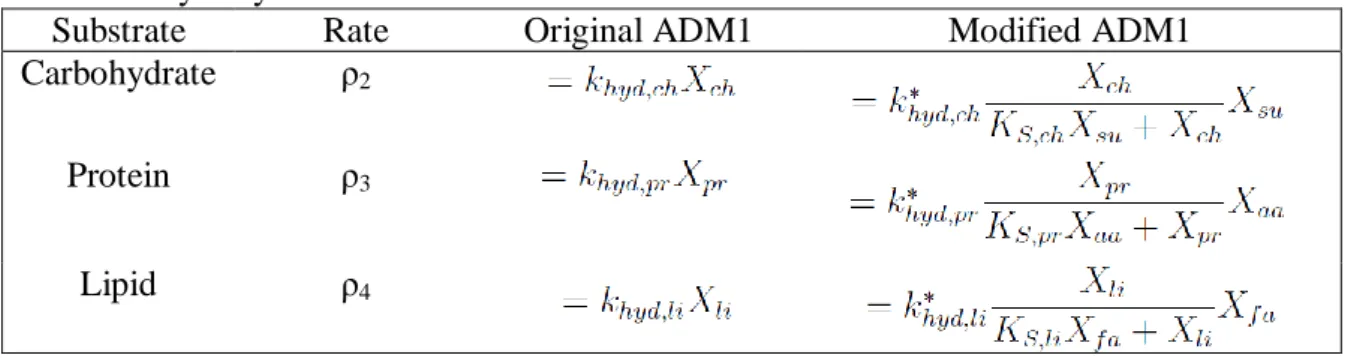
Hydrolysis is a complex multi-step process which is not well understood. In ADM1, the hydrolysis rates are taken as first order kinetics. Nevertheless, in some cases, hydrolysis can be better represented by the Contois model (Vavilin et al., 2008), which assumes that the kinetics does not depend on the substrate concentration, but on the amount of substrate per biomass unit. We therefore propose to use the Contois model associated to the benefiting bacteria population. The modifications of the hydrolysis rates are presented in table 1.
Table 1. Hydrolysis rates
Substrate Rate Original ADM1 Modified ADM1
Carbohydrate ρ2
Protein ρ3
Lipid ρ4
ADM1 implementation
ADM1 was simulated using Rosen and Jeppsson (2006) implementation under Matlab.
Reaction rates ρ2, ρ3, and ρ4 are taken according to table 1. Moreover, feeding with impulses
generates transients in the transfer from the gas to the liquid (i.e. a negative specific mass
transfer rate of CO2 : ρT,10 < 0), with pressure in the headspace Pgas which can become smaller
than Patm. Therefore, the gas flow rate is computed as follows:
where kp is the pipe resistance coefficient (Batstone et al., 2002).
Influent characterisation
The input characterisation is a critical step in modelling anaerobic digestion (Kleerebezem
and Van Loosdrecht, 2006). The inlet concentration was 30 kg COD.m-3 with approximately
90% of particulate matter. We assume that the soluble COD is mainly composed of sugars
(Hulatt and Thomas, 2010). This leads to Xc,in = 27 kg COD.m-3 and Ssu,in = 3 kg COD.m-3.
pH in the influent was not monitored but it ranges between 9 and 10 (this high pH results from CO2 uptake by microalgae in the settler). Inorganic carbon in the influent is computed assuming CO2 at equilibrium with its atmospheric partial pressure. Then, pH is computed on
the basis of CO2 (= KH,CO2 Patm,CO2 ), Scat,in and San,in which drive the charge balance. The input
characterisation is given in table 2.
Table 2. Input characterisation (the other state variables are null)
Parameter Value Meaning
Ssu,in 3 kg COD.m-3 Sugar concentration
Xc,in 27 kg COD.m-3 Composite concentration
SIC,in 0.019 M Inorganic carbon concentration
SIN,in 0.011 M Inorganic nitrogen concentration
Scat,in 0.024 M Inert cation concentration
San,in 0.0065 M Inert anion concentration
pHin 9.6
Parameter identification
The coefficients fch;xc, fpr;xc, fli;xc,fxI;xc, and fsI;xc represent the fraction of the substrate into the
The microalgae composition is species dependent but it can also vary with the environmental conditions (Mairet et al., 2011). In non-limited growth, the average biochemical composition (in dry weight (DW)) for Chlorella vulgaris is: protein 60%, lipid 20% and sugar 20% (Becker, 2007). Using approximate elemental compositions for protein
(C4.43H7O1.44N1.16S0.019), lipid (C40H74O5) and sugar (C6H12O6) (Geider and Roche, 2002), this
biochemical composition leads to a C/N ratio of 5.9, which is in line with the measured ratio of 6. The conversion from g DW to g COD is computed for protein (1.76 g COD/g DW), lipid (2.83 g COD/g DW) and carbohydrate (1.07 g COD/g DW) using the approximate elemental compositions. The inert part is computed from the experimental data of batch experiments (data not shown). Assuming that the inert part composition is equal to the algae's one, we can
finally compute the coefficients fch;xc, fpr;xc, fli;xc,fxI;xc, and fsI;xc.
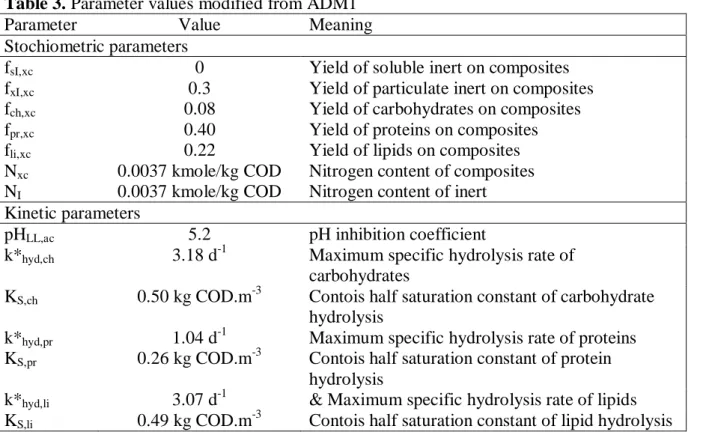
Concerning the kinetic parameters, it appears that the pH inhibition terms affect strongly the methanogenesis step while such inhibition was not observed experimentally. Therefore, a
lower value of parameter pHLL,ac has been used (5.2 instead of 6). For the original ADM1, the
other parameter values were not changed. Parameters of the Contois model are identified by trial and errors to fit the experimental data. Parameter values modified from the original ADM1 are given in table 3.
Table 3. Parameter values modified from ADM1
Parameter Value Meaning
Stochiometric parameters
fsI,xc 0 Yield of soluble inert on composites
fxI,xc 0.3 Yield of particulate inert on composites
fch,xc 0.08 Yield of carbohydrates on composites
fpr,xc 0.40 Yield of proteins on composites
fli,xc 0.22 Yield of lipids on composites
Nxc 0.0037 kmole/kg COD Nitrogen content of composites
NI 0.0037 kmole/kg COD Nitrogen content of inert
Kinetic parameters
pHLL,ac 5.2 pH inhibition coefficient
k*hyd,ch 3.18 d-1 Maximum specific hydrolysis rate of
carbohydrates
KS,ch 0.50 kg COD.m-3 Contois half saturation constant of carbohydrate
hydrolysis
k*hyd,pr 1.04 d-1 Maximum specific hydrolysis rate of proteins
KS,pr 0.26 kg COD.m-3 Contois half saturation constant of protein
hydrolysis
k*hyd,li 3.07 d-1 & Maximum specific hydrolysis rate of lipids
KS,li 0.49 kg COD.m-3 Contois half saturation constant of lipid hydrolysis
RESULTS AND DISCUSSION
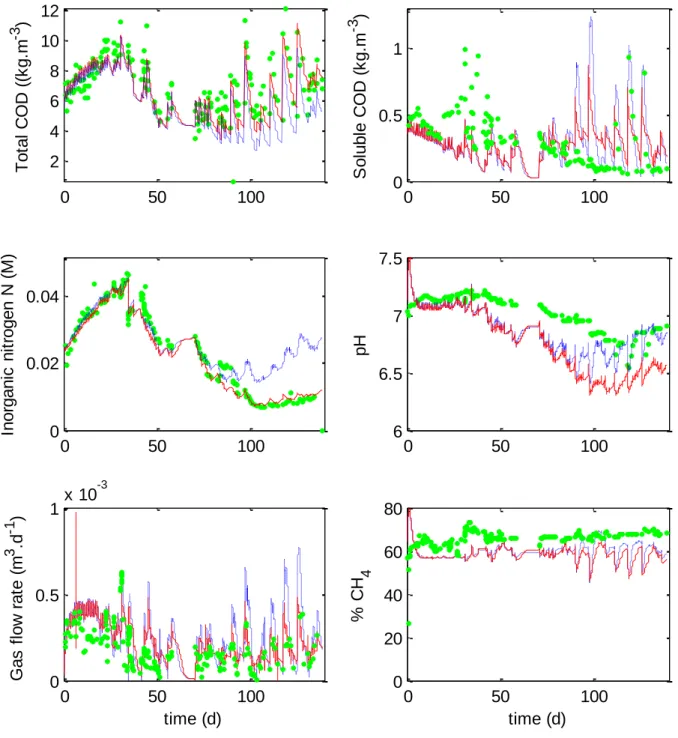
The original version of ADM1 shows a good ability in describing microalgae digestion (see Fig.2 and 3), except at the end of the experiment when a high dilution rate was applied: the model overestimates inorganic nitrogen release. The low experimental ammonium release
means that there is an accumulation of nitrogen as proteins Xpr or amino-acids Saa. As the
soluble COD remains low, we can suppose that there is an accumulation of Xpr together with a
low protein hydrolysis rate ρ3. The original ADM1 could not catch these dynamics even after
adapting the parameter values.
0 50 100 2 4 6 8 10 12 T o ta l C O D ( (k g .m -3 ) 0 50 100 0 0.5 1 S o lu b le C O D ( k g .m -3 ) 0 50 100 0 0.02 0.04 In o rg a n ic n it ro g e n N ( M ) 0 50 100 0 0.5 1 x 10 -3 G a s f lo w r a te ( m 3 .d -1 ) time (d) 0 50 100 0 20 40 60 80 % C H 4 time (d) 0 50 100 6 6.5 7 7.5 pH
Figure 2. Comparison between the original ADM1 (blue dashed lines), the modified ADM1
(red lines) and experimental data (green dots) of Chlorella vulgaris digestion. The modified ADM1 describes accurately the experimental data. In particular, the good representation of inorganic nitrogen concentrations (Fig.2) is a first hint that including the Contois model for the hydrolysis step in ADM1 improves its ability to describe microalgae digestion.
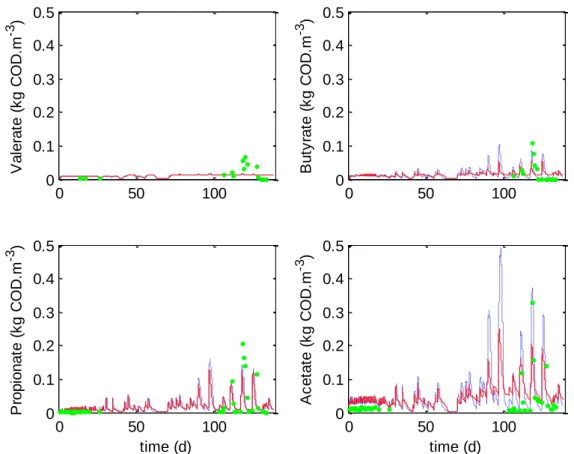
The model predicts low VFA concentrations (Fig.3), except during transients after the successive increasing inputs at the end of the experiment (after day 100), which is in agreement with the experimental data. The gas flow rate is well predicted (Fig. 2), but the methane content is slightly underestimated. This discrepancy in the methane content is
0 50 100 0 0.1 0.2 0.3 0.4 0.5 V a le ra te ( k g C O D .m -3 ) 0 50 100 0 0.1 0.2 0.3 0.4 0.5 B u ty ra te ( k g C O D .m -3 ) 0 50 100 0 0.1 0.2 0.3 0.4 0.5 P ro p io n a te ( k g C O D .m -3 ) time (d) 0 50 100 0 0.1 0.2 0.3 0.4 0.5 A c e ta te ( k g C O D .m -3 ) time (d)
Figure 3. VFA concentrations: comparison between the original ADM1 (blue dashed lines),
the modified ADM1 (red lines) and experimental data (green dots) of Chlorella vulgaris digestion.
Since all the intermediate substrates or products were not measured separately, estimations of their dynamics can be obtained with model simulation (Fig. 4). From the 50th day onwards, when a high dilution rate was applied, the modified ADM1 predicts an accumulation of
protein Xpr. On the other hand, carbohydrates and lipids are almost completely hydrolysed
because of a higher maximal hydrolysis rates of Xch and Xli. This phenomena leads to a
release of inorganic nitrogen which was not correlated to the methane production, as it was observed experimentally (Ras et al., 2011).
Figure 4. Model prediction of carbohydrate (blue line), protein (green line) and lipid (red
line) concentrations during Chlorella vulgaris digestion. The high dilution rate at the end of the experiment leads to an accumulation of proteins.
CONCLUSION
In this work, we have proposed a slightly modified version of ADM1 (including Contois model for hydrolysis) for representing anaerobic digestion of microalgae. This model fits adequately the data of the 140 day experiment of Chlorella vulgaris digestion.
The ability of ADM1 (originally proposed for activated sludge digestion) to represent microalgae digestion confirms the observation of Ras et al. (2011): activated sludge and microalgae digestions show similar trends. Therefore, microalgae digestion could probably benefit of all the improvement obtained with activated sludge (pre-treatment, reactor design, simulation and control...).
Acknowledgements: This work benefited from the support of the Symbiose research project
founded by the French National Research Agency (ANR). The authors thank Dr. Ulf Jeppsson and Dr. Christian Rosen, Lund University, Sweden, for providing the Matlab implementation of ADM1.
REFERENCES
Batstone, D., Keller, J., Angelidaki, R. I., Kalyuzhnyi, S. V., Pavlostathis, S. G., Rozzi, A., Siegrist, W. T. M. S. H. and Vavilin, V. A. (2002). Anaerobic Digestion Model No. 1 (ADM1). IWA Publishing, London.
Batstone, D., Keller, J. and Steyer, J.P. (2006). A review of ADM1 extensions, applications, and analysis: 2002-2005. Water science and technology 54 (4), 1-10.
Becker, E. (2007). Micro-algae as a source of protein. Biotechnology advances 25(2), 207-210.
Bernard, O., Hadj-Sadok, Z., Dochain, D., Genovesi, A. and Steyer, J.P. (2001). Dynamical model development and parameter identification for an anaerobic wastewater treatment process. Biotechnology and Bioengineering 75, 424-438.
Geider, R. J. and Roche, J. L. (2002). Redfield revisited : variability of C:N:P in marine microalgae and its biochemical basis. European Joural of Phycology 37, 1-17.
Graef, S. P. and Andrews, J. F. (1974). Mathematical modeling and control of anaerobic digestion. Water Research 8, 261-289.
Hulatt, C. and Thomas, D. (2010). Dissolved organic matter (DOM) in microalgal
photobioreactors: A potential loss in solar energy conversion? Bioresource Technology 101 (22), 8690-8697.
Kleerebezem, R. and Van Loosdrecht, M. (2006). Waste characterization for implementation in ADM1. Water Science & Technology 54 (4), 167-174.
Lyberatos, G. and Skiadas, I. (1999). Modelling of anaerobic digestion - a review. Global
NEST Journal 1 (2), 63-76.
Mairet, F., Bernard, O., Masci, P., Lacour, T. and Sciandra, A. (2011). Modelling neutral lipid production by the microalga Isochrysis affinis galbana under nitrogen limitation. Bioresource
Technology 102, 142-149.
Parker, W. (2005). Application of the ADM1 model to advanced anaerobic digestion.
Bioresource technology 96 (16), 1832-1842.
Ras, M., Lardon, L., Sialve, B., Bernet, N. and Steyer, J.-P. (2011). Experimental study on a coupled process of production and anaerobic digestion of Chlorella vulgaris. Bioresource Technology 102, 200-206.
Rosen, C. and Jeppsson, U. (2006). Aspects on ADM1 Implementation within the BSM2 Framework. Department of Industrial Electrical Engineering and Automation, Lund University, Lund, Sweden.
Sialve, B., Bernet, N. and Bernard, O. (2009). Anaerobic digestion of microalgae as a necessary step to make microalgal biodiesel sustainable. Biotechnol. Advances 27, 409-416. Vavilin, V., Fernandez, B., Palatsi, J. and Flotats, X. (2008). Hydrolysis kinetics in anaerobic degradation of particulate organic material: An overview. Waste Management 28(6), 939-951. _______________________________________________________________________________8th IWA Symposium on Systems Analysis and Integrated Assessment