HAL Id: hal-03110665
https://hal.archives-ouvertes.fr/hal-03110665
Submitted on 14 Jan 2021HAL is a multi-disciplinary open access
archive for the deposit and dissemination of sci-entific research documents, whether they are pub-lished or not. The documents may come from teaching and research institutions in France or abroad, or from public or private research centers.
L’archive ouverte pluridisciplinaire HAL, est destinée au dépôt et à la diffusion de documents scientifiques de niveau recherche, publiés ou non, émanant des établissements d’enseignement et de recherche français ou étrangers, des laboratoires publics ou privés.
FT-IR spectroscopy study of HNCO adsorption and
hydrolysis over oxide-based samples dedicated to deNO
x processes
M. Barreau, Xavier Courtois, F. Can
To cite this version:
M. Barreau, Xavier Courtois, F. Can. FT-IR spectroscopy study of HNCO adsorption and hydrolysis over oxide-based samples dedicated to deNO x processes. Applied Catalysis A : General, Elsevier, 2018, 552, pp.147 - 153. �10.1016/j.apcata.2017.12.019�. �hal-03110665�
1 Applied Catalysis A: General 552 (2018) 147-153 DOI: 10.1016/j.apcata.2017.12.019
FT-IR spectroscopy study of HNCO adsorption and hydrolysis over oxide-based
samples dedicated to deNO
xprocesses.
M. Barreau, X. Courtois* and F. Can* University of Poitiers, CNRS, UMR 7285
Institut de Chimie des Milieux et Matériaux de Poitiers (IC2MP) 4 rue Michel Brunet – TSA 51106 – 86073 Cedex 9, France Fax: (+) +33 5 49 45 37 41
E-mail: xavier.courtois@univ-poitiers.fr; fabien.can@univ-poitiers.fr
Abstract: HNCO adsorption monitored by FT-IR spectroscopy was performed over a wide range of oxides from various acid-base and redox properties: SiO2, Al2O3, TiO2, ZrO2, CeO2, CeO2-ZrO2, WO3/CeO2
-ZrO2. HNCO adsorbed dissociatively in the whole studied samples. A correlation with pyridine 8a
wavenumbers revealed that HNCO dissociation mainly involved weak Lewis acid sites (LAS) location. The significant isocyanate adsorption capacity of titania and zirconia was evidenced. HNCO hydrolysis reaction was also investigated. Among the various studied samples, CeO2-ZrO2 and WO3/CeO2-ZrO2
presented the higher HNCO hydrolysis rate, with ammonia formation from room temperature. For all studied samples, –NCO groups were evidenced as intermediate species of HNCO hydrolysis.
2
1. Introduction
NOx emissions control from lean-burn engines remains an important challenge for the academic and
industrial communities. Among the various processes available to perform NOx (NO and NO2)
abatement, the NOx storage reduction (NSR) and the selective catalytic reduction (SCR) processes are
viable solutions to control NOx emission in excess of oxygen. Interestingly, whatever the considered
reductants, both technologies involve mechanisms implying the formation of reactive species like –CN and –NCO, possibly leading to ammonia formation, as key intermediates in the N2 formation. For
instance, such species were identified during the lean NOx reduction by propene over various materials
such as perovskites [i], supported transition metals [ii], or supported noble catalysts[iii]. Use of alkanes like propane [iv] or decane [v] also led to NH3 intermediate species over Cu-ZSM-5 exchanged zeolite,
as well as during the NOx reduction process by ethanol over Ag/Al2O3 catalyst [vi]. In fact, the direct use
of ammonia as reductant is one of the most efficient process to reduce NOx from gaseous mixtures
containing an excess of oxygen, initially developed for stationary sources. Nevertheless, on boarded ammonia is not suitable (highly toxic and corrosive) and the automotive industry has commonly adopted the safer Urea-SCR technology. Urea (NH2-CO-NH2) is theoretically decomposed in ammonia via two
consecutives reactions: the “urea thermolysis” (Eq. 1) leading to NH3 and HNCO, and the “HNCO
hydrolysis” (Eq. 2), leading to the second NH3 molecule.
(NH2)CO(NH2) NH3 + HNCO (1)
HNCO + H2O NH3 + CO2 (2)
The HNCO hydrolysis reaction was previously studied in the literature to ensure the desired production of ammonia [vii].Recently, the competitive reactivity of the HNCO intermediate species with NOx was also evidenced during urea-SCR process [viii]. In addition to the desired hydrolysis reaction, it
has been showed that HNCO also competes with O2 and NOx. During the SCR process, a mix of both NO
and NO2 was evidenced to react with HNCO and contribute to the NOx reduction, resulting in another
deNOx pathway [viii].
Finally, mechanistic studies agree that isocyanate species (–NCO) are highly reactive intermediates toward NO+O2 and/or surface nitrite or nitrate species to produce N2. Consequently, the study of HNCO
and –NCO interactions with surface of catalysts appears essential to highlight the deNOx chemistry.
Obviously, despite a major interest due to its importance as an intermediate in virtually all the deNOx
reactions, its surface reactivity is poorly documented. Indeed, HNCO is not available as commercial product and only few means are reported to produce pure gaseous HNCO. In this work, gaseous isocyanic acid was obtained from the decomposition of cyanuric acid, based on the work published by Perry et al. [ix]. The present work is a first step in a deeper characterization of competitive reactions of gaseous HNCO and isocyanates species with the exhaust gas components like NOx. Consequently, the
3
HNCO adsorption and hydrolysis reaction was firstly studied by infrared spectroscopy over various oxides selected for their different acid-base and redox properties (SiO2, Al2O3, TiO2, CeO2, ZrO2, CeO2
-ZrO2 and supported WO3/CeO2-ZrO2).
2. Material and methods
Materials used in this study are listed in Table 1. Silica was used as model material for FTIR characterization, alumina as model heterogeneous oxide support, titania and zirconia as model catalysts for urea thermolysis and HNCO hydrolysis, respectively, ceria and ceria-zirconia (40wt% of CeO2,
thereafter denoted Ce-Zr) as model redox oxides and finally WO3/Ce-Zr as model supported SCR catalyst
[x-xii]. All oxides were provided by chemical companies as reported in Table 1, except for supported WO3 catalyst. For this sample, Ce-Zr support (provided by Solvay) was first calcined 4 hours under air at
700°C. Tungsten (6wt% WO3) was added by wet impregnation at 60°C under continuous agitation using
an aqueous solution of ammonium metatungstate. After drying at 80°C, the preparation was placed in an oven at 120°C during a night. Finally all samples were calcined in wet air 4 hours at 700°C (heating rate: 5° min-1).
Specific surface areas were determined by nitrogen adsorption at 77 K using the BET method (Tristar 3000, Micromeritics). Prior to the N2 physisorption, the samples were degassed under vacuum 2 h at
250°C.
Catalysts were characterized by powder X-ray diffraction using a Bruker D5005 diffractometer equipped with a monochromatized Cu K radiation ( = 1.5418 Å) operated at 40 kV and 30 mA. The
diffraction patterns were recorded in the 15-75° 2 value range, with a step of 0.04 ° sec-1 and a step
time of 6 s. Crystalline phases were identified by comparison with ICDD database files.
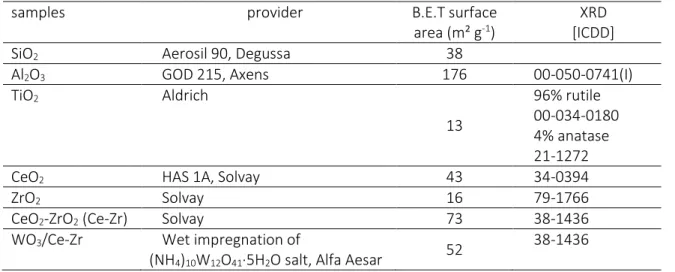
Table 1. Physical properties of the studied samples.
samples provider B.E.T surface
area (m² g-1)
XRD [ICDD]
SiO2 Aerosil 90, Degussa 38
Al2O3 GOD 215, Axens 176 00-050-0741(I)
TiO2 Aldrich 13 96% rutile 00-034-0180 4% anatase 21-1272
CeO2 HAS 1A, Solvay 43 34-0394
ZrO2 Solvay 16 79-1766
CeO2-ZrO2 (Ce-Zr) Solvay 73 38-1436
WO3/Ce-Zr Wet impregnation of
(NH4)10W12O41·5H2O salt, Alfa Aesar 52
4
The surface acidity of materials was evaluated by pyridine adsorption monitored by IR spectroscopy. IR spectra were collected with a Nexus Nicolet spectrometer equipped with a DTGS detector (Deuterium TriGlyceride Sulfur) and a KBr beam splitter. IR spectra were recorded with a resolution of 4 cm-1 and 64
scans. The presented spectra were normalized to a disc of 10 mg/cm2. After sample activation at 400 °C
(residual pressure of about 5.10-5 hPa), pyridine was adsorbed (200 Pa at equilibrium) at room
temperature (RT). Desorption was performed up to 400 °C, by temperature step of 50 °C under dynamic vacuum.
Interaction of HNCO with oxide solids was studied by transmission mode infrared spectroscopy using a home-made dynamic cell, presented in Fig. 1. The sample holder is associated with a screw which allow to move away the wafer from the infrared beam to record gas phase spectra, while the sample remains in heated zone of the oven. Consequently, the design of this specific IR cell enables to collect IR spectrum of adsorbed species and gaseous compounds at the same temperature (25-400 °C). IR spectra were recorded on a Nicolet 6700 spectrometer equipped with a MCT detector and a KBr beamsplitter using a resolution of 4 cm-1 and 64 scans. Samples were pressed as self-supported wafer
(disc of about 20 mg, 2 cm2) and were firstly treated in situ in the cell at 400 °C under dynamic vacuum
(residual pressure of about 5.10-5 hPa).
5
Isocyanic acid was produced by depolymerising the cyclic trimer of cyanuric acid (provided by Alfa Aesar, 99 % purity) after heated at 340°C, in accordance with Eq. 3 [ix].
3 O=C=NH (3)
Cyanuric acid, a nontoxic triazine white powder, was placed on a round-bottom flask with a located controlled heated zone connected to the vacuum manifold system of FT-IR experiments. After heated at 340 °C, the equilibrium HNCO pressure was about 10 hPa. Pure isocyanic acid was then expanded in the cell via calibrated doses at RT up to equilibrium by addition of accurately known increments. First, experiments were performed without oxide, in order to ensure a calibration by integrating gaseous HNCO bands. Then, HNCO adsorption was investigated over the studied oxide. At equilibrium (10 hPa), a spectrum of the gas phase was recorded, allowing to determine the amount of HNCO not adsorbed by the oxide tested. By subtracting the remaining amount to the initial amount of HNCO, an absorption capacity of each oxide can be deduced at RT.
A second set of experiments were performed with similar procedure but with water co-adsorption in order to highlight HNCO hydrolysis rate over the studied oxides. In this case, cyanuric acid was heated until the equilibrium HNCO pressure reach 5 hPa. Water was then added, by another round-bottom flask, in order to reach a total pressure of 10 hPa, corresponding to a HNCO/H2O ratio of 1. IR spectra
of adsorbed species and gas phase were then recorded from RT up to 400 °C, by 25 °C step.
Presented spectra were normalized to a disc of 10 mg cm-² and the reference spectra (recorded after
calcination at RT) were systematically subtracted to highlight the adsorbed species.
3. Results and discussion
3.1 XRD characterisation
The XRD patterns (supplementary material, Fig. S1) of selected oxides were consistent with the literature. Alumina material displayed the classical γ-Al2O3 structure [ICDD PDF n° 00-050-0741(I)]. TiO2
mainly indicated rutile crystal phase (2θ = 27.4, 36.1 and 54.3°) with a low content (4%) of anatase mixture (2θ = 25.4, 37.9 and 48.1°). Pure CeO2 sample calcined at 700 °C was composed of cubic CeO2
with fluorite structure with diffraction peaks at 2θ = 28.8, 47.7 and 56.5°. The addition of zirconia to ceria led to a shift of XRD peaks to higher values, and to the appearance characteristic peaks of monoclinic zirconia, at 2θ = 30.3, 50.5 and 44.8°. Consequently, the Ce-Zr (40-60) solid showed a broad band which was observed at 2θ=29.1° between pure c-CeO2 (28.4°, JCPDS 34-0394) and pure t-ZrO2
(30.2°, JCPDS 79-1766), which was attributed to Ce0.5Zr0.5O2 solid solution due to the replacement of
Ce4+ ions (0.97 Å) by the smaller Zr4+ ions (0.84 Å). After WO
6
of XRD patterns was observed, with no peaks associated to tungsten species, suggesting a good dispersion of tungsten trioxide phase as previously reported [xii].
3.2 Surface acidity characterisation
The surface acidity was determined by IR spectroscopy of adsorbed pyridine, which is one of the most largely used basic probe molecules for surface acidity characterization. Due to the nitrogen electron lone pair, pyridine interacts with acidic centers in a specific way to form (i) the pyridinium ion on protonic sites (PyH+) and (ii) coordinated species on Lewis acid sites (PyL), giving rise to
8a, 8b, 19a and
19b ring vibration modes. Pyridine (200 Pa at equilibrium) was adsorbed at room temperature, and then
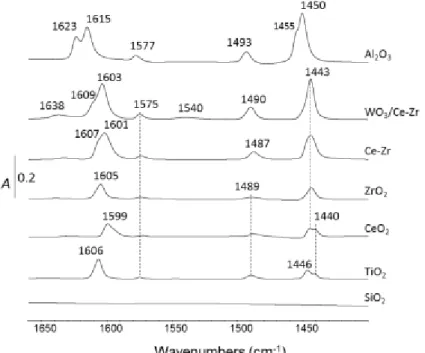
desorbed by temperature steps of 50°C up to 450°C, as previously mentioned in the experimental part. Fig. 2 presents the IR spectra of the samples after pyridine evacuation at 100°C.
Figure 2. IR spectra of pyridine evacuated at 100°C on SiO2, TiO2, CeO2, ZrO2, (WO3)Ce-Zr and Al2O3 samples. Spectra
are normalized to a disc of 10 mg cm-².
As expected, the spectrum of SiO2 displays no peak. In most samples, only pyridine coordinated on
Lewis acid sites (LAS) is observed. Only WO3/Ce-Zr catalyst exhibited characteristic frequencies of
pyridinium surface species by 8a-absorption at 1638 cm-1 in association to 19b-absorption mode at
1540 cm-1 from very weak intensities. These results are in accordance with the literature [xii,xiii] which
reported the IR spectra of pyridine adsorbed on tungstated zirconia and CexZr1-xO2 mixed-oxide
supported WO3 catalysts. In Fig. 2, bands assignable to 19b and 8a mode of coordinatively bound
pyridine are observed for Al2O3 (1450-1455 and 1615-1623 cm-1), WO3/Ce-Zr (1443 and 1603-1609 cm -1), Ce-Zr (1443 and 1601-1607 cm-1), ZrO
2 (1443 and 1605 cm-1), CeO2 (1440-1443 and 1599 cm-1) and
7 cm-1 and 1487-1493 cm-1 are assigned to
8b and 19a ring vibration (CCN stretch), respectively. The
higher 8a frequencies are attributed to strong LAS and correspond to 1623, 1609 and 1607 cm-1 for
Al2O3, WO3/Ce-Zr and Ce-Zr, respectively. Consequently, the lower 8a wavenumbers at 1615, 1606,
1605, 1603, 1601 and 1599 cm-1 are assigned to weak LAS and correspond to Al
2O3, TiO2, ZrO2, WO3
/Ce-Zr, Ce-Zr and CeO2, respectively. These attributions are used subsequently to highlight isocyanate
adsorption sites (section 3.6).
The 19b mode (1440-1455 cm-1) allows the quantification of the total amount of coordinated pyridine,
obtained from the surface area of the corresponding absorption band using its molar coefficient. Tamura et al. verified that the integrated molar extinction coefficients for Lewis acidic metal oxides do not markedly depend on the nature of oxides [xiv]. This indicates that the averaged extinction coefficient for pyridine adsorption on Lewis acid sites (1.73 cm µmol-1) can be used to quantify the LAS
concentrations of the whole materials. Consequently, LAS concentration (expressed in µmol g-1) is
reported in Table 3 for pyridine evacuated at RT and 100°C (supplementary material, Fig. S2). For pyridine evacuated at RT, alumina and ceria-zirconia oxides presented the higher LAS concentration, with around 115 and 71 µmol g-1. However, when pyridine was evacuated at higher temperature
(100°C), WO3/Ce-Zr sample exhibited higher acidic sites concentration than Ce-Zr host support. It
indicates that deposition of WO3 over ceria-zirconia increased the amount of stronger Lewis acid sites.
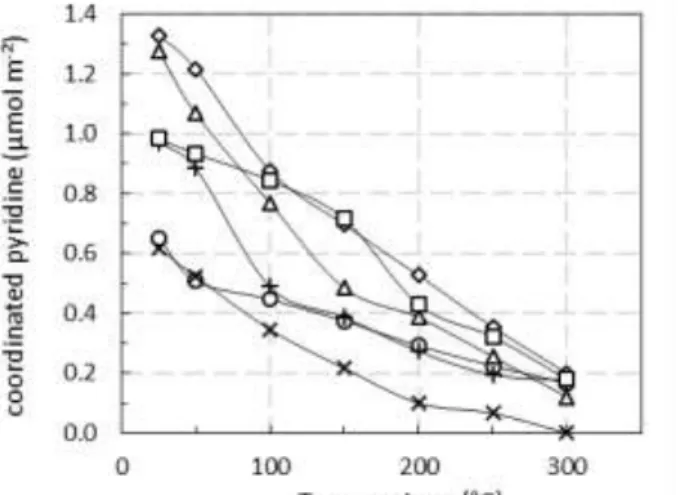
Due to the variation of specific surface area of various samples, the LAS density (expressed in µmol m-²)
is reported versus the pyridine temperature evacuation in Fig. 3. From this Figure, the amount and the strength of LAS can be discussed for the whole oxides. It appears that TiO2 and ZrO2 presented the
largest density of acid sites, but it rapidly dropped for higher pyridine temperature evacuation. These oxides also presented the lower specific surface area (Table 1). To the opposite, WO3/Ce-Zr and Al2O3
oxides presented LAS with higher strength, because the declines of adsorbed pyridine with temperature were less pronounced.
Figure 3. Lewis acid sites concentration (µmol m-2) of the metal oxides. (): Al
2O3; (): WO3/Ce-Zr; (): CeO2; ():
8
3.3 Gaseous isocyanic acid spectrum and calibration
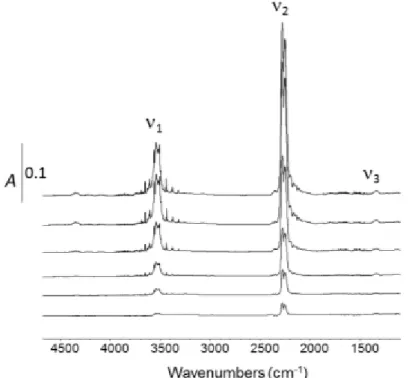
IR spectra of gaseous HNCO at various equilibrium pressures are presented in Fig. 4 in the 5000-800 cm-1 spectral range. No other compounds than HNCO was observed, illustrating the validity of the
(HNCO)3 decomposition (eq. 3) to yield pure gaseous isocyanic acid. The IR frequencies assignment are
reported in Table 2 and are consistent with the works of Lowenthal et al. [xviii] and Teles et al. [xix]. The six vibrational modes of the molecule correspond to three in plane stretches, two in plane bends and one out of plane bend. In the 4500-1000 cm-1 region, only the stretching mode was observable. The
three highest energy vibrations are assigned to 1 (N-H stretching), 2 (antisymmetric NCO stretching)
and 3 (symmetric NCO stretching) modes. The 3 mode being weakly intense, this band may be also
assigned to Fermi resonance split components involving 4 + 5 (1353 cm-1, Table2).
The integration of IR bands reported in Fig. 4 enables to calibrate the various vibrational modes of gaseous HNCO. Supplementary experiments using addition of accurately known increments were also performed. The intensity of 2 bands are plotted in Fig. 5 versus the amount of added isocyanic acid (:
µmol) and the equilibrium pressure of gaseous HNCO (: Pa). The straight line indicates a correlation which will be used subsequently to determine the maximum amount of HNCO adsorbed for all the studied oxides, based on the residual pressure of isocyanic acid after adsorption on such materials (section 3.6). An experimental error within 15 % is denoted.
9 Table 2. IR vibrational assignment of gaseous HNCO [18,19].
Mode Assignment Frequency (cm-1)
1 NH 3529
2 NCO asymmetric 2269
3 NCO symmetric 1338
4 HNC (776, not observed)
5 NCO (577, not observed)
6 NCO (656, not observed)
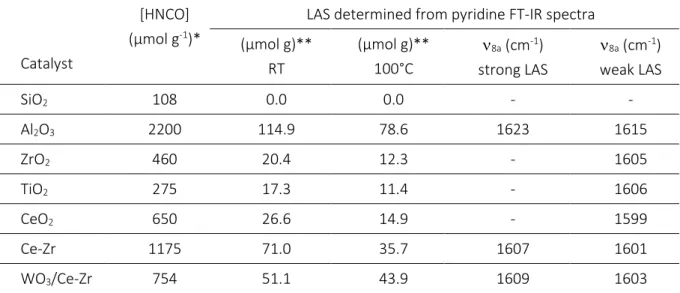
Table 3. HNCO storage capacity (µmol g-1) and
8a values of coordinated pyridine.
Catalyst
[HNCO] (µmol g-1)*
LAS determined from pyridine FT-IR spectra (µmol g)** RT (µmol g)** 100°C 8a (cm-1) strong LAS 8a (cm-1) weak LAS SiO2 108 0.0 0.0 - - Al2O3 2200 114.9 78.6 1623 1615 ZrO2 460 20.4 12.3 - 1605 TiO2 275 17.3 11.4 - 1606 CeO2 650 26.6 14.9 - 1599 Ce-Zr 1175 71.0 35.7 1607 1601 WO3/Ce-Zr 754 51.1 43.9 1609 1603
* Determined from residual HNCO pressure at equilibrium (RT). ** Determined from pyridine evacuated at RT or 100°C.
10
3.4 HNCO ad-species over oxides-based samples
Spectra of adsorbed species over the studied oxide-based samples are presented in Fig. 6 after successive HNCO additions (up to 15 µmol) at RT. Among the studied oxides, SiO2 was the only material
that revealed no band of adsorbed species. Only the gas phase was observed (supplementary material, Fig. S3), in accordance with the previously recorded spectra of gaseous HNCO (Fig. 4).
On the contrary, exposure of Al2O3, ZrO2, CeO2, Ce-Zr and WO3/Ce-Zr samples to controlled increments
of HNCO up to 15 µmol caused the appearance of bands situated in the 2260-2150 cm-1 spectral region,
assigned to isocyanate (–NCO) species adsorbed in various metal centres (M+–NCO) [xx-xxiii]. Then, HNCO adsorbs dissociatively on transition metal oxides, leading to isocyanate species bounded to Lewis acid sites (Eq. 4):
HNCO H(a) + NCO(a) (4)
Compared to 2 vibrational mode of gaseous HNCO (Fig. 3), the –NCO bands were redshifted, resulting
in a reduction of the NCO force constant [xxiv]. No other compound was detected in the gas phase, as for instance CO which could be produced from Eq. 5. We may assume that N atoms formed from isocyanate decomposition recombined to yield N2 (Eq. 6). However this process was not observed over
transition oxide studied in this work. The dissociative adsorption of HNCO toward oxide-based samples is discussed thereafter. The observed shifts of adsorbed isocyanates species are compared to metal oxide properties in section 3.6.
NCO(a) CO(g) + N(a) (5)
2 N(a) N2(g) (6)
Al2O3. The interaction of –NCO species with alumina is probably the most reported in the literature,
and bands at 2259 and 2233 cm-1 are attributed to Al
VINCO and to AlIVNCO species, respectively
[xxv,xxvi]. These species were recorded from the first dose of HNCO addition and correspond to the highest wavenumbers observed over all the studied solids.
ZrO2. In agreement with Knozinger et al. [xxvii], surface isocyanate species at 2231 cm-1 are observed
over ZrO2. With this solid, it seems that only one adsorption site was effective. The shift to the higher
wavenumbers from 2225 cm-1 to 2231 cm-1 is assigned to the consequence of the building up of
adsorbate-adsorbate interactions.
TiO2. Over this material, the band at 2223 cm-1 can be attributed to isocyanates groups bounded to
Ti4+ in accordance with previous works [xxviii,xxix]. As for ZrO
2, a shift was observed from 2195 to 2223
11
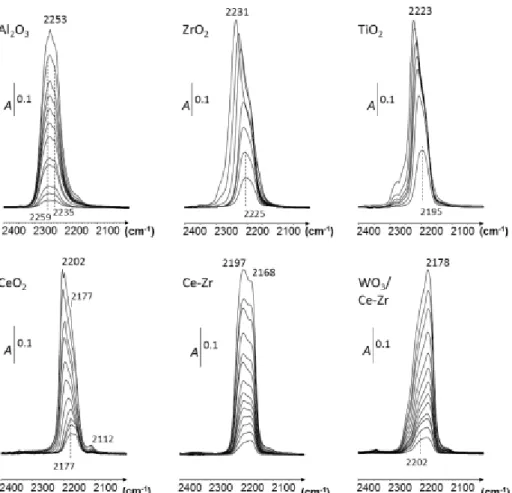
Figure 6. Addition of accurately known increments of HNCO up to 15 µmol (at RT) over oxide-based samples. Spectra
are normalized to a disc of 10 mg cm-².
CeO2. Exposure of CeO2 to a very low pressure of HNCO firstly produced a band centered at 2177 cm−1.
The intensities increased with the rise of HNCO pressure, associated with a shift to higher wavenumbers, at 2202 cm-1.Taking into account previous results obtained on ceria [xxx], both bands at 2202 and 2177
cm-1 are attributed to the asymmetric stretch of NCO species attached to CeO
2. The appearance of two
bands suggests the presence of two adsorption sites, perhaps Ce4+ and Ce3+. Additionally, the band at
2112 cm-1 is assigned to the 2F
5/2 2F7/2 electronic transition band of Ce3+ [xxxi] that confirms the
presence of both cationic sites (Ce4+/Ce3+).
CeO2-ZrO2. Exposure of CeO2-ZrO2 solid solution to HNCO led to the appearance of NCO bands close
to cerium oxide, with two adsorption sites. In fact, two bands were observed at 2197 cm-1 and 2168 cm -1 which grew simultaneously with the addition of HNCO. Based on these results and in accordance with
the previous attribution over ZrO2, we assigned these bands to the interaction of –NCO species with two
cerium cation, as for ceria.
WO3/CeO2-ZrO2. HNCO adsorption over WO3/Ce-Zr firstly revealed a band at 2202 cm-1 which was
12
band related to –NCO species at lower wavenumbers (2178 cm-1) presented higher intensity than the
high wavenumbers component (2202 cm-1). Additionally, the similar position of this band (2178 cm-1) to
that previously observed at the lowest wavenumbers for CeO2 (2177 cm-1) may indicate that WO3
interfered preferentially with one cationic site of ceria support (Ce4+ or Ce3+). However, this explanation
would require further study.
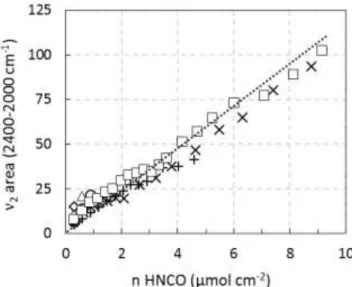
3.5 Determination of the molar extinction coefficients
NCOThe intensities of the absorbance bands of the infrared spectra in the transmission mode depend on the amount of vibrating species through the optical path of the infrared beam. On homogeneous sample, IR absorbance can be used for quantitative analyses. The equation used is similar to the Beer-Lambert law for a solution. The absorbance integrated intensity for a band is named I, as reported by Eq. 7: I = ∫ 𝐴(ν) dν = 𝜀 d(n/Sd) = 𝜀 ( n S ) 𝜈2 𝜈1 (7)
where A(),, n, S and d denote the absorbance, the wavenumber, the number of vibrators, the area of the oxide disc and the thickness of the wafer assumed to correspond to the optical pathway [xxxii], respectively. From the addition of accurately known increments of HNCO previously reported in Fig. 6, the corresponding integrated intensities of NCO band related to the isocyanate adsorbed species are
plotted in Fig. 7 versus the amount of added HNCO (µmol cm-²). The apparent molar extinction
coefficient of the 2 mode of HNCO (NCO) at RT is deduced from the obtained slopes as 𝜀 = S
𝑑(I) 𝑑n ( in µmol-1 cm). Fig. 7 reveals some variations in the observed slope depending on the considered sample.
However, the averaged extinction coefficient is 11.8 1.8 cm µmol-1.
Figure 7. Integrated intensity of the 2 mode of HNCO versus addition of increments of HNCO (µmol cm-2).
13
Morterra et al. [xxxiii] presented a critical use of molar absorption coefficients for adsorbed species. They checked the validity of equations of the Beer–Lambert law for heterogeneous systems like silica for methanol adsorption. For instance, they reported that molar absorption coefficient values greatly vary depending on the silica provider. The suggested reasons were the catalyst specific surface area, the sample thickness, the surface dehydration level and the diffusion properties of the adsorbent. Consequently, the use of absorption coefficients in the Beer–Lambert law is not rigorous in the case of powder samples, since the absorption coefficients for adsorbed species depend on the optical properties of the solid, on the experimental conditions, and on the interaction between the solid and the adsorbed molecule. For instance, in our case, the studied samples presented very different specific surface area from 13 to 176 m² g-1 for TiO
2 and Al2O3, respectively. This important variation can explain
the measured deviations from the calculation of the molar absorption coefficients.
In addition, it is well known that the molar extinction coefficients also depends on the adsorbing sites. The use of a global HNCO molar extinction coefficient regardless of multiple HNCO adsorption sites can lead to incorrect site quantification. As a consequence, the advanced values should be interpreted cautiously and the reported data have to be completed by coupling infrared spectroscopy and in situ thermogravimetry experiments for instance. Nevertheless, obtained extinction coefficients from HNCO adsorption appeared rather close together and the decomposition of cyanuric acid to yield pure gaseous isocyanic acid is a first step of deeper analytical works for in situ infrared studies of isocyanate species reactivity.
3.6 HNCO adsorption capacity, dissociative adsorption
In this section the maximum HNCO adsorption capacity of the various studied oxides was measured. The quantification of adsorbed species cannot be performed using the apparent molar coefficient due to the saturation of the detector for samples that displayed important HNCO adsorption abilities such as Al2O3, CeO2, Ce-Zr and WO3/Ce-Zr. Consequently, a more accurate estimation of the HNCO adsorption
capacities resulted in the equilibrium pressure measurement between the relaxed amount in the cell and that obtained in the presence of the sample. From the previously calculated gas phase calibration (section 3.3, Fig. 5), the adsorbed amount can be determined.
Results reported in Table 3 illustrate the remarkable HNCO adsorption capacity of Al2O3 with around
2200 µmol g-1. However, this oxide also exhibited higher specific surface area, with 176 m² g-1. Due to
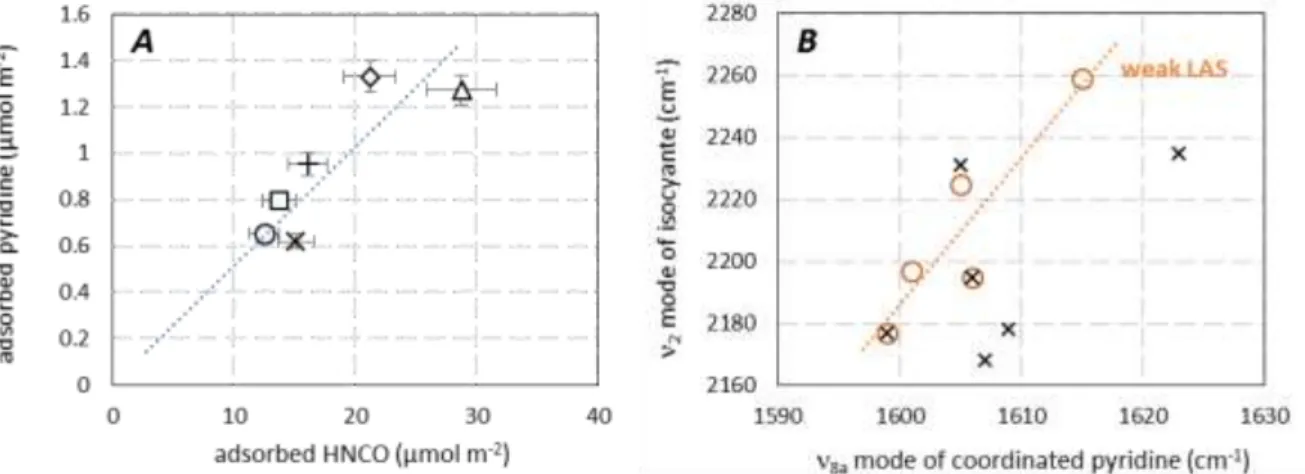
the important variation of the B.E.T values of the whole studied samples, the HNCO adsorption amount was correlated to the acid sites density (µmol m-²), determined from pyridine adsorption (Fig. 3). It
appears in Fig. 8A that the higher the LAS density, the higher the HNCO adsorption capacity. This result confirms that HNCO adsorption abilities was directly correlated to LAS, as previously proposed by
14
Solymosi et al. [xxi,xxii] (supplementary material, Fig. S4). Additionally, it is worth noting that acidic properties were determined from pyridine adsorbed under dynamic vacuum, whereas HNCO adsorption abilities were provided at equilibrium pressure. This explains the quantitative divergence of Fig. 8A. Nevertheless, catalysts behaviours are clearly distinguishable despite the experimental error, demonstrating the higher HNCO adsorption density for TiO2 and ZrO2 materials.
Finally, the higher wavenumbers of the 2 mode of adsorbed isocyanates (Fig. 6) is reported versus
the 8a ring vibration of coordinated pyridine in Fig 8B. Both weak and strong LAS (Table 3) previously
discussed in Fig. 2 are considered. It appears that HNCO dissociative adsorption mainly involves weak LAS location. Besides, due to the important wavenumbers variation of the as(NCO) band depending on
the studied material (2289-2177 cm-1) together with the dissociative adsorption of HNCO, it appears
that isocyanic acid could be an appropriate probe molecule for weak Lewis acid-base pairs.
Figure 8. A: Relationship between LAS density determined from pyridine evacuated at RT and HNCO adsorption
capacity. B: Relationship between the 2 mode of isocyanate and the 8a mode of coordinated pyridine (: weak
LAS; : strong LAS).
(): Al2O3; (): WO3/Ce-Zr; (): CeO2; (): Ce-Zr; (): TiO2; (): ZrO2.
3.7 HNCO hydrolysis rate
HNCO hydrolysis is expected to produce ammonia in the NOX SCR by urea process. To study the HNCO
hydrolysis rate over the oxide-based samples, H2O was added on the IR cell together with HNCO, as
described in the experimental part. Both surface and gaseous IR spectra were recorded every 25°C from 25°C up to 400°C.
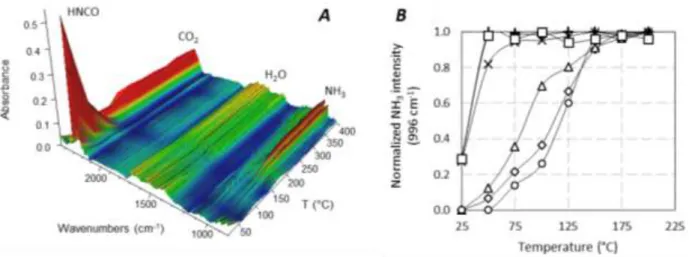
Examples of gaseous spectra are reported in Fig. 9A for alumina sample. Spectra are characterized by IR bands characteristic of HNCO (as(NCO)), CO2 (as(OCO)), H2O ((OH)) and NH3 ((NH)) species. In this sample,
HNCO seemed fully consumed at around 150 °C, concomitantly with NH3 and CO2 formation, whose
15
reaction (Eq. 2). Besides, IR spectra of adsorbed species (supplementary material, Fig. S5) revealed that –NCO adsorbates were concomitantly consumed. This result suggests that hydrolysis of HNCO involves isocyanate species as intermediate. In fact, two mechanisms can be differentiated to highlight ammonia production, with the involvement or not of adsorbed intermediates. Unland [xxxiv] suggested that NH3
is produced by HNCO hydrolysis, possibly via carbamic acid formation (Eq. 8). In this case, –NCO species are not suspected to be involved in the mechanism of NH3 formation.
HNCO + H2O (H2NCOOH) NH3 + CO2 (8)
NCO(a) + H2O NH2(a) + CO2 (9)
NH2(a) + H2O OH(a) + NH3 (10)
In this work, it is proposed that HNCO hydrolysis rather proceeds via a surface reaction of adsorbed isocyanate species, as illustrated by Eq. 9 and Eq. 10 resulting in the global following reaction (Eq. 11):
NCO(a) + 2 H2O NH3 + CO2 + OH(a) (11)
The intensity of the NH3 band can be monitored versus the temperature. Fig 9B shows that HNCO
hydrolysis rate depended on the involved solid. All catalysts were fully selective in ammonia production. No other compounds than NH3 and CO2 were observed. HNCO was fully hydrolysed at 175-200 °C for all
catalysts studied, but some oxides hydrolysed isocyanic acid already at 25 °C, such as CeO2, WO3/Ce-Zr
and Ce-Zr which presented remarkable activities for HNCO hydrolysis. The following activity order was then obtained: WO3/Ce-Zr = Ce-Zr > CeO2 >> ZrO2 > TiO2 > Al2O3 >> SiO2. Note that Kröcher et al. [xxxv]
proposed the following ranking: ZrO2 > TiO2 > Al2O3 > H-ZSM-5 >> SiO2, which is consistent with our
results.
Figure 9. Gaseous IR spectra of HNCO hydrolysis reaction over Al2O3 from 25°C to 400°C (A); normalized evolution
of the intensity of the NH3 band at 966 cm-1 versus temperature for: (): Al2O3; (): WO3/Ce-Zr; (): CeO2; ():
16 4. Conclusion
Isocyanate species (–NCO) are well recognized as major intermediate in numerous deNOx reactions,
although few studies are openly devoted to their direct characterization. This work is a first step to a deeper knowledge of HNCO and adsorbed –NCO species reactivity by means of in situ FTIR spectroscopy. Pure gaseous isocyanic acid was obtained by depolymerising the cyclic trimer of cyanuric acid that allows HNCO adsorption monitored by FT-IR spectroscopy over a wide range of common oxides with various acid-base and redox properties: SiO2, Al2O3, TiO2, ZrO2, CeO2, CeO2-ZrO2, WO3/CeO2-ZrO2. This study
pointed out that HNCO adsorption is strongly dependent on transition metal adsorption sites, but also on the oxidation state of this latter. Molar extinction coefficients of adsorbed isocyanates species are proposed. They have to be used carefully, especially due to different specific surface area and multiple HNCO adsorption sites of the whole samples. Additionally, this work reveals the remarkable ability of TiO2 and ZrO2 solids to adsorb –NCO species. Co-adsorption of water illustrates the HNCO hydrolysis
reaction rate, with an impressive reactivity of WO3/Ce-Zr, Ce-Zr and CeO2 materials to yield NH3 and CO2
at 25°C. For all oxide catalysts, -NCO species are reported as intermediate compounds of HNCO hydrolysis.
Acknowledgement
The authors thank the European communities (FEDER) and the “Région Nouvelle Aquitaine” for the financial support. Authors thank the “Engineering, development and technical support” division of the IC2MP laboratory for the implementation of the experimental analysis device: Michel Chauveau, Jean-Jacques Colin, Claude Veit, Claude Rouvier and Bertrand Leroux.
17
Supplementary Material
1. XRD characterisationXRD patterns of the whole studied samples are presented in Fig. S1. Accordingly to the literature, alumina displays the classical γ-Al2O3 structure. TiO2 mainly indicates rutile crystal phase (2θ = 27.4, 36.1
and 54.3°) with a low content (4%) of anatase mixture (2θ = 25.4, 37.9 and 48.1°). Pure CeO2 sample is
composed of cubic CeO2 with fluorite structure at 2θ = 28.8, 47.7 and 56.5°. The addition of zirconia to
ceria led to a shift of XRD peaks to higher values, and to the appearance characteristic peaks of monoclinic zirconia, at 2θ = 30.3, 50.5 and 44.8°. Consequently, the Ce-Zr (40-60) solid showed a broad band, observed at 2θ=29.1°, between pure c-CeO2 (28.4°, JCPDS 34-0394) and pure t-ZrO2 (30.2°, JCPDS
79-1766), which was attributed to Ce0.5Zr0.5O2 solid solution due to the replacement of Ce4+ ions (0.97
Å) by the smaller Zr4+ ions (0.84 Å). After WO
3 impregnation over Ce-Zr, no modification of XRD patterns
is observed, with no WO3 XRD peaks detected, suggesting a good dispersion of tungsten trioxide phase.
Figure S1. XRD patterns of oxides samples.
2. Surface acidity characterisation
Based on pyridine adsorption monitored by IR spectroscopy, the Lewis acid sites (LAS) concentration is calculated using the 19b mode of the ring vibration (CCN stretch) of coordinated pyridine (1440-1455
cm-1). The LAS concentration (expressed in µmol g-1) of Al
2O3, TiO2, ZrO2, CeO2, Ce-Zr and WO3/Ce-Zr
samples is reported versus the pyridine temperature evacuation in Fig. S2.
It clearly appears that alumina present the higher LAS concentration of the whole studied catalysts. To the opposite, TiO2, ZrO2 and CeO2 oxides are characterised by low Lewis acid sites concentration. The
addition of ceria to zirconia enhance the acidic properties of the Ce-Zr sample compared to pure CeO2
or ZrO2 oxides. Additionally, the impregnation of WO3 to Ce-Zr increases the strength of LAS with an
improvement of coordinated pyridine concentration for high temperature evacuation compared to Ce-Zr host support.
18
Figure S2. Lewis acid sites concentration (µmol g-1) of the metal oxides. (): Al
2O3; (): WO3/Ce-Zr;
(): CeO2; (): Ce-Zr; (): TiO2; (): ZrO2.
3. HNCO ad-species over SiO2
Spectrum of adsorbed species after HNCO additions (10 µmol) at RT (spectra are normalised to a disc of 10 mg cm-²) reveal that SiO
2 present no band of adsorbed species. Only the gas phase was observed
as reported in Fig. S3. The band at 2269 cm-1 is assigned to the
2 mode of the asymmetric NCO vibration
of gaseous HNCO.
Figure S3. IR spectrum of HNCO adsorption (10 µmol) over SiO2.
4. HNCO adsorption capacity
The HNCO adsorption capacity of the whole studied sample (Al2O3, TiO2, ZrO2, CeO2, Ce-Zr and
WO3/Ce-Zr) was evaluated and compared to acidic sites concentration (µmol g-1), determined from
pyridine evacuation (Fig. S2). Results reported in Fig S4 indicate that higher the Lewis acid sites concentration, higher the HNCO adsorption capacity.
19
Figure S4. Relationship between LAS concentration determined from pyridine evacuated at RT and HNCO adsorption capacity (µmol g-1). (): Al
2O3; (): WO3/Ce-Zr; (): CeO2; (): Ce-Zr; (): TiO2; ():
ZrO2.
5. HNCO hydrolysis
The HNCO hydrolysis reaction is studied by expanding H2O on the IR cell together with HNCO. Surface
and gaseous IR spectra were successively recorded from 25 up to 400 °C by 25 °C step.
Figure S5. IR spectra of adsorbed species of HNCO hydrolysis over Al2O3 (A); normalized evolution of
the intensity of the NH3 band at 966 cm-1 versus temperature for: (): Al2O3; (): WO3/Ce-Zr; (): CeO2;
(): Ce-Zr; (): TiO2; (): ZrO2 (B).
IR surface spectra recorded over alumina sample are presented as example in Fig. S5A from 100°C to 175°C. The band at 2253 cm-1 is assigned to isocyanate (–NCO) species adsorbed on Al3+ metal centre.
The intensity of –NCO band decrease with the increase in temperature to be fully consumed at temperature higher than 150°C. Concomitantly, gaseous NH3 and CO2 are observed in the gas phase, as
the only reaction products. The intensity of the NH3 band is reported Fig. S5B versus the temperature.
It appears that –NCO compounds disappears together with gaseous ammonia production. This result suggests that hydrolysis of HNCO involves adsorbed isocyanate species as intermediate.
0 20 40 60 80 100 120 140 0 500 1000 1500 2000 2500 ad so rb ed p yrid in e (µ mo l g -1)
20 References
i W. Yang, R. Zhang, B. Chen, D. Duprez, S. Royer, Environ. Sci. Technol. 46 (2012) 11280−11288. ii J. Liu, X. Li, Q. Zhao,C. Hao, D. Zhang, Environ. Sci. Technol. 47 (2013) 4528−4535.
iii F. Figueras, J.L. Flores, G. Delahay, A. Bourane, J.-M. Clacens, A. Desmartin-Chomel, B. Coq, A.
Giroir-Fendler, Top. Catal. 39 (2006) 59-64.
iv F. Poignant, J. Saussey, J.C. Lavalley, G. Mabilon, J. Chem. Soc., Chem. Commun. (1995) 89-90. v L. Capek, K. Novoveska, Z. Sobalık, B. Wichterlova, L. Cider, E. Jobson, Appl. Catal. B 60 (2005) 201–
210.
vi A. Flura, X. Courtois, F. Can, S. Royer, D. Duprez, Top. Catal. 56 (2013) 94-103.
vii A.M. Bernhard, D. Peitz, M. Elsener, A. Wokaun, O. Kröcher, Appl. Catal. B., 115-116 (2012) 129-137. viii M. Seneque, F. Can, D. Duprez, X. Courtois, ACS Catal., 6(7) (2016) 4064-4067.
ix R.A. Perry, D.L. Siebers, Nature, 1986, 324, 657-658.
x N. Apostolescu, B. Geiger, K. Hizbullah, M.T. Jan, S. Kureti, D. Reichert, F. Schott, W. Weisweiler, Appl.
Catal., B., 62 (2006) 104-114.
xi G. Qi, R.T. Yang, R. Chang, Appl. Catal. B., 51 (2004) 93-106.
xii F. Can, S. Berland, S. Royer, X. Courtois, D. Duprez, ACS Catal., 3 (2013) 1120-1132.
xiii G. Larsen, E. Lotero, S. Raghavan, R.D. Parra, C.A. Querini, Appl. Catal. A., 139, 1996, 201-211. xiv M. Tamura, K. Shimizu, A. Satsuma, Appl. Catal., 433 (2012) 135-145.
xv M.I. Zaki, M.A. Hasan, F.A. Al-Sagheer, L. Pasupulety, Colloids Surf A Physicochem Eng Asp., 190
(2001) 261-274.
xvi S. Triwahyono, T. Yamada, H. Hattori, H. Appl. Catal. A. 242 (2003) 101-109.
xvii A. Flura, F. Can, X. Courtois, S. Royer, D. Duprez, Appl. Catal. B., 126 (2012) 275-289. xviii M.S. Lowenthal, R.K. Khanna, M.H. Moore, Spectrochim. Acta A., 58 (2002) 73-78.
xix J.H. Teles, G. Maier, B.A. Hess Jr, L.J. Schaad, M. Winnewisser, B.P. Winnewisser, Chem. Ber., 122
(1989) 753-766.
xx V.A. Matyshak and O.V. Krylov, Catal. Today, 25 (1995) 1-88. xxi F. Solymosi and J. Raskó, J. Catal., 65 (1980) 235-237. xxii F. Solymosi and T. Bánsági, J. Catal., 202 (2001) 205-206.
xxiii Y.H. Yeom, B. Wen, W.M.H. Sachtler, E. Weitz, J. Phys. Chem. B. 108 (2004) 5386-5404. xxiv J. Ryczkowski, Catal Today, 68 (2001) 263-381.
xxv N. Bion, J. Saussey, M. Haneda, M. Daturi, J. Catal., 217 (2003) 47-58.
xxvi N. Bion, J. Saussey, C. Hedouin, T. Seguelong, M. Daturi, Phys. Chem. Chem. Phys., 3 (2001)
4811-4816.
xxvii T. Weingand, S. Kuba, K. Hadjiivanov, H. Knözinger, J. Catal., 209 (2002) 539-546. xxviii F. Solymosi, T. Bansagi, J. Phys. Chem., 83(4) (1979) 552–553
xxix G. Halasi, T. Bánsági, F. Solymosi, J. Catal., 325 (2015) 60-67
xxx T. Bánsági, T.S Zakar, F. Solymosi, Appl. Catal. B., 66 (2006) 147-150. xxxi C. Binet, A. Badri and J.C. Lavalley, J. Phys. Chem., 98 (1994) 6392-6398. xxxii S. Khabtou, T. Chevreau, J.C. Lavalley, Microporous Mater., 3 (1994) 133-148. xxxiii C. Morterra, G. Magnacca, V. Bolis, Catal Today, 70 (2001) 43-58.
xxxiv M.L. Unland, J. Phys. Chem., 77 (1973) 1952-1956.
xxxv A.M. Berhard, D. Peitz, M. Elsener, T. Schildhauer, O. Kröcher, Catal. Sc. Technol., 3 (2013)
942-951.