HAL Id: tel-01127596
https://tel.archives-ouvertes.fr/tel-01127596
Submitted on 7 Mar 2015
HAL is a multi-disciplinary open access archive for the deposit and dissemination of sci-entific research documents, whether they are pub-lished or not. The documents may come from teaching and research institutions in France or abroad, or from public or private research centers.
L’archive ouverte pluridisciplinaire HAL, est destinée au dépôt et à la diffusion de documents scientifiques de niveau recherche, publiés ou non, émanant des établissements d’enseignement et de recherche français ou étrangers, des laboratoires publics ou privés.
Adaptation strategies of soil biodiversity (earthworms)
to pesticides : mechanisms in play and ecosystemic cost
assessment
Nicolas Givaudan
To cite this version:
Nicolas Givaudan. Adaptation strategies of soil biodiversity (earthworms) to pesticides : mechanisms in play and ecosystemic cost assessment. Ecotoxicology. Université Rennes 1, 2014. English. �NNT : 2014REN1S083�. �tel-01127596�
N° d’ordre : ANNÉE 2014
THÈSE EN COTUTELLE
UNIVERSITÉ DE RENNES 1
sous le sceau de l’Université Européenne de Bretagne
ET
UNIVERSITY OF SOUTHERN DENMARK pour le grade de
DOCTEUR DE L’UNIVERSITÉ DE RENNES 1
Mention : BIOLOGIE
Ecole doctorale Vie, Agro, Santé
présentée par
Nicolas Givaudan
Equipe Rôle de la Biodiversité dans les Processus Ecologiques
CNRS UMR 6553 Ecobio,
Université de Rennes 1
UFR Sciences de la Vie et de l’Environnement
Stratégies
d’adaptations de la
biodiversité du sol à la
pollution
environnementale
résiduelle établie en
paysage agricole
Thèse soutenue à Odense (Danemark) le 19/03/2014
devant le jury composé de :
Knud LADEGAARD PEDERSEN
Associate Professor, University of Southern Denmark, Institute of Biology / Président du Jury
Yvan CAPOWIEZ
Chargé de Recherches, INRA Centre PACA, Unité Plantes et Systèmes Horticoles / examinateur
Martin HOLMSTRUP
Professor, Department of Bioscience, Aarhus University, Denmark / examinateur
Françoise BINET
Directrice de Recherches, CNRS UMR 6553 ECOBIO, Université de Rennes 1 / Directrice de thèse
Claudia WIEGAND
Associate Professor, University of Southern Denmark, Institute of Biology / co-directrice de thèse
Potentiel d’adaptation des lombricidés aux pollutions environnementales
résiduelles établies en paysage agricole: mécanismes en jeu et coûts à
l’écosystème
Résumé de thèse de doctorat en Français Nicolas Givaudan
Ce mémoire de thèse est écrit en anglais et comporte, outre une introduction de 80 pages, trois articles scientifiques formant le corps du manuscrit. Ce résumé reprend et résume en français les principales questions et résultats de ces trois chapitres.
Introduction
Dans l’agriculture moderne, les champs cultivés sont des écosystèmes profondément modifiés par l’homme dans lesquels de hauts rendements sont obtenus grâce à des modes de gestion conventionnels à travers l’utilisation importante de pesticides, fertilisants et travail mécanique du sol. L’application de multiples pesticides a induit une contamination chronique des sols et de leur biota, en particulier les vers de terre (Lee 1985; Redondo et al. 1994; Luchini et al. 2000; Gevao et al. 2001). La rémanence de nombreux pesticides, tels que l’herbicide atrazine (Solomon et al. 1996; Giddings et al. 2005), pose des problèmes environnementaux majeurs en ce qui concerne la contamination résiduelle des sols agricoles, mais aussi leur potentiel de transfert vers les eaux superficielles et souterraines, et enfin leur effets nocifs sur la faune du sol.
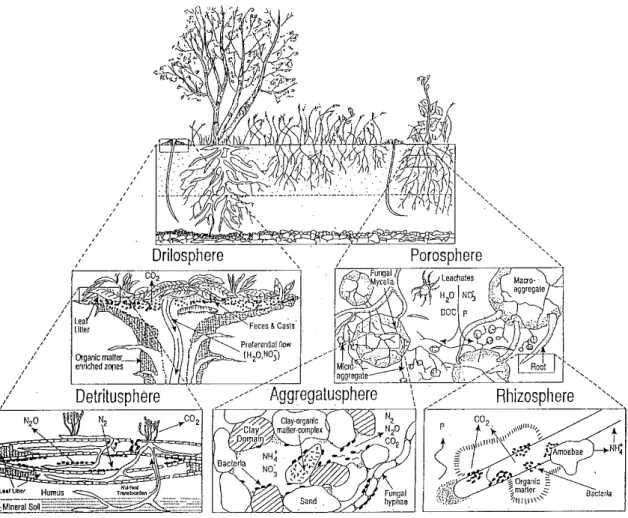
Les vers de terre représentent la plus grande biomasse animale terrestre et sont souvent nommés « ingénieurs de l’écosystème », de part leur contribution majeure à la pédogenèse et leur influence sur des paramètres clés du sol, comme le cycle des nutriments, la porosité du sol, et l’activité microbienne (Jones et al. 1997; Binet et al. 1998; Monard et al. 2008; Bottinelli et al. 2010). La biodiversité des vers de terre est toutefois réduite dans les champs en agriculture intensive (Smith et al. 2008), l’utilisation de pesticides étant identifiée comme un des facteurs responsables de ce déclin, d’après des études en laboratoire (Springett & Gray 1992; Yasmin & D’Souza 2010). Malgré les effets toxiques de certains pesticides, certaines
espèces persistent en agriculture intensive, en particulier les espèces endogées comme
Aporrectodea et Allolobophora sp (Jordan et al. 2004; Smith et al. 2008; Pelosi et al. 2013).
Ceci suggère, et c’est l’hypothèse forte de ce travail de thèse, que les impacts à long terme des pesticides sur des populations naturelles comme les vers de terre peuvent induire des
phénomènes d’adaptation ou d’acclimatation chez ceux-ci. Des processus d’adaptation ont pu être mis en évidence chez des vers de terre Dendrobaena octaedra exposés aux métaux, facilités par une surexpression de métallothionéines (Fisker et al. 2013). Ces processus d’adaptation peuvent comporter des changements physiologiques dont une augmentation de l’activité de détoxification, des modifications d’allocation des ressources énergétiques, et des changements de comportement (réactions d’évitement), mais ils sont encore mal compris.
Objectifs de la thèse et du travail de recherche
Au cours du processus d’homologation de nouveaux pesticides, en théorie les composés les plus toxiques pour les vers de terre sont éliminés d’après les tests standardisés disponibles avec les vers de terre Eisenia fetida basés sur la mortalité et la reproduction. Cependant il est probable que ces tests ne prennent pas en compte des effets plus subtils des molécules appliquées :
i.) Sur les populations d’espèces plus sensibles que E. fetida
ii.) A long terme (plusieurs décennies)
Malgré cette contamination, dans les sols à forte activité agricole et à apports réguliers de pesticides, des populations de vers de terre de quelques espèces (3-4) persistent. Ces faits invitent à s’interroger sur les stratégies qu’ont développées ces populations pour se maintenir dans les sols contaminés par les pesticides et leurs résidus, et dans quelle mesure des
processus d’acclimatation et d’adaptation sont impliqués. De plus, on peut se demander quels coûts (compromis énergétiques et reproductifs) ces stratégies peuvent avoir pour les
populations (allocation d’energie et traits d’histoire de vie) mais aussi pour l’écosystème sol (efficacité de bioturbation, dynamique des cycles de carbone et d’azote, et dégradation des pesticides).
L’objectif de la thèse est donc d’évaluer ce potentiel d’adaptation chez des populations de vers de terre en comparant des populations provenant d’historiques agricoles contrastés en
terme d’applications de pesticides. En particulier, la comparaison de populations « références » (issues de zones non-contaminées, i.e. populations « naîves ») versus des populations pré-exposées (issues de champs en agriculture conventionnellle). Ce travail étudie les stratégies d'adaptation à plusieurs niveaux biologiques, du niveau cellulaire et
physiologique fin (biochimique, enzymatique, métabolique) à l'individu (changements de poids) et de la population (paramètres de la reproduction), ainsi que les conséquences
possibles pour l'écosystème (activité de creusement des vers de terre et conséquences pour le devenir des pesticides).
La première étape est d'évaluer dans quelle mesure l’historique agricole peut être relié à la contamination par les pesticides et les résidus de molécules dans le sol. Une analyse des résidus de pesticides est réalisée et les profils de contamination comparés entre champs afin de sélectionner les domaines les plus appropriées pour l'étude.
Une enzyme de détoxification avec une large spécificité de substrat (GST, à la fois sous forme cytosolique et microsomal) et une enzyme anti-oxydante majeure (CAT) sont utilisées et comparées au sein des populations pour évaluer si ces mécanismes de «protection» se sont amélioré dans les populations pré-exposés à pesticides par rapport à la population de référence. L’activité « basale » (c’est à dire expression constitutive des enzymes sans exposition récente aux pesticides) de ces deux paramètres est mesurée dans les vers de terre sur le terrain ainsi qu’après exposition à des concentrations susceptibles d’être rencontrées dans l'environnement (selon les taux d'application sur le terrain) en laboratoire
Les compromis énergétiques de ces mécanismes de protection seront évaluées par le statut des principaux réservoirs énergétiques, qui sont le glycogène (principal composé de stockage glucidique chez les animaux), les lipides et les protéines. Les réponses métaboliques globales des organismes seront évaluées par la mesure de la respiration, et par l'utilisation de la
métabolomique. La méthodologie appliquée permet aux différentes mesures (respiration, ressources énergétiques, métabolomique) d’être réalisées sur le même animal avec plusieurs aliquots de tissu lyophilisé et broyé.
Les conséquences possibles aux niveaux supérieurs d'organisation biologique (population) sont étudiées à travers les traits d'histoire de vie. Plusieurs traits morphologiques et
biométriques sont comparés chez les adultes des différents historiques agricoles ainsi que dans leur progéniture (cocons et juvéniles).
Les conséquences de l'adaptation des vers de terre pour l'écosystème du sol sont abordées en termes de bioturbation (activité de creusement) et de dégradation des pesticides. L’activité de creusement d’une population de vers de terre pré-exposée par rapport à une population naïve est quantifiée par des expériences en laboratoire afin de déterminer le lien entre réponses adaptatives (métabolome, ressources énergétiques, respiration) et bioturbation. La dégradation des pesticides est aussi comparée entre les deux populations et dans le sol sans ver de terre (dissipation naturelle) afin de déterminer si la population pré-exposée (possiblement adaptée) peut influencer davantage la dégradation du pesticide en tant que service écosystémique.
Article 1. Tolérance des vers de terre à la contamination résiduelle par les pesticides dans les paysages agricoles : évaluation expérimentale et in situ des capacités de détoxification
L’objectif du premier chapitre est d’évaluer la capacité des vers de terre à faire face et s’adapter à une multi-contamination chronique (> 10 ans) des sols, enjeu majeur dans la prédiction de la résilience et de la durabilité de l’écosystème sol.
Les réponses de vers de terre exposés de manière chronique à la contamination par les pesticides (issus de champs en agriculture conventionnelle depuis 20 ans) sont comparées à celles de vers de terre jamais exposés (issus de champs en agriculture biologique). Dans une étude in situ l’hypothèse suivante est testée : la contamination résiduelle à long terme (20 ans) des sols cultivés se manifeste par des différences physiologiques chez les vers de terre. Dans la seconde partie, une exposition en laboratoire de populations pré-exposées (champ
conventionnel) et naïves (champ biologique) à des concentrations en pesticides
écologiquement réalistes est réalisée. Cette seconde expérience teste l’hypothèse que la pré-exposition des vers de terre à long-terme dans un champ cultivé modifie leur réponse physiologique lors d’une exposition aigüe. Les réponses physiologiques suivantes sont
évaluées : capacité antioxidante (catalase), detoxification (Glutathione S Transferase), et coûts énergétiques associés (lipides, glucides, protéines).
Résultats principaux :
1. Résidus de pesticides dans les sols
9 pesticides sont détectés dans les sols des trois champs, dont 5 herbicides, 3 fongicides et un métabolite du glyphosate, l’AMPA. L’herbicide atrazine est présent dans les trois champs conventionnels plus le champ biologique, mais pas dans la prairie. C’est donc la molécule la plus fréquemment détectée, bien qu’elle n’ait pas été appliquée sur aucun des champs au cours de l’historique disponible (2000-2010). Les deux molécules utilisées actuellement et les plus fréquemment détectées sont l’alachlore et l’époxiconazole, et elles réprésentent en
moyenne entre 3 et 7% de leur concentration « prédite » après une application en se basant sur la dose recommandée (Dittbrenner et al. 2010). A noter que la quantité résiduelle totale
mesurée dans le sol des champs conventionnels suit le gradient pré-établi grâce à l’historique d’applications (« Forts » > « Moyens » > « Faibles »).
acclimatized for 14 days to the exposure soil in the climatic room (Conviron GR96; temperature: 15!C; day/ night cycle: 16/ 8 h; humidity: 80 " 5% ).
The two most frequent pesticides were applied (alone or in combination) as commercial formulations OPU S!(125 g active ingredient epoxiconazole l#1, BASF
AGRO SAS) and RoundU p F lash!(450 g active ingredient glyphosate l#1, Monsanto).
Opus!and RoundU p F lash!were applied at predicted soil concentrations of the
active ingredient of 0.1mg g#1dry soil and 2.5mg g#1dry soil, calculated for field
application rates of 1 l ha#1and 4 l ha#1, respectively. Concentrations were
calcu-lated assuming a single application with an homogenous distribution, a soil density of 1.5 kg l#1, and no crop interception in the top 5 cm of the soil (Dittbrenner et al.,
2010). Soil spiking was conducted by manually adding diluted pesticide solution or distilled water (for the controls) on soil at 14% water content of soil mass reaching a final soil water content of 24% , in two steps with the soil being thoroughly mixed, redisposed as a fine layer and resieved at 2 mm. Soil microcosms (polycarbonate boxes, 80 mm diameter $ 50 mm height, Caubè re, Y ebles, F rance), were filled with 100 g of contaminated or control soil and left two days in a cool dark room to ensure aeration of the soil after re-humidification. W ater content was adjusted to 25% prior to introduction of animals, then checked again each week.
Experimental design: Prior exposure, each earthworm was rinsed in tap water, gently dried on filter paper, weighed and put in individual Petri dishes for 48 h for gut voiding (Table S4). Then animals were individually placed in the exposure microcosm (day 0) according to a size-class procedure, insuring a similar mean earthworm weight in each treatment. Six earthworms were exposed to either soil with pesticide (herbicide, fungicide or the mixture) or control soil for 3, 7, and 28 days, with an initial control group for both populations (unexposed worms) at day 0. At end of each exposure time, earthworms were rinsed thoroughly, weighed again (Table S4), but not gut voided in order to avoid additional stress that would impact enzyme activity, frozen in liquid nitrogen and stored at #80!C.
2.4. E nz yme activities
Enzymes from earthworms sampled in the fields (2.1) and those from the acute exposure conducted in the laboratory (2.3) were extracted according toW iegand et al. (2007). Glutathione S-transferase activity in soluble and microsomal frac-tions (m- and sGST) was determined according toHabig et al. (1974), using 1-chloro-2,4-dinitro-benzene as substrate. Catalase (CAT) activity was measured according to Chang and Kao (1998), using H2O2as substrate. Protein content of the enzyme
ex-tracts was quantified according toBradford (1976)using a calibration curve of bovine serum albumin.
2.5. E nergy resources measurement
The freeze-dried earthworms were ground to a fine powder in a bead-beater (Retsch MM400, Retsch GbmH, Haan, Germany) and separated in aliquots: 2 mg for total lipids, 5 mg for soluble proteins, and 20 mg for glycogen measurements.
Methods for lipids (F olch et al., 1957), proteins (Bradford, 1976) and glycogen (N icolai et al., 2012) measurements are described in detail in theSupplementary materials. W hole-body-energy-budget (W BEB) was calculated as sum of combustion of (17 kJ g#1glycogen þ 39.5 kJ g#1lipids þ 24 kJ g#1proteins) expressed per g dw of
earthworm (Smolders et al., 2003). 2.6 . Statistical analyses
Box-and-whiskers plots represent the data quartiles and the median (black bar). The length of the box represents the Inter-Q uartile Range (IQ R), and whiskers ex-tends to the data points that are no more than 1.5 times the IQ R from either end of the box. Mean differences in enzymatic (sGST, mGST, and Catalase), energetic (Glycogen, lipids, proteins, and W BEB), and biometric parameters (length, weight, and condition index) between the fields were tested by one-way AN OV A with field residual contamination as factor, followed by Tukey’s post-hoc test. W eight changes of earthworms in the laboratory exposure were tested by one-way AN OV A with time as factor, followed by Tukey’s post-hoc test. At field scale, relationships between earthworm responses in terms of energy and enzymes activities and soil residual contamination were analyzed by Principal Component Analyses (PCA). Data was log-transformed, PCA were performed on the standardized A. caliginosa and A. chlorotica datasets from all the fields. The “ average input” conventional field was included in the analysis but not displayed in both scores plots for better clarity.
3 . R e s u l t s
3.1. P esticide residues in agricultural soil
N ine pesticides were detected in the soil of either of the five fields, 5 herbicides, 3 fungicides, one metabolite of glyphosate, but no insecticide (Table 2). 6, 8 and 4 residues were recovered in the “high-” , “ medium-” , and “ low-input” fields, respectively. F rom the 17 active ingredient molecules that were applied recently (2005e 2010) on the fields, 6 parent compounds and one metabolite were detected in soil (Table S2). Only the metabolite of glyphosate was detected in two fields (AMPA) but not the parent compound. Other recent applied molecules were not detected, e.g. dicamba, new-otrione, nicosulfuron, sulcnew-otrione, and bentazone, possibly due to the watery extraction method.
The herbicide atrazine was present in the three conventional fields (ranging from below LOQ to 2.4 ng g#1dry soil) and even T a b l e 1
Soil texture and chemical characteristics of the five agricultural fields studied. Clay % Silt % Sand % Organic
matter % pH (water suspension) CEC cmolc/ kg Cu (EDTA extracted e mg/ kg) Z n (EDTA extracted e mg/ kg) Ca (total) % K (total) % Pasture 17.6 69.3 13.1 4.03 6.03 9.21 14.2 7.55 0.3 1.48 Organic field 16.6 71.0 12.4 2.55 6.95 8.46 17.5 9.71 0.36 1.51 Low-input 19.5 59.4 21.1 3.1 6.93 7.92 13.7 6.48 0.32 1.35 Average-input 15.7 69.9 14.4 2.06 6.63 6.39 17 7.12 0.3 1.43 High-input 14.8 71.6 13.6 1.67 6.39 5.48 16.7 6.48 0.33 1.34 T a b l e 2
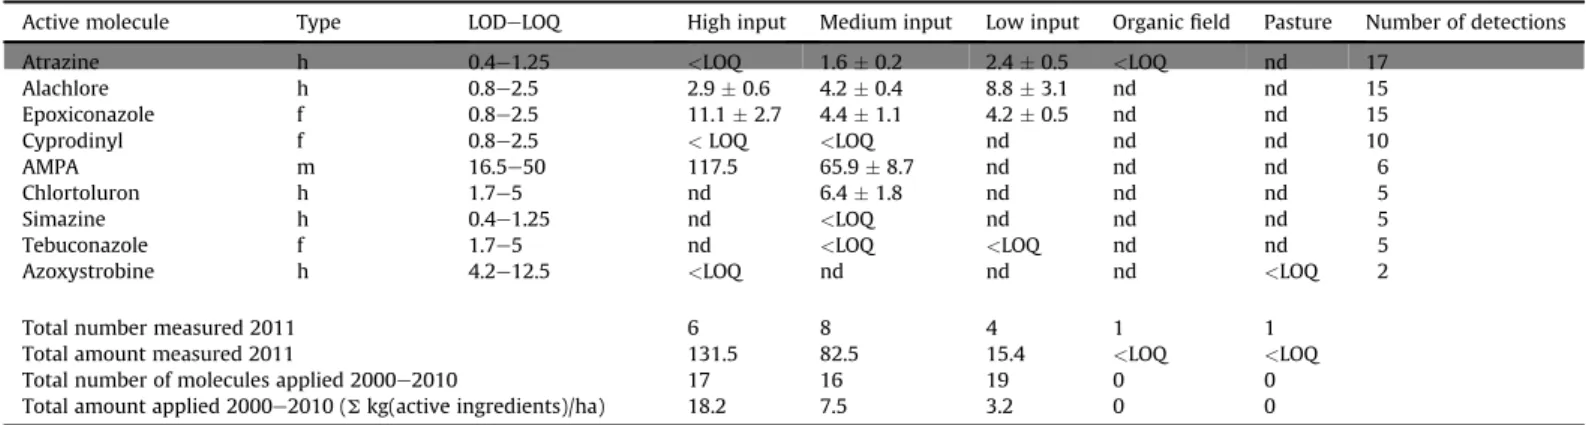
Soil multiresidual pesticide contamination of the five fields studied 2011, Brittany, F rance - mean and standard deviations (out of three replicates) of pesticide concentrations in ng g#1dry soil and number of detections (out of the 25 sampling points). In grey, pesticides that had not been applied since the start of the available cultivation history (2001). Pesticide type: h ¼ herbicide, f ¼ fungicide, m ¼ metabolite, LOD ¼ limit of detection, LOQ ¼ limit of quantification, nd ¼ below detection limit, <LOQ ¼ detected but below quantification limit, total amount measured 2011 is the sum of mean concentrations, total number measured 2011 is the sum of detected molecules.
Active molecule Type LODeLOQ High input Medium input Low input Organic field Pasture N umber of detections
Atrazine h 0.4e1.25 <LOQ 1.6 " 0.2 2.4 " 0.5 <LOQ nd 17
Alachlore h 0.8e2.5 2.9 " 0.6 4.2 " 0.4 8.8 " 3.1 nd nd 15
Epoxiconazole f 0.8e2.5 11.1 " 2.7 4.4 " 1.1 4.2 " 0.5 nd nd 15
Cyprodinyl f 0.8e2.5 <LOQ <LOQ nd nd nd 10
AMPA m 16.5e50 117.5 65.9 " 8.7 nd nd nd 6
Chlortoluron h 1.7e5 nd 6.4 " 1.8 nd nd nd 5
Simazine h 0.4e1.25 nd <LOQ nd nd nd 5
Tebuconazole f 1.7e5 nd <LOQ <LOQ nd nd 5
Azoxystrobine h 4.2e12.5 <LOQ nd nd nd <LOQ 2
Total number measured 2011 6 8 4 1 1
Total amount measured 2011 131.5 82.5 15.4 <LOQ <LOQ
Total number of molecules applied 2000e2010 17 16 19 0 0
Total amount applied 2000e2010 (S kg(active ingredients)/ ha) 18.2 7.5 3.2 0 0
N. Givaudan et al. / E nvironmental P ollution 192 (2014) 9e18 11
Table 2 : multi-contamination des sols des cinq champs étudiés en 2011. Moyennes et écarts-types (sur trois réplicats) des concentrations en pesticides
2. Activités enzymatiques in situ (vers de terre prélevés sur le terrain)
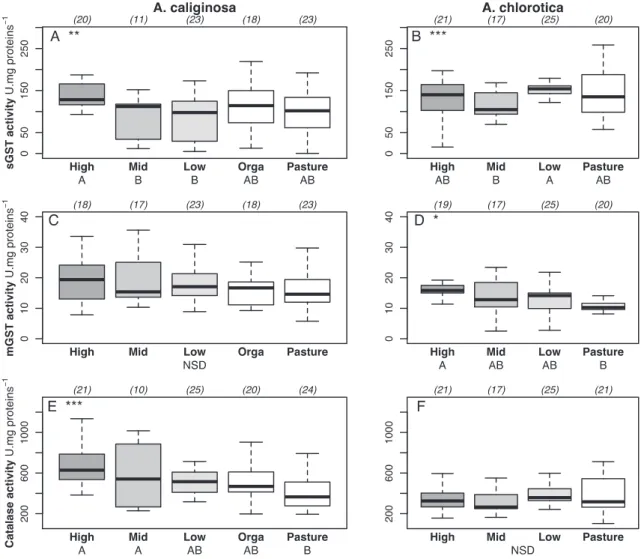
Globalement, l’activité des enzymes sGST et catalase chez A. caliginosa, ainsi que mGST chez A. chrlorotica augmentent avec l’apport de pesticides dans les champs conventionnels, et sont les plus faibles dans le champ bio et la prairie (Figure 1).
Figure 1 : activités enzymatiques dans les vers de terre selon l’historique de culture : conventionnel à intrants « Forts » (High), Moyens (Mid) et bas (Low) », organique cultivé (Orga) et organique prairie (Pasture). Activités de la Glutathion S Transferase soluble (sGST) et microsomale (mGST), et de la catalase (CAT) dans les vers de terre A. caliginosa (graphes de gauche) et A. chlorotica (graphes de droite). Un impact significatif de la
contamination du sol (Anova à un facteur « champ ») est indiqué par des astérisques en haut à gauche des graphes. Au dessus de chaque graphe, les nombres d’individus (réplicats) pour chaque modalité sont indiqués entre parenthèses.
detected in the organic field (below LOQ ), but not in the pasture. It was thus the most frequently detected, although it hadn’t been applied during the ten years (2000e2010) of available cultivation history of the three conventional fields. The two most frequently detected molecules of pesticides in actual use were alachlore and epoxiconazole. The epoxiconazole residues represented between 3 and 7% of the predicted concentration calculated according to their field application rates (Dittbrenner et al., 2010) after the last application of the pesticide, (2010 in the high input, 2009 in the medium input and 2007 in the low input field). Alachlore was not applied after 2000 on the high or medium input fields. In the low input field, its concentration was still 0.3% of the amount of the last application in 2007, before it was banned for agriculture use in F rance in 2008. Chlortoluron was detected in the medium-input field only after its application one year before. AMPA was only found in the high and medium input fields. However, applications of RoundU p F lash (glyphosate) had taken place on the three con-ventional fields in 2009 (medium and high input) and 2010 (low input). W ith the exception of the fungicide Azoxystrobine in one sampling point (<LOQ ), no pesticides were detected on the pasture. 3.2. E nz yme activities in earthw orms f rom the field
In A. caliginosa the activity of the detoxification enzyme sGST showed higher activities at highest input of pesticides in the con-ventional fields, compared to lower activities at the medium and
low input fields, whereas activities in earthworms from the organic field and the pasture were intermediate (F ig. 1). The mGST of A. caliginosa remained similar in the five fields. Almost opposite reactions were seen for A. chlorotica, where sGST didn’t follow a trend between the fields and the pasture. However, the mGST ac-tivities increased with increasing pesticide residues in the soil in conventional fields, and were lowest in the pasture. The catalase was more active in A. caliginosa with increasing pesticides in the soil, whereas it remained similar between the fields in A. chlorotica. 3.3. E nergy resources in earthw orms f rom the fields
F or energetic reserves in the earthworms, both, the pesticide contamination and the organic matter content in the field have to be considered. Soil organic matter was lowest in the high-input field (1.67% ), followed by the medium-input (2.06% ) and organic fields (2.55% ), then highest in the low-input field (3.1% ) and the pasture (4.03% ,Table 1).
In A. caliginosa glycogen content was lowest in the high-input field, and highest in the low-input field, following both, the organic matter content and the pesticide contamination (F ig. 2A). Glycogen was however, intermediate (not significantly different) in the organic field and the pasture, despite no pesticide stress and medium to high soil organic matter content. Lipids and proteins showed a similar pattern: highest in the medium-input field, and low in the organic field, but intermediate (not significantly
Fig. 1 . Enzyme activities in earthworms according to the chemical and tillage field history. Activities of soluble (sGST) and microsomal (mGST) Glutathione S transferase, and Catalase in earthworms A. caliginosa (left) and A. chlorotica (right). Significant impact of “ soil contamination” (one way AN OV A with “ field” as factor) is indicated by asterisks in the top left corner of each graph (* p < 0.05, * * p < 0.01, * * * p < 0.001). On top on each graph are n values for each field, and at the bottom, different letters (A, B or C) denote statistical differences between fields (Tukey’s “ Honestly Significant Difference” post hoc test).
N. Givaudan et al. / E nvironmental P ollution 192 (2014) 9e18 12
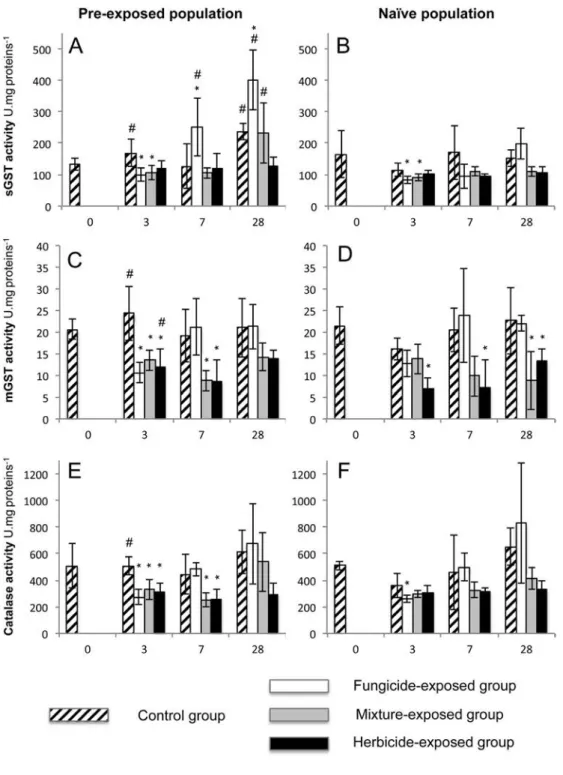
3. Réponses enzymatiques après exposition à deux pesticides et à leur mélange. Au début de l’expérience, les groupes témoins des deux populations de vers A. caliginosa (issus du conventionnel « hauts intrants » et du champ biologique) ont des activités
enzymatiques similaires. Après exposition, l’activité de la Glutathion S Transférase soluble (sGST) est très différente entre les deux populations. L’activité de la sGST augmente significativement avec le traitement epoxiconazole après 7 et 28 jours d’exposition chez la population pré-exposée (conventionnel « hauts intrants »), mais pas chez la population naïve (Figure 2). Le glyphosate ne provoque pas de changements entre témoins et exposés. Le mélange glyphosate/epoxiconazole augmente toutefois l’activité de la sGST après 28 jours d’exposition. L’activité de la Glutathione S Transferase microsomale n’est quasiment pas modifiée par l’époxiconazole, mais elle diminue significativement avec l’herbicide et le mélange des deux pesticides.
Figure 2 : capacités de détoxification chez des vers de terre pré-exposés A. caliginosa après exposition en laboratoire. Les histogrammes représentent les activités, moyennes de 6 réplicats, des enzymes Glutathione S transferase (soluble et microsomale) et catalase dans les vers de terre A. caliginosa après 3, 7, et 28 jours d’exposition au fongicide OPUS (0.1 µg molécule active / g sol sec), à l’herbicide Round Up Flash (2.5 µg molécule active / g sol sec) et leur mélange (somme des deux précédentes concentrations). * représente une différence significative entre groupe exposé à un pesticide et témoin (sans pesticide).
fungicide elevated activity of the catalase at day 28 alongside an elevation in the controls in both populations for unknown reasons, hence not significant against the controls.
4. Discussion
4.1. Pesticide residual contamination in agricultural soils
The highest diversity of pesticide molecules was found on the medium input field, followed by the high input, then by the low input. The glyphosate metabolite AMPA was about twice as high in the high input field, compared to the medium, and it was not detected in the
low input field. The non-recovery of many of the pesticides recently applied (2005e2010) indicates either degradation, or forming of bound residues that are not detectable by water extraction (Gevao et al., 2000). This study however highlights the persistency of atra-zine, epoxiconazole and alachlore. They have relatively long half-lives in soil: Atrazine 146 days in aerobic soil (PAN Pesticide Database), epoxiconazole a field DT50 >400 days (Bromilow et al., 1999), and alachlore 20 days in aerobic soil (PAN Pesticide Database).
Despite its ban in France in 2003, Atrazine was found in nearly all soil samples of the three conventional fields, and the organic field, but not in the pasture. The pasture and the organic field are located less than one kilometre apart both belonging to the same Fig. 4. Detoxification capabilities in pre-exposed and naive A. caliginosa after experimental acute pesticide exposure. Mean activities (!standard deviations as error bars) out of six replicates (N ¼ 6) of soluble and microsomal glutathione S-transferase and catalase in earthworms A. caliginosa after 3, 7 and 28 days of exposure to the fungicide Opus!(0.1mg active ingredient epoxiconazole g#1dry soil), RoundUp Flash!(2.5mg active ingredient glyphosate g#1dry soil), and their mixture (as added ingredients). * indicate significant differences between the treated and the control group and # indicate significant differences between the naïve and pre-adapted population.
Article 2: adaptation de vers de terre aux pesticides en paysage agricole, mécanismes physiologiques et conséquences écosystémiques
L’objectif de ce deuxième chapitre est de tester l’hypothèse selon laquelle des vers de terre issus d’un sol agricole conventionnel (avec utilisation de pesticides) ont acquis une tolérance vis à vis du fongicide époxiconazole, fréquemment appliqué sur le champ. Les réponses en laboratoire de vers de terre issus d’une population pré-exposée (champ conventionnel) sont comparées à celles d’une population naïve (champ en agriculture biologique) après exposition à une dose “environnementalement pertinente” du fongicide (correspondant au taux d’application par hectare). Ce travail s’attache à déterminer si une adaptation est quantifiable en comparant stockage énergétique et métabolisme (respiration et métabolomique) dans les deux populations.
Design expérimental:
Adults (presence of a fully developed clitellum) and sub-adults (presence of tubercula pubertatis) were used and individual weights were recorded (Table A, Supplementary materials). U pon collection, they were brought back to the laboratory and main-tained in the soil collected from the field at 25% humidity until start of fungicide exposure. Before the experiment, the earthworms were acclimatized for 14 days in the test soil in the climatic room used for the experiment (Conviron GR96; temperature: 15!C; day/
night cycle: 16/ 8 h; humidity: 80 " 5% ). 2.2. E x perimental setup
Soil contamination: Epoxiconazole was applied as commercial formulation OPU S! (125 g active ingredient l#1, obtained from
BayerCropScience) diluted in distilled water at 0.1 mg g#1 soil,
which is equivalent to a predicted field concentration calculated for a field application rate of 125 g ha#1assuming a single application
with an homogenous distribution and no crop interception in the top 5 cm of the soil (Dittbrenner et al., 2010). Soil spiking was conducted by manually adding 175 ml of the diluted pesticide so-lution or distilled water (for the controls) on each 2 kg of soil at 14% water content (1.75 kg dry weight) reaching a final soil water content of 24% . To insure homogeneity of pesticide distribution in the soil, the solution was added in two parts, the soil being thor-oughly mixed, resieved using a 2 mm aperture and redisposed as a fine layer. Soil microcosms consisted of polycarbonate boxes (80 mm $ 50 mm, Caubè re, Y ebles, F rance) with a lid pierced with tiny holes to ensure sufficient aeration. The microcosms were filled with 100 g of contaminated or control soil, then 0.2 g of dry grass meal was added to the surface of the soil. Then the microcosms were left two days in a cool dark room to ensure aeration of the soil after re-humidification. W ater content was checked again in 3 additional control boxes and adjusted to 25% prior to introduction of animals, then checked again each week.
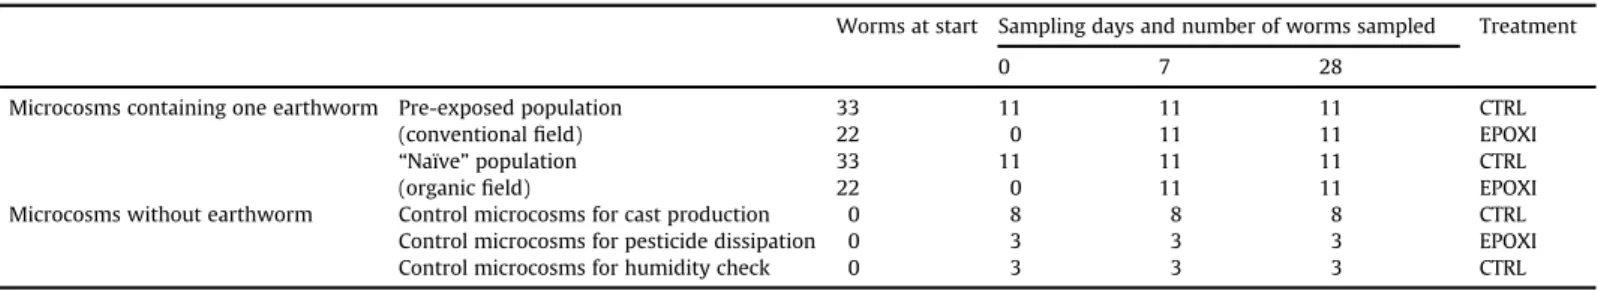
Experimental design: The experimental design is described in Table 1. It comprised 11 specimens from each population (pre-exposed and naïve) for each treatment (epoxiconazole or control) and sampling time (7 and 28 days) plus an initial control group at day 0 (unexposed). Prior start of exposure, each earthworm was rinsed in tap water, gently dried on filter paper, weighed and placed in individual Petri dishes for 48 h for gut voiding. Then animals were transferred individually to the exposure microcosms (day 0) according to a size-class procedure, insuring a similar mean earthworm weight in each treatment. Soil was spiked with epox-iconazole at 0.15mg g#1soil or control soil. Exposure lasted for 7
and 28 days, with an initial control group of 11 individuals for each population (unexposed worms) at day 0. At each sampling date, before use of the microcosms for cast production (see Section2.5) and pesticide measurements (see Section2.3), earthworms were removed from the soil taking care not to break the casts. F ive of them were used for respirometry assessment (2.4), energy re-sources (2.6), and metabolites measurements (2.7). The other 6
earthworms were used for enzyme activities measurements in another study and will not be considered here. After the worms have been sampled, 8 microcosms were used for cast production measurements, and 3 for pesticide analysis.
In addition, eight uncontaminated soil microcosms without worms were used as controls for the cast production test to assess the potential formation of non-biogenic aggregates at 7 and 28 days. Another 3 soil microcosms were filled with contaminated soil to track the fate of pesticide without the presence of worms. Hu-midity control was conducted in 3 additional, non-contaminated soil microcosms, in order to adjust humidity when necessary. 2.3. P esticide concentration in soil
Sub-samples of 2 g of soil were retrieved the day of the pollution (day 0), and after 7 and 28 days, from three randomly chosen mi-crocosms out of the 11 replicates. They were dried at 30!C
over-night, then kept frozen until pesticide analysis. Epoxiconazole in soil sub-samples was measured by liquid chromatography coupled with mass spectrometer (LCeMS) (W aters alliance 2690, W aters, Saint Q uentin en Y velines, F rance). 2 g of soil sample were extracted in 500 ml of mineral water. After 15 min of ultrasound treatment, the sample was mixed by rotary shaking for one hour, and sub-jected to another 15 min of ultrasound treatment. 0.25mg of tri-adimenol was added as internal standard and 1 ml of analytical-grade nitric acid (HN O3) to acidify the mixture. Then pesticides
were extracted from the aqueous mixture in two steps with 25 ml of HPLC-grade dichloromethane followed by 15 min of agitation. The dichloromethane extracts were combined and evaporated to a drop (ca. 10ml), then 500ml acetonitrile were added and 0.25mg of pentabromophenol were added as second internal standard. The extract was evaporated again to a drop and adjusted to 500ml with
10% acetonitrile acidified (0.1% formic acid).
This sample was analysed by LCeMS using a high-performance liquid chromatography (Alliance 2695, W aters, Saint Q uentin en Y velines, F rance) coupled to a quadrupole mass spectrometer model Z Q (W aters-Micromass, Saint Q uentin en Y velines, F rance) equipped with an electrospray source. Epoxiconazole was sepa-rated on a X Terra MS C18 column (150 $ 2.1 mm, 3.5 mm particle size, W aters, Saint Q uentin en Y velines, F rance) at 35!C. A binary
mobile phase gradient (A: ultrapure water with 0.1% formic acid; B: acetonitrile with 0.1% formic acid) was used for pesticide separa-tion. The chromatographic method held the initial mobile phase composition (82% A, 18% B) constant for 10 min, followed by 70% A/ 30% B (10 min), 50% A/ 50% B (15 min), 20% A/ 80% B (5 min), then again 82% A/ 18% B for 10 min. Q uantification limit was 2.5 ng g#1
dry soil and extraction yield was 75 " 7% . A standard curve of epoxiconazole was made with several aliquots of 2 g of dry soil (the same uncontaminated pasture soil used for the microcosms) spiked manually with the purified compound, air-dried for two hours, and extracted the same way as the real samples for quantification,
T a b l e 1
Experimental design of the laboratory exposure. Out of each group of 11 microcosms containing one earthworm, 5 randomly picked worms were used for respirometry assessment, energy resources, and metabolite measurements.
W orms at start Sampling days and number of worms sampled Treatment
0 7 28
Microcosms containing one earthworm Pre-exposed population 33 11 11 11 CTRL
(conventional field) 22 0 11 11 EPOX I
“N aïve” population 33 11 11 11 CTRL
(organic field) 22 0 11 11 EPOX I
Microcosms without earthworm Control microcosms for cast production 0 8 8 8 CTRL Control microcosms for pesticide dissipation 0 3 3 3 EPOX I
Control microcosms for humidity check 0 3 3 3 CTRL
N. Givaudan et al. / Soil Biology & Biochemistry 73 (2014) 49e58 51
Table 1: Design expérimental de l’expérience de laboratoire. Dans chaque groupe initial de 11 vers de terre (11 microcosmes), l’activité de bioturbation est mesurée dans 8 sur 11, la concentration en pesticides dans les trois micrososmes restants, et 5 vers sont pris au hasard pour les analyses de respirométrie, ressources énergétiques, et métabolomique
Principaux résultats:
• Respiration et dissipation énergétique
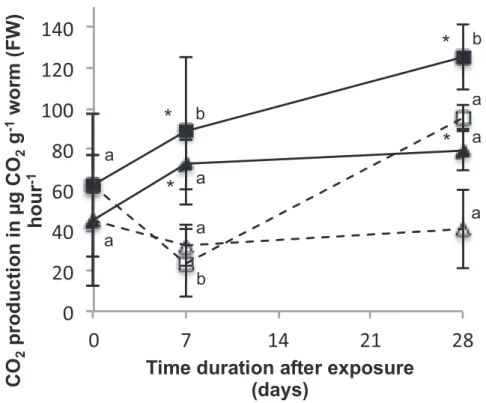
La figure 2 (ci-dessus) montre une activation de la production de CO2 dans les deux
populations suivant l’exposition à l’époxiconazole après 7 et 28 jours comparé aux groupes témoins non-exposés. Une différence significative entre les deux populations apparaît après 28 jours, la respiration est plus importante chez la population pré-exposée.
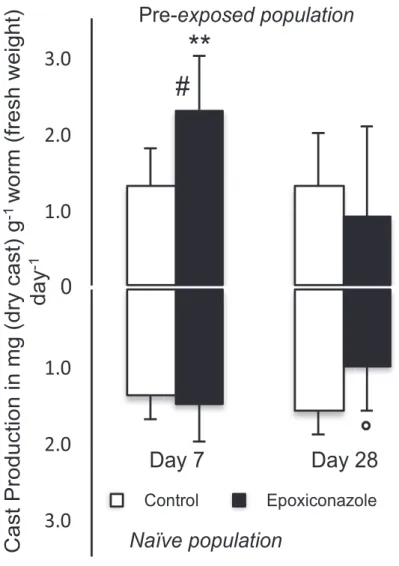
• Production de turricules (bioturbation)
La figure 3 (ci-dessous) montre qu’après 7 jours, l’application d’époxiconazole induit une augmentation significative de la production de turricules chez la population pré-exposée uniquement.
Figure 2: taux métabolique (!g CO2 . g-1 . ver-1 (poids frais) dans les populations de vers de terre pré-exposées (carrés) et naïves (triangles) après exposition à l’époxiconazole. Les symboles noirs sont les groupes exposés au fongicide et les blancs sont les groupes témoins (sans pesticides). Les résultats sont les moyennes sur 5 individus ± écarts types (barres d’erreurs). Les différences significatives entre groupes exposés et témoins sont indiqués par * et par # entre populations. Des lettres a et b différentes marquent les différences entre dates d’échantillonnages au sein du même groupe
tested by student-t-tests at 7 and 28 days. Significance level for student-t-tests was set at p ! 0.1. All analyses were conducted using
the statistical software of “ R 2.12.1” for Macintosh (R Development
Core Team, 2008). 3 . R e s u l t s
3.1. E nergy dissipation
F ungicide treatment increased CO2 production in both
pre-exposed and naïve populations after 7 and 28 days compared to
their non-treated controls (F ig. 1). Respiration rate in the
fungicide-treated group was higher after 7 and 28 days compared to day 0 in the pre-exposed population. Differences became significant be-tween populations at 28 days, where metabolic rates of the pre-exposed population (both pre-exposed and control groups) were still higher than at the outset, while it remained constant in the naïve population from day 7e28.
3.2. C ast production (C P )
The weight of casts (g of dry cast day"1) correlated linearly and
positively to earthworm weights at 7 and 28 days (R 2 ¼ 0.34;
p < 0.001 and R 2 ¼ 0.33; p < 0.05, respectively, all modalities
mixed). The cast production was then calculated as weight dif-ference of non-biogenic aggregates retained in the sieve from the 8 control (without worms) microcosms to the ones with worms and expressed per gram of fresh worm. W orms from both pop-ulations displayed similar patterns with constant CP over time in control soil microcosm and significantly changed CP with
fungi-cide treatment (F ig. 2). Application of epoxiconazole transitory
enhanced CP (7 days) in pre-exposed worms (p < 0.01), and slightly decreased it, however not significantly, after 28 days in both worm populations.
3.3. E nergy resources
Mean glycogen content was decreased by nearly 20 mg in fungicide-treated compared to control groups after 7 days in the naïve earthworms, and after 28 days in the pre-exposed
earthworms as shown in (F ig. 3A). At the end of the exposure, the
worms originating from the conventional-treated field had a slightly lower glycogen tissue level than the naïve ones.
The lipid tissue levels (F ig. 3B) did not show any significant
differences between un-exposed and fungicide exposed earth-worms or between earthearth-worms originating from the conventional or the organic-treated field. Lipid levels were lower in all treated groups compared to their respective controls, however it did not
achieve significance. Protein contents (F ig. 3C) decreased similarly
in the 4 groups of worms during the first 7 days. They were then significantly increased by fungicide treatment in both exposed and naïve populations compared to their respective controls after 28 days, with pre-exposed worms having a final protein amount almost twice as high as naïve ones.
3.4. M etabolomics
3.4.1. M etabolic profiles of f ungicide- ex posed and control populations
Twenty eight metabolites were detected and quantified in the earthworm tissues. F rom this dataset, 22 were kept for
interpre-tation (Table D, supplementary materials). F or the conventional
population (F ig. 4A), scores plots on axis 2 and 3 showed that the
worms exposed for 28 days formed a separate cluster from the 28 days control worms along axis 2 and 3. This pattern was not
observed in the organic population (F ig. 4B) along any of the three
axes, as it seems the time effect is greater than the fungicide effect. Indeed, the exposed and the control groups move in the same way with time, but are not clearly separated.
3.4.2. M etabolic changes in the w orms populations
In the loadings plots of the PCAs (F ig. 4C and D), several
co-ordinated responses were identifiable. In the conventional
Fig. 1 . Metabolic rate (mg CO2 g"1 worm (fresh weight) h"1) of pre-exposed (sq uare)
and naïve (triangle) A. caliginosa exposed to Epoxiconazole (solid symbols, f ull lines) or not exposed (open symbols, dashed lines) at day 0, 7 and 28. Mean values (N ¼ 5 worms per group) are presented with standard deviations as error bars. Significant differences are indicated with * between exposed and control worms and # between populations at each sampling time. Different letters (a or b) denote statistical differences between sampling times within the same group.
Fig. 2 . Mean cast production (in g dry cast weight g"1earthworm body mass day"1) of
pre-exposed and naïve Aporrectodea caliginosa after exposure to epoxiconazole for 7 and 28 days (n ¼ 8). Error bars are standard deviations (SD). * indicates significant differences between exposed and control groups (student-t-test,$p < 0.1, * p < 0.05,
* * p < 0.01) and # between earthworm populations.
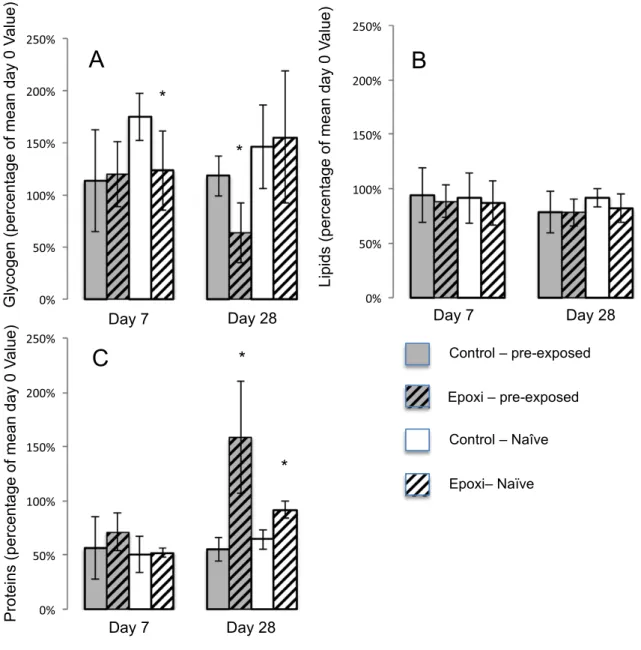
• Ressources énérgétiques
La figure 4 ci-dessous montre que le taux de glycogène baisse d’environ 20 mg dans les groupes exposés aux fongicides par rapport aux témoins après 7 jours chez les vers de terre naïfs et après 28 jours chez les vers de terre pré-exposés. Les niveaux de lipides varient peu au cours des 28 jours (pas de différences significatives). Les concentrations en protéines augementent significativement dans les deux populations par rapport aux témons après 28 jours, mais les vers de terre pré-exposés ont un taux de protéines final presque deux fois plus élevé que les les animaux naïfs.
Figure 3: production moyenne de turricules (en g de turricule sec par g de masse fraîche de ver de terre) chez deux populations de vers de terre naïve (en dessous) et pré-exposée (au dessus) après exposition en laboratoire à l’époxiconazole après 7 et 28 jours (n=8). Les barres d’erreurs sont les écarts-types. * indique une différente significative (p<0.05) entre groupe exposé au fongicide et témoin (sans pesticide) et # entre les deux populations. tested by student-t-tests at 7 and 28 days. Significance level for
student-t-tests was set at p ! 0.1. All analyses were conducted using the statistical software of “ R 2.12.1” for Macintosh (R Development Core Team, 2008).
3 . R e s u l t s
3.1. E nergy dissipation
F ungicide treatment increased CO2 production in both
pre-exposed and naïve populations after 7 and 28 days compared to their non-treated controls (F ig. 1). Respiration rate in the fungicide-treated group was higher after 7 and 28 days compared to day 0 in the pre-exposed population. Differences became significant be-tween populations at 28 days, where metabolic rates of the pre-exposed population (both pre-exposed and control groups) were still higher than at the outset, while it remained constant in the naïve population from day 7e28.
3.2. C ast production (C P )
The weight of casts (g of dry cast day"1) correlated linearly and
positively to earthworm weights at 7 and 28 days (R 2 ¼ 0.34; p < 0.001 and R 2 ¼ 0.33; p < 0.05, respectively, all modalities mixed). The cast production was then calculated as weight dif-ference of non-biogenic aggregates retained in the sieve from the 8 control (without worms) microcosms to the ones with worms and expressed per gram of fresh worm. W orms from both pop-ulations displayed similar patterns with constant CP over time in control soil microcosm and significantly changed CP with fungi-cide treatment (F ig. 2). Application of epoxiconazole transitory enhanced CP (7 days) in pre-exposed worms (p < 0.01), and slightly decreased it, however not significantly, after 28 days in both worm populations.
3.3. E nergy resources
Mean glycogen content was decreased by nearly 20 mg in fungicide-treated compared to control groups after 7 days in the naïve earthworms, and after 28 days in the pre-exposed
earthworms as shown in (F ig. 3A). At the end of the exposure, the worms originating from the conventional-treated field had a slightly lower glycogen tissue level than the naïve ones.
The lipid tissue levels (F ig. 3B) did not show any significant differences between un-exposed and fungicide exposed earth-worms or between earthearth-worms originating from the conventional or the organic-treated field. Lipid levels were lower in all treated groups compared to their respective controls, however it did not achieve significance. Protein contents (F ig. 3C) decreased similarly in the 4 groups of worms during the first 7 days. They were then significantly increased by fungicide treatment in both exposed and naïve populations compared to their respective controls after 28 days, with pre-exposed worms having a final protein amount almost twice as high as naïve ones.
3.4. M etabolomics
3.4.1. M etabolic profiles of f ungicide- ex posed and control populations
Twenty eight metabolites were detected and quantified in the earthworm tissues. F rom this dataset, 22 were kept for interpre-tation (Table D, supplementary materials). F or the conventional population (F ig. 4A), scores plots on axis 2 and 3 showed that the worms exposed for 28 days formed a separate cluster from the 28 days control worms along axis 2 and 3. This pattern was not observed in the organic population (F ig. 4B) along any of the three axes, as it seems the time effect is greater than the fungicide effect. Indeed, the exposed and the control groups move in the same way with time, but are not clearly separated.
3.4.2. M etabolic changes in the w orms populations
In the loadings plots of the PCAs (F ig. 4C and D), several co-ordinated responses were identifiable. In the conventional
Fig. 1 . Metabolic rate (mg CO2g"1worm (fresh weight) h"1) of pre-exposed (sq uare)
and naïve (triangle) A. caliginosa exposed to Epoxiconazole (solid symbols, f ull lines) or not exposed (open symbols, dashed lines) at day 0, 7 and 28. Mean values (N ¼ 5 worms per group) are presented with standard deviations as error bars. Significant differences are indicated with * between exposed and control worms and # between populations at each sampling time. Different letters (a or b) denote statistical differences between sampling times within the same group.
Fig. 2 . Mean cast production (in g dry cast weight g"1earthworm body mass day"1) of
pre-exposed and naïve Aporrectodea caliginosa after exposure to epoxiconazole for 7 and 28 days (n ¼ 8). Error bars are standard deviations (SD). * indicates significant differences between exposed and control groups (student-t-test,$p <0.1, * p < 0.05,
* * p < 0.01) and # between earthworm populations.
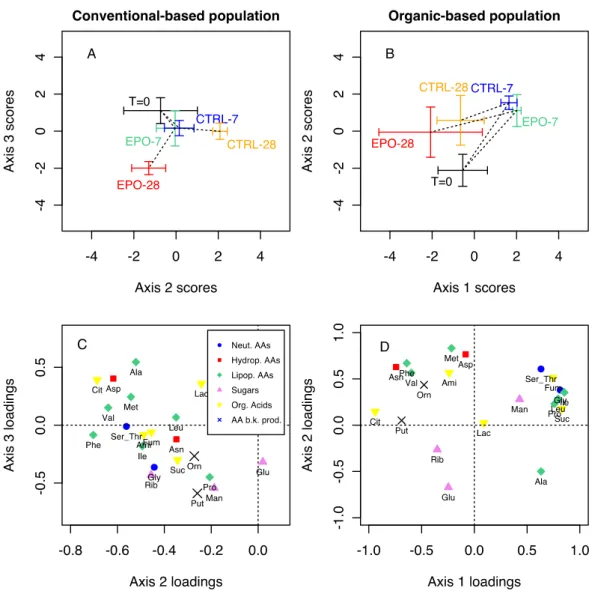
• Métabolomique
28 métabolites sont détectés dans les tissus des animaux. 22 métabolites pertinents pour le métabolisme énergétique sont gardés sur les 28 pour interprétation des résultats. La figure 4 montre la représentation graphique d’une analyse en composantes principales du jeu de données métabolomique. Les scores des différents individus sur les composantes deux et trois (population « pré-exposée » = agriculture conventionnelle ) et 1 et 2 (population « naïve » =
Figure 3: taux de glycogène (A), lipides (B) et protéines (C) chez des populations de vers de terre
Aporrectodea caliginosa pré-exposées et naïves après exposition au fongicide epoxiconazole. Les résultats
sont exprimés en pourcentage du taux intitial (début de l’expérience à 0 jours), et sont des moyennes sur 5 individus ± écarts-types (barres d’erreur). Les différences significatives sont indiquées par * entre groupes exposés au fongicide et témoins.
population (F ig. 4C), the 7 variables that have loadings lower than !0.5 on axis 2 form a first cluster containing mostly lipo-philic amino-acids. Another cluster is in the lower half of the plot corresponding to variables having low loadings (roughly, <!0.2) on axis 3, composed of the three sugars, succinate, ornithine, the amino-acids glycine and proline and putrescine. On the other hand in the organic population (F ig. 4D), we see two clear clusters that could correspond to the incubation time: the top right corner for seven days and the top left corner for 28 days. Day zero would correspond to the sugars Glu and Rib (lower half). The induced changes in metabolite concentrations after exposure was then measured as normalized concentrations in percentage of the control value and compared according to functional groups (F ig. 5). In the conventional worms, several metabolites increased after 28 days of epoxiconazole exposure in all four biochemical groups (amino-acids, sugars, organic acids and ornithineeputrescine), up to 7-fold for aspartate, 4-fold for aminobutyrate, and 2-fold for ornithine and putrescine. This general increase in metabolite levels was not observed in the naïve population, which displayed different trends. Indeed, in F ig. 5E, certain amino-acids (Asn, Asp, Phe and V al) increased slightly, whereas others dropped below 100% or stayed stable at 28 days. N ot much variation was observed in organic acids of the organic earthworms at 28 days, except for aminobutyrate which dropped to 50% of the control value, contrasting to its 4-fold increase in the pre-exposed animals. Putrescine level increased by 2-fold after 28 days in both populations whereas ornithine decreased to below 50% of the control value in the organic population only.
4. D is c u s s io n
4.1. Acclimation in energetic processes and metabolism
Animals can tolerate pollutants via biotransformation, excretion or scavenging of free radicals (when pollutants induce oxidative stress). F or example, detoxification of several pollutants, e.g. atra-zine or paraquat, is mediated via the enzyme Glutathione-S-Transferase. This enzyme, belonging to phase II detoxification mechanisms, acts through binding xenobiotics to glutathione and facilitating its excretion (Anderson and Gronwald, 1991;W iegand et al., 2007, 2000). Another common detoxification pathway to xenobiotics is the group of cytochrome p450 oxidases. This family of enzymes transforms the structure of organic chemicals, hence greatly altering their toxicity (Ribera et al., 2001; Rodrí guez-Castellanos and Sanchez-Hernandez, 2007). However, no data on epoxiconazole tolerance pathways e.g. detoxification mechanisms was available in the literature.
On the other hand, the literature suggests that there are ener-getic costs in organisms for coping with pollutants (W iegand et al., 2007; F isker et al., 2011; Holmstrup et al., 2011). The way organisms handle energetic processes can therefore inform us on adaptation mechanisms. As an example by measuring the main energy re-sources, Pook et al. (2009) showed that a metal-resistant popula-tion of marine harbour ragworm (Nereis diversicolor) had a lower scope for growth than a reference (non-resistant) population and demonstrated a metabolic cost, or tradeoff, of resistance. Other tradeoffs can be the co-selection of traits along with tolerance to xenobiotics, such as life history traits. Interestingly, in the Fig. 3 . Glycogen (A), Lipids (B), and Proteins (C) contents (percentage of mean of day 0 value) of pre-exposed and naïve A. caliginosa exposed to Epoxiconazole at day 7 and 28. Mean values (N ¼ 5 worm per group) are presented with standard deviations as error bars. Significant differences are indicated with * between exposed and control worms (Student-t-tests, p < 0.1).
N. Givaudan et al. / Soil Biology & Biochemistry 73 (2014) 49e58 54
agriculture biologique) sont représentés en A et B en fonction du temps d’exposition. Chez la population conventionnelle, les vers de terre exposés pendant 28 jours forment un groupe séparé des vers témoins selon les axes 2 et 3. Ce fait n’est pas observé chez la population biologique ou on constate un effet du temps d’exposition mais pas du fongicide.
Figure 4: analyse en composantes principales du jeu de données métabolomique (22 variables) montrant les relations et corrélations entre les profils métaboliques et l’exposition à l’époxiconaezole. A et B: scores des individus sur les composantes principales (2 et 3 pour la population conventionnelle et 1 et 2 pour la population biologique). Les données sont représentées comme moyennes (croix) des scores sur les deux composantes principales pour les groupes exposés et contrôles ± erreur standard de la moyenne. Les groupes exposés et contrôles sont joints par une ligne pointillée par ordre de temps.
C et D: saturations des variables avec les composantes principales (corrélations entre variables et composantes principales).Les métabolites sont identifiés par leur abbréviation et colorés par groupes fonctionnels (voir légende).
conventionally cropped field, the worms sampled had a lower initial mean weight but with constant tissue composition
compared to the organic worms (Table A, Supplementary
materials). This could be a result of the selection of smaller in-dividuals, by the global agricultural management of the field, as a possible combined effect of fertilizers, pesticides and tillage (tillage was less frequent in the organic field due to the lucerne cropping). This assumption is supported by the fact that the bigger anecic species such as Lumbricus terrestris or Aporrectodea giardi are usu-ally the most impacted in cropped soil (Edwards and Bohlen, 1996). To investigate such energetic costs, we measured the worm’s metabolic rate (mg CO2g!1worm (fresh weight) h!1) as a proxy of energy dissipation, and the main energy storage compounds which are glycogen (main sugar resource), total proteins and lipids. Metabolic rate was increased in both populations after 7 days of exposure, showing that the fungicide increased metabolic rate, but to a greater extent in the pre-exposed earthworms. Energy dissi-pation in both control and exposed groups were indeed higher than the naïve earthworms after 28 days. The increase in putrescine and alanine observed in the two populations when exposed suggests a stress response in both groups of earthworms, these two metabo-lites have previously been suggested as universal biomarkers in metabolomics studies (Rhee et al., 2007; Groppa and Benavides, 2008; Simpson and McKelvie, 2009). However, the increase in most amino-acids contents in the pre-exposed earthworms after 28 days, which is not observed in the naïve animals, indicates a particular metabolic response. Several studies reported that the available resources in amino-acids were at the centre of metabolic
activity during stress responses (Simpson and McKelvie, 2009; Krasensky and Jonak, 2012; Lankadurai et al., 2013). Moreover, the increase in alanine, aspartate, aminobutyrate and succinate observed in the pre-exposed populations could indicate an acti-vation of the alanine, aspartate and glutamate pathway (Kanehisa and Goto, 2000).
The increase in both metabolic rates was reflected by depletion in the lipid and the glycogen resource. However a temporal delay appeared in the glycogen usage, indicating a differential mobi-lisation of this sugar resource between naïve and pre-exposed earthworms. The naïve earthworms seem to consume glycogen earlier than the pexposed group. Glycogen breakdown is re-flected by the slight increase of glucose in fungicide-exposed groups of earthworms after 28 days. Soluble proteins were also significantly higher after 28 days in the pre-exposed worms only, which could indicate the higher synthesis of detoxification en-zymes such as cytochrome p450 (Lukkari et al., 2004). Metabolic profiles of control and exposed groups in pre-exposed earthworms became distinct after 28 days, indicating that metabolic networks have been rearranged to maintain internal homeostasis and per-formance of the organisms.
Overall, all these findings show that pre-exposition of earth-worms over generations in the conventional farming system has led to physiological adaptation, as evidenced by their higher reac-tion to the fungicide. Other studies have shown that separareac-tion of metabolic signatures (PCA analyses) increase with higher doses of the pollutants, e.g. DDT, endosulfan or copper (Bundy et al., 2008; Simpson and McKelvie, 2009). It is likely that, in our study, Fig. 4. Principal Component Analysis of metabolites data (22 variables) showing relationship between metabolite profiles and epoxiconazole exposure along time. A, B: Scores plots for conventional population (Axes 2 and 3) and organic population (Axes 1 and 2). Data are shown as crosses for both exposed and control groups means " standard error of the mean (SEM). Exposed and Control groups are joined by time order with dashed lines. C, D: Loadings plots for individual metabolites in the conventional population (axes 2 and 3) and in the organic population (axes 1 and 2). Metabolites are identified by their abbreviations and coloured by functional groups listed in supplementary material (Table D, Supplementary materials).
Article 3 : traits d’histoire de vie et réponse à la contamination du sol chez des populations de vers de terre issus de gestions agricoles contrastées
L’objectif de ce chapitre est de tester l’hypothèse selon laquelle des vers de terre issus d’un sol cultivé depuis longtemps en agriculture conventionnel ont pu développer des réponses adaptatives aux pesticides en terme de traits de vie.
Les traits de vie sont comparés dans deux populations indépendantes de ver de terre
Aporrectodea caliginosa issues d’un champ en agriculture conventionnelle (avec pesticides)
et d’un champ en agriculture biologique (sans pesticides), depuis au moins 20 ans. Les différences entre populations sont étudiées en terme de poids des adultes, juvéniles et cocons, epaisseur de la paroi du cocon, temps et taux d’éclosion des cocons, et taux de croissance des juvéniles après exposition aux polluants « modèles » glyphosate (herbicide) et époxiconazole (fongicide).
Résultats principaux (traits de vie) :
La table 2 montre les traits de vie des deux populations (adultes issus des champs et génération suivante). ! ! Population*and*champ*d’origine* ! ! pré%exposée! naïve! ! ! conventionel! biologique! ! ! ! ! Poids! Adultes! !!!417!±!171!!mg! !!662*±*193!mg! ! Cocons! 12.50!±!2.30!mg! 13.72*±*6.30!mg! ! Nombre!de!juvéniles! 12.24!±!3.32!mg! 11.04!±!3.39!mg! ! Paroi!du!cocon! !!!0.54!±!0.38!mg! **2.39*±*0.31!mg! ! ! ! ! ! ! ! !
Eclosion! Temps!d’éclosion! !!!!30.71!±!3.96!jours! !28.34*±*5.10!jours!
! Taux!d’éclosion!! 64!%! 81!%! ! Survie!des!juvéniles!! 48!%! 48!%! ! ! ! ! ! ! ! ! Paroi!du! cocon! Epaisseur! 24.82!±!4.02!µm! 24.61!±!4.98!µm! ! ! ! !
Table 2: traits de vie de populations de vers de terre Aporrectodea caliginosa (n=150) issus d’un champ conventionnel “pré-exposée” et d’un champ biologique “naïve”. Poids moyens des adultes et des cocons produits, nombre de juvéniles moyens, différence moyenne “cocon produit moins juvénile éclos “, temps et taux
d’éclosion moyen des cocons, survie des juvéniles, et épaisseur moyenne des cocons par population. Les différences significatives entre populations sont indiquées en gras.
Les poids moyens des vers adultes et de leurs cocons sont significativement plus faibles dans le champ conventionnel que dans le champ biologique. Le temps d’éclosion est aussi
significativement plus long et le taux d’éclosion plus faible pour les cocons issus de la population conventionnelle.
Discussion et conclusions
Il y a actuellement un manque d'informations disponibles sur la contamination résiduelle des sols par les pesticides. Les pesticides, bien qu'ils soient appliqués sur les cultures, ne sont pas souvent mesurés dans le sol, mais plutôt dans les plantes et les eaux souterraines (Van-Camp et al. 2004). Aucune mesure détaillée des pesticides dans les sols ne sont disponibles à l'échelle de l'UE pour évaluer leur contamination résiduelle. La modélisation permet
cependant d’estimer de façon plus concrête ces résidus dans les sols (European Commission 2004). Un modèle simple de contamination par les herbicides dans les sols des pays
européens a été réalisée en 2004 par l'Unité de gestion des ressources foncières de la
Commission européenne (2004). Le modèle prédit que, avec les pratiques agricoles actuelles , dans plusieurs pays de l'UE dont la France, les quantités d'herbicides dans les sols cultivés en céréales, maïs et betterave à sucre sont susceptibles d’augmenter. En se basant sur l'histoire de la culture des trois champs conventionnels dont fait l’objet ce travail de thèse, plus de 50 molécules actives de pesticides différentes ont été appliquées à différents taux d'application et fréquences entre 2000 et 2010. Cependant, seulement 9 d'entre eux ont été détectées ou quantifiées dans le sol en 2011, indiquant des persistences dans les sols très variables (manuscrit 1). Une grande diversité de molécules est détectée dans les sols des champs conventionnels, et seul l’herbicide atrazine est détecté dans le champ en agriculture
biologique, indiquant probablement une contamination ancienne. De nombreuses molécules appliquées récemment (2005-2010) sur les champs conventionnels ne sont pas détectées indiquant une dégradation rapide. Toutefois cette étude permet de souligner la persistance des molécules atrazine, époxiconazole, et alachlore. En effet, ils ont des demi-vies assez longues dans le sol : 146 jours pour l’atrazine (Pesticide Action Network), 400 jours (in situ) pour l’époxiconazole (Bromilow et al. 1999), et 20 jours pour l’alachlore en sol oxygéné (Pesticide Action Network). Une capacité de détoxification augmentée et un plus grand potentiel anti-oxidant sont observés le long du gradient de contamination du sol et en laboratoire après exposition des vers de terre des champs conventionnel (population « pré-exposée ») et biologique (« naïve) à des pesticides.
Des résidus de pesticides sont donc détectés dans les sols longtemps après leur dernière application sur les champs (jusqu’à plus de 20 ans pour l’herbicide atrazine). Une corrélation est observée entre l’historique d’exposition agricole des vers de terre aux pesticides et leur capacité de détoxification (in situ et en laboratoire). Des différences spécifiques entre espèces en terme d’activité de détoxification in situ sont aussi constatées entre Aporrectodea
caliginosa et Allolobophora chlorotica. La corrélation entre activité de détoxification et
anti-oxydante et la contamination des sols est démontrée uniquement chez A. caliginosa. Cette étude est la première démontrant une réponse adaptative (mais non-génétique) dans le système de désintoxication de vers de terre exposés aux pesticides à long terme. Cette réponse adaptative pourrait non seulement être fondée sur la Glutathion-S-Transferase (mécanisme de détoxification de phase II), mais peut-être aussi sur d'autres phases du système
biotransformation / détoxication, tels que les monooxygénases cytochrome p450-dépendantes, c’est-à-dire la désintoxication de phase I. L'augmentation marquée des niveaux de protéines solubles dans les vers de terre pré-exposés lorsqu'exposés au fongicide soutient l'hypothèse que d'autres parties du système de détoxication pourraient être impliqués. La mesure d'enzymes de détoxification supplémentaires telles que le cytochrome P4501A (CYP1A) monooxygénase (Lukkari et al. 2004) permettrait de préciser ce mécanisme adaptatif. Les bases génétiques du mécanisme restent aussi à démontrer. Par exemple, d'autres essais
d'exposition au fongicide époxiconazole, et éventuellement à d'autres pesticides (pour tester si cette réponse est spécifique à un polluant ou à une famille de composés) pourraient aussi être réalisés avec des générations F1 et F2.
Une adaptation physiologique est démontrée chez les animaux pré-exposés, qui est associée à une ’augmentation de la bioturbation, et en cascade à une dissipation du pesticide dans le sol. Les conséquences au niveau de la population sont observées en termes de traits d’histoire de vie des deux populations pré-exposées et naïves. Le management en conventionnel incluant l’utilisation de pesticides semble diminuer le poids des adultes au champ, et implique
potentiellement la réallocation des ressources énergétiques, des mécanismes reproductifs vers les processus métaboliques. Ceci aboutit à une diminution de la fécondité et du pourcentage d’éclosion et pourrait être un facteur participant à la diminution des populations de vers de terre dans les champs cultivés avec utilisation de produits phytosanitaires.
Références bibliographiques :
Binet, F. et al., 1998. Significance of earthworms in stimulating soil microbial activity.
Biology and Fertility of Soils, 27(1), p.79‑84.
Bottinelli, N. et al., 2010. Earthworms accelerate soil porosity turnover under watering conditions. Geoderma, 156(1-2), p.43‑47.
Bromilow, R.H., Evans, A.A. & Nicholls, P.H., 1999. Factors affecting degradation rates of five triazole fungicides in two soil types: 2. Field studies. Pesticide Science, 55(12), p.1135–1142.
Van-Camp, L. et al., 2004. Reports of the Technical Working Groups Established under
the Thematic Strategy for Soil Protection., Luxembourg: Office for Official
Publications of the European Communities. Available at:
http://citeseerx.ist.psu.edu/viewdoc/download?doi=10.1.1.130.5966&rep=rep1&ty pe=pdf [Consulté le janvier 28, 2014].
Dittbrenner, N. et al., 2010. Physiological and behavioural effects of imidacloprid on two ecologically relevant earthworm species (Lumbricus terrestris and Aporrectodea caliginosa). Ecotoxicology, 19(8), p.1567‑1573.
European Commission, 2004. IRENA 20 – Pesticide soil contamination, Land Resource Management Unit.
Fisker, K.V., Holmstrup, M. & Sørensen, J.G., 2013. Variation in metallothionein gene expression is associated with adaptation to copper in the earthworm
Dendrobaena octaedra. Comparative Biochemistry and Physiology Part C:
Toxicology & Pharmacology, 157(2), p.220‑226.
Gevao, B. et al., 2001. Bioavailability of Nonextractable (Bound) Pesticide Residues to Earthworms. Environmental Science & Technology, 35(3), p.501‑507.
Giddings, J.M. et al., 2005. A Probabilistic Aquatic Ecological Risk Assessment of
Atrazine in North American Surface Waters, Pensacola, FL: SETAC.
Jones, C.G., Lawton, J.H. & Shachak, M., 1997. Positive and negative effects of organisms as physical ecosystem engineers. Ecology, 78(7), p.1946–1957. Jordan, D. et al., 2004. Effect of management practices and cropping systems on
earthworm abundance and microbial activity in Sanborn Field: a 115-year-old agricultural field. Pedobiologia, 48(2), p.99‑110.
Lee, K.E., 1985. Earthworms, their ecology and relationships with soils and land use New York Academic Press.,
Luchini, L.C., Peres, T.B. & de Andréa, M.M., 2000. Monitoring of pesticide residues in a cotton crop soil. Journal of Environmental Science and Health, Part B, 35(1), p.51‑59.
Lukkari, T. et al., 2004. Biomarker responses of the earthworm Aporrectodea
tuberculata to copper and zinc exposure: differences between populations with and without earlier metal exposure. Environmental Pollution, 129(3), p.377‑386. Monard, C., Binet, F. & Vandenkoornhuyse, P., 2008. Short-Term Response of Soil
Bacteria to Carbon Enrichment in Different Soil Microsites. Applied and
Environmental Microbiology, 74(17), p.5589‑5592.
Pelosi, C. et al., 2013. Reduction of pesticide use can increase earthworm populations in wheat crops in a European temperate region. Agriculture, Ecosystems &
Environment, 181, p.223‑230.
Redondo, M.J. et al., 1994. Persistence of pesticide residues in orchard soil. Science of
The Total Environment, 156(3), p.199‑205.
Smith, R.G. et al., 2008. Diversity and abundance of earthworms across an agricultural land-use intensity gradient. Soil and Tillage Research, 100(1–2), p.83‑88.
Solomon, K.R. et al., 1996. Ecological risk assessment of atrazine in North American surface waters. Environmental Toxicology and Chemistry, 15(1), p.31‑74. Springett, J.A. & Gray, R.A.J., 1992. Effect of repeated low doses of biocides on the
earthworm Aporrectodea caliginosa in laboratory culture. Soil Biology and
Biochemistry, 24(12), p.1739‑1744.
Yasmin, S. & D’Souza, D., 2010. Effects of Pesticides on the Growth and Reproduction of Earthworm: A Review. Applied and Environmental Soil Science, Vol. 2010, p.1‑9.
PhD Thesis by NICOLAS GIVAUDAN
Adaptation strategies of soil biodiversity (earthworms) to
pesticides: mechanisms in play and ecosystemic cost
assessment
to obtain the degree of Doctor (PhD) in Biology
as joint degree (“cotutelle”) between the University of Rennes 1 and the University of Southern Denmark
Institute of Biology, University of Southern Denmark Odense, Denmark
PhD thesis by Nicolas Givaudan 2
Supervisors :
Dr Françoise Binet
Directrice de Recherches CNRS
UMR CNRS 6553 ECOBIO
Université de Rennes 1
Rennes, France
Pr Claudia Wiegand
Associate Professor
Institute of Biology
University of Southern Denmark
Odense, Denmark
PhD thesis by Nicolas Givaudan
3