HAL Id: hal-01796060
https://hal.archives-ouvertes.fr/hal-01796060
Submitted on 4 Jun 2018
HAL is a multi-disciplinary open access
archive for the deposit and dissemination of
sci-entific research documents, whether they are
pub-lished or not. The documents may come from
teaching and research institutions in France or
abroad, or from public or private research centers.
L’archive ouverte pluridisciplinaire HAL, est
destinée au dépôt et à la diffusion de documents
scientifiques de niveau recherche, publiés ou non,
émanant des établissements d’enseignement et de
recherche français ou étrangers, des laboratoires
publics ou privés.
Predicting Contradiction Intensity: Low, Strong or Very
Strong?
Ismail Badache, Sébastien Fournier, Adrian-Gabriel Chifu
To cite this version:
Ismail Badache, Sébastien Fournier, Adrian-Gabriel Chifu.
Predicting Contradiction Intensity:
Low, Strong or Very Strong?. 41st st International ACM SIGIR Conference on Research and
De-velopment in Information Retrieval SIGIR2018, Jul 2018, Ann Arbor, Michigan, United States.
�10.1145/3209978.3210098�. �hal-01796060�
Predicting Contradiction Intensity: Low, Strong or Very Strong?
Ismail Badache
Aix Marseille Univ, Université de Toulon, CNRS, LIS, Marseille, France
Sébastien Fournier
Aix Marseille Univ, Université de Toulon, CNRS, LIS, Marseille, France
Adrian-Gabriel Chifu
Aix Marseille Univ, Université de Toulon, CNRS, LIS, Marseille, France
ABSTRACT
Reviews on web resources (e.g. courses, movies) become increas-ingly exploited in text analysis tasks (e.g. opinion detection, con-troversy detection). This paper investigates contradiction intensity in reviews exploiting different features such as variation of ratings and variation of polarities around specific entities (e.g. aspects, top-ics). Firstly, aspects are identified according to the distributions of the emotional terms in the vicinity of the most frequent nouns in the reviews collection. Secondly, the polarity of each review seg-ment containing an aspect is estimated. Only resources containing these aspects with opposite polarities are considered. Finally, some features are evaluated, using feature selection algorithms, to deter-mine their impact on the effectiveness of contradiction intensity detection. The selected features are used to learn some state-of-the-art learning approaches. The experiments are conducted on the Massive Open Online Courses data set containing 2244 courses and their 73,873 reviews, collected from coursera.org. Results showed that variation of ratings, variation of polarities, and reviews quan-tity are the best predictors of contradiction intensity. Also, J48 was the most effective learning approach for this type of classification.
KEYWORDS
Sentiment, Aspect, Feature evaluation, Contradiction intensity.
1
INTRODUCTION
Nowadays, web 2.0 has become a participatory platform where people can express their opinions by leaving traces (e.g. review, rating, like) on web resources. Many services, such as blogs and social networks, represent a rich source of these social information, which can be analyzed and exploited in various applications and contexts [1]. One application in particular is the sentiment analysis, for example, to know a customer’s attitude towards a product or its characteristics, or to reveal the reaction of people to an event. Such problems require rigorous analysis of the aspects covered by the sentiment to produce a representative and targeted result. Another issue concerns the diversity of opinions on a given topic. For example, Wang and Cardie [21] aim to identify the sentiments of a sentence expressed during a discussion and they use them as features in a classifier that predicts dispute in discussions. Qiu et al. [15] automatically identify debates between users from textual
content (interactions) in forums, based on latent variable models. Other studies in the analysis of user interactions aim to extract agreement and disagreement expressions [11] and deducing the user relations by looking at their textual exchanges [8].
This paper investigates the entities (e.g. aspects, topics) for which the contradictions can occur in the reviews associated with a web resource (e.g. movies, courses) and how to estimate their inten-sity. The interest of estimating contradiction intensity depends on application framework. For example, knowing the intensity of con-flicting opinions on an aspect of an online course can help teacher to improve its course. In information retrieval, for some information needs, measuring contradiction intensity can be useful to identify the most controversial documents. In order to design our approach, fundamental tasks are performed. First, aspects characterising these reviews are automatically identified. Second, opposing opinions around each of these aspects through a model of sentiment analysis are captured. Third, we particularly aim at evaluating the impact of some features (e.g. number of negative reviews, number of positive reviews) on contradiction intensity detection. More specifically, we attempt to select those most effective and combine them with learn-ing approaches for contradiction intensity prediction. The main contributions addressed in this paper are twofold:
(C1). A contradiction in reviews related to a web resource means contradictory opinions expressed about a specific aspect, which is a form of diversity of sentiments around this aspect. But in addition to detecting the contradiction, it is desirable to estimate its intensity. Therefore, we try to answer the following research questions: RQ1. How to estimate the intensity of contradiction?
RQ2. What is the impact of the joint consideration of the polarity and the rating on the measurement of contradiction intensity? (C2). A development of a dataset collected from coursera.org which is useful for the evaluation of contradiction intensity measurement systems. Our experimental evaluation is based on user study.
2
RELATED WORK
Contradiction detection is a complex process that often requires the use of several state of the art methods (aspect detection, sen-timent analysis). Moreover, to the best our knowledge, very few studies treat the detection and the measurement of the intensity of contradiction. This section briefly presents some approaches for detecting contradictions and controversies close to our work.
The most related studies to our approach include [3, 7, 19], which attempt to detect contradiction in text. There are two main ap-proaches, where contradictions are defined as a form of textual inference (e.g. entailment identification) and analysed using lin-guistic technologies. Harabagiu et al. [7] proposed an approach for contradiction analysis that exploits linguistic features (e.g. types of verbs), as well as semantic information, such as negation (e.g. “I love you - I do not love you”) or antonymy (words having opposite
meanings, “hot-cold” or “light-dark”). Their work defined contradic-tions as textual entailment, when two sentences express mutually exclusive information on the same topic. Further improving the work in this direction, De Marneffe et al. [3] introduced a classifica-tion of contradicclassifica-tions consisting of 7 types that are distinguished by the features that contribute to a contradiction, e.g. antonymy, negation, numeric mismatches which may be caused by erroneous data: “there are 7 wonders of the world - the number of wonders of the world is 9”. They defined contradictions as a situation where two sentences are extremely unlikely to be true when considered together. Tsytsarau et al. [19] proposed a scalable solution for the contradiction detection problem using sentiments analysis. The intuition of their approach is that when the aggregated value for sentiments (on a specific topic and time interval) is close to zero, while sentiment diversity is high, contradiction should be high.
Another theme related to our work concern the detection of controversies and disputes. In the literature, the detection of con-troversies has been addressed both by supervised methods as in [2, 13, 22] or by unsupervised methods as in [4, 5, 10]. To detect con-troversial events on Twitter (e.g., David Copperfield’s charge of rape between 2007 and 2010), Popescu and Pennacchiotti [13] proposed a decision-tree classifier and a set of features such as discourse parts, the presence of words from opinion or controversial lexicons, and user interactions (retweet and reply). Balasubramanyan et al. [2] extended the supervised LDA model to predict how members of a different political communities will emotionally respond to the same news story. Support vector classifiers and logistic regression classifiers have also been proposed in [21, 22] to detect disputes in Wikipedia page discussions. For example in the case of the com-ments that surround the modifications of Wikipedia pages. Other works have also exploited Wikipedia to detect and to identify con-troversial topics on the web [4, 9, 10]. Dori-Hacohen and Allan in [4] and Jang and Allan in [9] proposed to align web pages to Wikipedia pages on the assumption that a page deals with a controversial topic if the Wikipedia page describing this topic is itself controversial. The controversial or non-controversial nature of a Wikipedia page is automatically detected based on the metadata and discussions associated with the page. Jang et al. [10] constructed a controversial topics language model learned from Wikipedia articles and then used to identify if a web page is controversial.
Detection of controversies in social networks was also discussed without supervision based on interactions between different users [5]. Garimella et al. [5] proposed alternative measurement approaches based on the network, such as the random walk and the between-ness centrality and the low-dimensional embeddings. The authors tested simple content-based methods and noted their inefficiency compared to user graph-based methods. Other studies try to de-tect controversies on specific domains, for example in news [18] or in debate analysis [15]. However, to the best of our knowledge, none of the state-of-the-art works attempt to estimate, explicitly and concretely, the intensity of the contradiction or controversy. In this paper, unlike previous work, rather than only identifying controversy in a single hand-picked topic (e.g., aspect related to political news), we focus also on estimating the intensity of contra-dictory opinions around specific topics. We propose to measure the contradiction intensity using some features (e.g. rating, polarity).
3
CONTRADICTION INTENSITY LEVEL
Our approach is based on both detection of aspects within reviews as well as sentiment analysis of these aspects. In addition to the contradiction detection, our goal is to predict intensity level of the contradiction using some features. These features are related to rating and polarity of reviews-aspect (text around a given aspect).
3.1
Pre-processing
Two pre-processing steps are required: 1) extracting aspects from the reviews; and 2) sentiment analysis of the text around the aspects. 3.1.1 Extraction of Aspects. In our study, an aspect is a fre-quently occurring nominal entity in reviews and it is surrounded by emotional terms. In order to extract the aspects from the re-views’ text, we were inspired by the work of Poria et al., [14]. This method corresponds to our experimental data (coursera reviews). Additionally, the following treatments are applied:
(1) Term frequency calculation of the reviews corpus, (2) Part-of-speech tagging of reviews using Stanford Parser1, (3) Selection of terms having nominal category (NN, NNS)2, (4) Selection of nouns with emotional terms in their 5-neighborhoods
(using SentiWordNet3dictionary),
(5) Extraction of the most frequent (used) terms in the corpus among those selected in the previous step. These terms will be considered as aspects.
3.1.2 Sentiment Analysis. The sentiment of the review on aspect (review-aspect) is estimated using SentiNeuron4, an unsupervised model proposed by Radford et al. [17] to detect sentiment signals in reviews. The model consisted of a single layer multiplicative long short-term memory (mLSTM) cell and when trained for sentiment analysis it achieved state of the art on the movie review dataset5. They also found a unit in the mLSTM that directly corresponds to the sentiment of the output.
3.2
Dataset
To the best of our knowledge, there is no standard data set to evaluate the contradiction intensity. Therefore, 73,873 reviews and their ratings of 2244 English courses are extracted between October 10-14, 2016 from coursera via its API6and web pages parsing.
Table 1 presents some aspects among 22 useful aspects captured automatically from the reviews. To obtain contradiction and senti-ment judgesenti-ments for a given aspect: a) 3 users were asked to assess the sentiment class for each review-aspect; b) 3 other users assessed the degree of contradiction between reviews-aspect. In total, 66104 reviews-aspect of 1100 courses i.e. 50 courses for each aspect are judged manually for 22 aspects. To evaluate sentiments and con-tradictions in the reviews-aspect of each course, 3-points scale are used for sentiments: Negative, Neutral, Positive; and 5-points scale for contradictions: Not Contradictory, Very Low, Low, Strong and Very Strong. We computed the agreement degree between assessors for each aspect using Kappa Cohen measure k. The k is 0.76 for sentiment assessors and k is 0.68 for contradiction assessors, which corresponds to a substantial agreement.
1http://nlp.stanford.edu:8080/parser/ 2https://cs.nyu.edu/grishman/jet/guide/PennPOS.html 3http://sentiwordnet.isti.cnr.it/ 4https://github.com/openai/generating-reviews-discovering-sentiment 5https://www.cs.cornell.edu/people/pabo/movie-review-data/ 6https://building.coursera.org/app-platform/catalog
Table 1: Statistics on an example of aspects "Speaker"
Aspect #Rat1 #Rat2 #Rat3 #Rat4 #Rat5 #NegRev #PosRev #Review #Course Speaker 880 895 1705 3380 8205 2525 7480 9415 1035
In the following sections, we conducted a series of experiments in a supervised environment, using machine learning algorithms with the set of effective features identified in table 2. The aim is twofold: on the one hand we wondered whether the attribute selec-tion really determines the most effective features for detecselec-tion of contradiction intensity. On the other hand, we intended to measure the performance of some learning algorithms in our task, taking into account only the selected features.
3.3
Identifying the Most Effective Features
In this study, we relied on attributes selection algorithms to de-termine the most important features for contradiction intensity prediction task. Feature selection Algorithms [6] aim to identify and eliminate as much irrelevant and redundant information as possible. We used Weka7for this experiment. It is a powerful open-source Java-based learning tool that brings together a large number of learning machines and algorithms for selecting attributes.
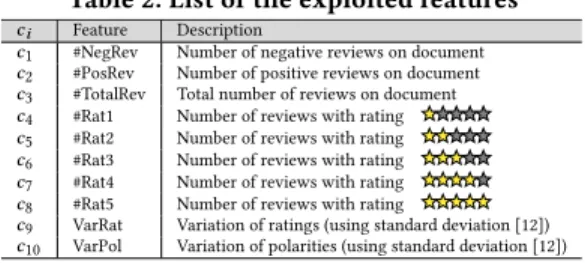
Table 2: List of the exploited features
ci Feature Description
c1 #NegRev Number of negative reviews on document c2 #PosRev Number of positive reviews on document c3 #TotalRev Total number of reviews on document c4 #Rat1 Number of reviews with rating c5 #Rat2 Number of reviews with rating c6 #Rat3 Number of reviews with rating c7 #Rat4 Number of reviews with rating c8 #Rat5 Number of reviews with rating
c9 VarRat Variation of ratings (using standard deviation [12]) c10 VarPol Variation of polarities (using standard deviation [12])
We proceeded as follows: 50 courses with their reviews for each aspects (22 aspects) from the coursera dataset were extracted ran-domly. Then, we considered the 4-points scale as intensity contra-diction classes around a specific aspect: Very Low, Low, Strong and Very Strong, according to the assessors’ judgments. The resulting set contains 1100 courses (instances) distributed as follows:
•230 Very Low • 264 Low • 330 Strong • 276 Very Strong We observed that this collection has an unbalanced intensity classes distribution. This occurs when there are much more ele-ments in one class than in the other class of a training collection. In this case, a classifier usually tends to predict samples from the majority class and completely ignore the minority class. For this reason, we applied an approach to sub-sampling (reducing the num-ber of samples that have the majority class) to generate a balanced collection composed of:
•230 Very Low • 230 Low • 230 Strong • 230 Very Strong The classes Low, Strong and Very Strong were selected randomly. Finally, we applied the attributes selection algorithms on the four sets obtained, for 5 iterations of cross-validation.
Attributes selection algorithms are to give a score to each fea-ture based on its significance towards contradiction intensity class (Very Low, Low, Strong and Very Strong). These algorithms oper-ate differently, some return an importance ranking of attributes (e.g., FilteredAttributeEval), while others return the number of times that a given attribute has been selected by an algorithm in a cross-validation (e.g., FilteredSubsetEval). We note that we have used for each algorithm the default setting provided by Weka.
7http://www.cs.waikato.ac.nz/ml
We applied 5-fold cross-validation for 10 criteria i.e. n = 10. Table 3 shows the features selected through attribute selection algorithms. We used two types of these algorithms: a) those using ranking methods to order the selected criteria (metric in the table is [Rank]); and b) those using search methods that indicate how many times the criterion has been selected during the cross-validation task (metric in the table is [#Folds]). A feature strongly preferred by the selection algorithm is a well-ranked feature i.e. Rank= 1 and strongly selected i.e. #Folds= 5.
Table 3: Selected features by attribute selection algorithms
Algorithm Metric c1 c2 c3 c4 c5 c6 c7 c8 c9 c10 CfsSubsetEval [#Folds] 5 5 2 0 0 0 0 0 5 5 WrapperSubsetEval [#Folds] 4 4 4 2 0 0 0 2 5 5 ConsistencySubsetEval [#Folds] 5 5 4 2 1 1 2 2 5 5 FilteredSubsetEval [#Folds] 5 5 4 3 2 2 3 3 5 5 Average 4.75 4.75 3.5 1.75 0.75 0.75 1.25 1.75 5 5 ChiSquaredAttributeEval [Rank] 3 4 5 7 9 10 8 6 2 1 FilteredAttributeEval [Rank] 4 3 5 7 9 10 8 6 2 1 GainRatioAttributeEval [Rank] 3 4 5 7 9 10 8 6 2 1 InfoGainAttributeEval [Rank] 3 4 5 7 9 10 8 6 1 2 OneRAttributeEval [Rank] 4 3 5 7 9 10 8 6 2 1 ReliefFAttributeEval [Rank] 4 3 6 8 9 10 7 5 1 2 SVMAttributeEval [Rank] 4 3 5 7 9 10 8 6 2 1 SymetricalUncertEval [Rank] 3 4 5 7 9 10 8 6 2 1 Average 3.5 3.5 5.12 7.12 9 10 7.87 5.87 1.75 1.25
Table 3 shows that the features c10: VarPol, c9: VarRat, c1: #NegRev
and c2: #PosRev are the most selected and highly ranked comparing
to other features. Features c3: #TotalRev, c4: #Rat1 and c8: #Rat5 are
moderately favored by the attributes selection algorithms, except the algorithm CfsSubsetEval that do not selected c4and c8. Features
c5, c6and c7are not selected both by the algorithms
CfsSubsetE-val and WrapperSubsetECfsSubsetE-val. Finally, the most weakest and most disadvantaged features are c5: #Rat2 and c6: #Rat3, ranked 9 and 10.
3.4
Learning Features for Predicting Intensity
Other experiments were carried out exploiting these features in supervised approaches based on learning models. We used the in-stances (courses) of the 22 aspects from coursera.org dataset as training sets. We then used three learning algorithms, this choice being explained by the fact that they often showed their effective-ness in text analysis tasks: SVM [20], J48 (C4.5 implementation) [16] and Naive Bayes [23]. The input of each algorithm is a vector of the features (see table 2), either all the features or just the features se-lected by a precise selection algorithm. Learning algorithms predict the contradiction intensity class for courses (Very Low, Low, Strong and Very Strong). Finally, we applied a 5-fold cross validation.
Attributes selection algorithms has highlighted 3 sets of features: Table 4: Selected features sets
Algorithm Features CfsSubsetEval c1,c2,c3,c9,c10 WrapperSubsetEval c1,c2,c3,c4,c8,c9,c10 Other algorithms c1,c2,c3,c4,c5,c6,c7,c8,c9,c10
The question at this stage is related to the specification of the input features vector for the learning algorithms, either we take all the features, or we keep only those selected by the algorithms (in this case, with which learning algorithms will these be combined). Hall and Holmes [6] studied the effectiveness of some attribute se-lection algorithms by confronting them with learning models. Since the performance of the features differs from one learning model to another, they have identified the best attribute selection techniques to find the best performing features according to the learning tech-niques to be used. Based on their study, we used the same pairs of learning techniques and attribute selection techniques:
•Features selected by CfsSubsetEval (CFS) and WrapperSub-setEval (WRP) are learned using Naive Bayes.
•Features selected by ReliefFAttributeEval (RLF) are learned using J48 (C4.5 implementation).
•Features selected by SVMAttributeEval (SVM) are learned using multi-class SVM (SMO function on Weka).
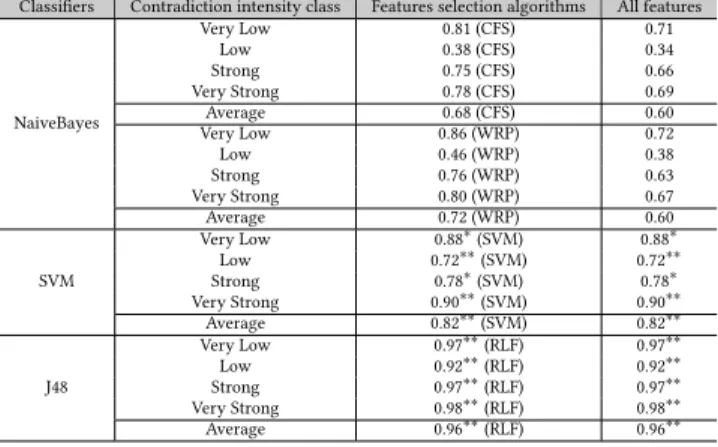
Table 5: Precision results for Machine learning techniques
Classifiers Contradiction intensity class Features selection algorithms All features
NaiveBayes Very Low 0.81 (CFS) 0.71 Low 0.38 (CFS) 0.34 Strong 0.75 (CFS) 0.66 Very Strong 0.78 (CFS) 0.69 Average 0.68 (CFS) 0.60 Very Low 0.86 (WRP) 0.72 Low 0.46 (WRP) 0.38 Strong 0.76 (WRP) 0.63 Very Strong 0.80 (WRP) 0.67 Average 0.72 (WRP) 0.60 SVM Very Low 0.88∗ (SVM) 0.88∗ Low 0.72∗∗ (SVM) 0.72∗∗ Strong 0.78∗ (SVM) 0.78∗ Very Strong 0.90∗∗ (SVM) 0.90∗∗ Average 0.82∗∗ (SVM) 0.82∗∗ J48 Very Low 0.97∗∗ (RLF) 0.97∗∗ Low 0.92∗∗ (RLF) 0.92∗∗ Strong 0.97∗∗ (RLF) 0.97∗∗ Very Strong 0.98∗∗ (RLF) 0.98∗∗ Average 0.96∗∗ (RLF) 0.96∗∗
In order to check the significance of the results compared to NaiveBayes results (considered as baseline), we conducted the Stu-dent’s t-test. We attached * (strong significance) and ** (very strong significance) to the results in table 5 when value<0.05 and p-value<0.01, respectively. The results are discussed in the following. a) NaiveBayes. The results in terms of precision obtained using CFS and WRP selection algorithms with NaiveBayes, are 0.68 and 0.72, respectively. These results exceed those obtained using all the features (precision: 0.60). Consequently, machine learning ap-proaches have better efficiency (precision) with attribute selection approaches. The highest precision are obtained for the classes Very Strong, Strong and Very Low. It seems that the class Low is hard to predict with NaiveBayes using both CFS (0.38) and WRP (0.46). b) SVM. The results obtained by SVM using SVMAttributeEval algorithm, where all features are selected, are better compared to those obtained by NaiveBayes. We recorded an improvement rates of 21% and 14% for NaiveBayes using CFS and WRP, respectively. We also noticed that SVM was able to predict the class Low with a better precision than that provided by NaiveBayes.
c) J48. The results confirm that the J48 decision tree is the most appropriate model, it takes into consideration all the features, the improvement rates compared to NaiveBayes (using CFS and WRP) and SVM are 41%, 33% and 17%, respectively. In addition, the im-provements are also strongly significant for each class compared to SVM and NaiveBayes. The class Low, which is difficult to pre-dict with previous configurations, is prepre-dicted with a precision of 92%. Compared to NaiveBayes (using CFS and WRP) and SVM, the improvements recorded are 142%, 100% and 28%, respectively.
Finally, all these experiments clearly show that the proposed approach allows to detect significantly the contradiction intensity in reviews. These improvements show the interest of combining attributes selection algorithms with learning models. We conclude that the resources (courses) having more diversifying opinions (positives and negatives reviews), are likely to have contradictions with different levels of intensity.
4
CONCLUSION
This paper proposes a supervised approach exploiting a set of fea-tures for predicting contradiction intensity, drawing attention to aspects in which users have contradictory opinions. The intuition behind the proposed approach is that ratings and sentiments asso-ciated to reviews on a specific aspect can be considered as features to measure contradiction intensity, while the sentiments and rat-ings diversity is high (standard deviation), than the contradiction should be high. Experimental evaluation conducted on coursera.org dataset shows that the features #NegRev, #PosRev, VarRat and VarPol are the most fruitful to predict contradiction intensity. Moreover, learning algorithms based on the most relevant features according to attributes selection algorithms are generally better compared to those obtained when the attributes selection algorithms are ig-nored. J48 algorithm brings the best improvement compared to NaiveBayes and SVM. Finally, we note that we are aware that the evaluation of our approach to contradiction intensity is still lim-ited. The major weakness of our approach is its dependence on the quality of sentiment and aspect models. Even with these simple elements, the first results encourage us to invest more in this track.
REFERENCES
[1] I. Badache and M. Boughanem. Harnessing Social Signals to Enhance a Search. In ACM/IEEE WIC, pages 303–309, 2014.
[2] R. Balasubramanyan, W.W. Cohen, D. Pierce, and D.P. Redlawsk. Modeling polarizing topics: When do different political communities respond differently to the same news? In ICWSM, pages 18–25, 2012.
[3] M-C. De Marneffe, A. Rafferty, and C. Manning. Finding contradictions in text. In ACL, volume 8, pages 1039–1047, 2008.
[4] S. Dori-Hacohen and J. Allan. Automated controversy detection on the web. In ECIR, pages 423–434, 2015.
[5] K. Garimella, G. D. F. Morales, A. Gionis, and M. Mathioudakis. Quantifying controversy in social media. In WSDM, pages 33–42, 2016.
[6] M. A. Hall and G. Holmes. Benchmarking attribute selection techniques for discrete class data mining. Trans. on Knowl. and Data Eng., 15(6):1437–1447, 2003. [7] S. Harabagiu, A. Hickl, and F. Lacatusu. Negation, contrast and contradiction in
text processing. In AAAI, volume 6, pages 755–762, 2006.
[8] A. Hassan, A. Abu-Jbara, and D. Radev. Detecting subgroups in online discussions by modeling positive and negative relations among participants. In EMNLP, 2012. [9] M. Jang and J. Allan. Improving automated controversy detection on the web. In
SIGIR, pages 865–868, 2016.
[10] M. Jang, J. Foley, S. Dori-Hacohen, and J. Allan. Probabilistic approaches to controversy detection. In CIKM, pages 2069–2072, 2016.
[11] A. Mukherjee and B. Liu. Mining contentions from discussions and debates. In KDD, pages 841–849, 2012.
[12] E.S. Pearson and M.A. Stephens. The ratio of range to standard deviation in the same normal sample. Biometrika, 51(3/4):484–487, 1964.
[13] A.M. Popescu and M. Pennacchiotti. Detecting controversial events from twitter. In CIKM, pages 1873–1876, 2010.
[14] S. Poria, E. Cambria, L. Ku, C. Gui, and A. Gelbukh. A rule-based approach to aspect extraction from product reviews. In SocialNLP, 2014.
[15] M. Qiu, L. Yang, and J. Jiang. Modeling interaction features for debate side clustering. In CIKM, pages 873–878, 2013.
[16] J. R. Quinlan. C4. 5: programs for machine learning. Elsevier, 2014.
[17] A. Radford, R. Józefowicz, and I. Sutskever. Learning to generate reviews and discovering sentiment. CoRR, abs/1704.01444, 2017.
[18] M. Tsytsarau, T. Palpanas, and M. Castellanos. Dynamics of news events and social media reaction. In KDD, 2014.
[19] M. Tsytsarau, T. Palpanas, and K. Denecke. Scalable detection of sentiment-based contradictions. DiversiWeb, WWW, 2011.
[20] J. Vosecky, K. W. T. Leung, and W. Ng. Searching for quality microblog posts: Filtering and ranking based on content analysis and implicit links. In DASFAA (1), pages 397–413, 2012.
[21] L. Wang and C. Cardie. A Piece of My Mind: A Sentiment Analysis Approach for Online Dispute Detection. In ACL, pages 693–699, 2014.
[22] L. Wang, H. Raghavan, C. Cardie, and V. Castelli. Query-focused opinion sum-marization for user-generated content. In COLING, pages 1660–1669, 2014. [23] Q. Yuan, G. Cong, and N. M. Thalmann. Enhancing naive bayes with various