HAL Id: tel-03005975
https://tel.archives-ouvertes.fr/tel-03005975
Submitted on 15 Nov 2020HAL is a multi-disciplinary open access archive for the deposit and dissemination of sci-entific research documents, whether they are pub-lished or not. The documents may come from teaching and research institutions in France or abroad, or from public or private research centers.
L’archive ouverte pluridisciplinaire HAL, est destinée au dépôt et à la diffusion de documents scientifiques de niveau recherche, publiés ou non, émanant des établissements d’enseignement et de recherche français ou étrangers, des laboratoires publics ou privés.
microbiota composition
Xufei Zhang
To cite this version:
Xufei Zhang. The role of dietary sugars in intestinal homeostasis and microbiota composition. Food and Nutrition. Sorbonne Université, 2018. English. �NNT : 2018SORUS441�. �tel-03005975�
Sorbonne Université
Ecole doctorale 394: Physiologie, Physiopathologie et Therapeutique
INRA Jouy-en-Josas, Institut MICALIS, Equipe AMIPEM
The role of dietary sugars in intestinal
homeostasis and microbiota composition
Par ZHANG XUFEI
Thèse de doctorat
Encadrée par Douard Véronique
Directeur de thèse Hervé Blottière
Présentée et soutenue publiquement le 13 novembre 2018
Devant le jury composé de :
Pr. SERRADAS Patricia Présidente
Dr.
BLACHIER François Rapporteur
Dr. LE GALL Maude Rapporteuse
Dr. LE DREAN Gwenola Examinatrice
Dr. BLOTTIERE Hervé Directeur de Thèse
3
For the past few years at INRA Jouy-en-Josas center, wonderful experiences gave me lots of reasons to be grateful for. All the people I met in INRA institute as well as the doctoral school show their great welcome with opened arms and made my PhD life more colorful.
First and foremost, I want to give many thanks to my PhD supervisor Véronique Douard. It is a great honor to be her first PhD student. She has taught me consciously or unconsciously how to be a good and real researcher. Her rigor attitude and enthusiasm towards academic research is deeply infecting me. I really appreciate all her encouragements, her contributions of time and ideas, her helpful suggestions to make me learn a lot about the exciting knowledge of nutrition and physiology. I am also very grateful to have such an excellent example as a woman scientist to guide me.
I truly express my gratitude to all my thesis committee members for their precious comments on my thesis manuscript. I greatly appreciate that professor Patricia Serradas agreed to be the president, Francois Blachier and Maude Le Gall agreed to be the rapporteurs, and Gwenola Le Drean agreed to be the examinatrice of my thesis defense.
I would like to warmly thank my thesis director Hervé Blottière and my thesis co-supervisor Christine Heberden for not only their excellent scientific suggestions which were very important to improve my scientific work but also their kind help and suggestions on administration affairs.
I greatly appreciate the kind help of the director of INRA Micalis Stéphane Aymerich. I would like to thank him for his assistance during the process of changing the new supervisor and a new project in the end of the first year of my thesis, and the extension of my PhD funding.
I also extend my great thanks to our collaborators, Sandrine Ellero-Simatos, Alexandra Grosfeld, Chloé Melchior and Guillaume Gourcerol. I greatly express my appreciation for their kind helps and supports, including excellent technical works, scientific advices, and discussions of the progress.
4
Grateful thanks to all the members of my mid-term committee: Muriel Thomas, Philippe Langella, Marion Leclerc for their pertinent scientific advices and endorsement to continue my thesis project.
Many thanks to all the members of our team AMIPEM. You all are really nice and lovely. Especially, thanks to our team director Philippe Gerard for his scientific suggestions for my thesis project. Particular thanks to our super technician Fabienne Devime for her friendly assistance and support of technical tasks. Great thanks to Catherine Philippe for her kind help in conducting HPLC. Many thanks to Sylvie Rabot, Valérie Daugé, Laurent Naudon, Elise Maximin, Magali Monnoye, Hayatte Dounia Mir and Sebastian Burz for all their help and support during my thesis time here.
I am very grateful for the scientific suggestions of Nicolas Lapaque, the technical support of Fabienne Béguet-Crespel, Anthony Dobez and Julie Cadiou, the scientific discussions and technical suggestions of Ludovica and Camille in Team FInE. Special thanks to Unai and Lucas for their support to organize Doc Micalis with me and their kind friendship. Thank my friend Tiphany in VIM for her kindness and suggestions for both science and life in France.
I would like to express my extreme gratitude to the Chinese Scholarship Council (CSC) for the financial support of such a precious study opportunity in France.
Particular thanks to Mme ZHAO Jingmei and Mr. WANG Chunqiao of the Education Department of Chinese Embassy in France for their kind help in the administration process during the time of my PhD.
To all my good friends, especially the friends from Association des boursiers CSC en Ile-de France (ABCF), I am so lucky to meet and have all of you here in Paris. Thanks all of you to give me the strength and support when I needed it.
Last but not the least, I would like to express my great thanks to my family, mum, dad and my little brother, my sister in law, my little lovely nephew, and my best friends of your love and support. No matter what happened and whenever I need you, you are always on my side to support me. I think “Thank you” is never enough to show my love to you all.
5
ABBREVIATIONS
ABCB1 ATP-binding cassette B1
AICAR 5-aminoimidazole-4-carboxamide 1β-D-ribonucleoside
AJs Adherent junctions
AMP Adenosine monophosphate
AMPK AMP-activated protein kinase
ARC Arcuate nucleus
Arx Aristaless related homeobox
Atoh1/Math1 Atonal homologue 1
BBM Brush border membrane
CaSR Ca2+ sensing receptor
CCK Cholecystokinin
CCK1R Cholecystokinin receptor 1
CCK2R Cholecystokinin receptor 2
CNS Central nervous system
EECs Enteroendocrine cells
FFAR2 Free fatty acid receptor 2
FFAR3 Free fatty acid receptor 3
FFAR4 Free fatty acid receptor 4
ENS Enteric nervous system
EGCs Enteric glial cells
FXR Farnesoid X receptor
FOXA1/2 The winged helix factors 1/2
FITC Fluorescein isothiocyanate
GCG Pre-proglucagon
GFAP Glial fibrillary acidic protein
GF Germ-free
GFP Green fluorescent protein
GI Gastrointestinal
GIP Glucose-dependent insulinotropic peptide
6
GLUT2 Glucose transporter 2
GLUT5 Glucose transporter 5
GLUT5-/- GLUT5 knockout
GPCR G-protein coupled receptor
GPR40 G-protein coupled receptor 40
GPR41 G-protein coupled receptor 41
GPR120 G-protein coupled receptor 120
GPR93 G-protein-coupled receptor 93
HDL High-density lipoproteins
HES1 Hairy/enhancer fo split
HFCS High fructose corn syrup
HFD High-fat diet
HRP Horseradish peroxidase
IBD Inflammatory bowel disease
IBS Irritable bowel disease
IECs Intestinal epithelium cells
IFNγ Interferon gamma
IL13 Interleukin 13
IL1β Interleukin 1 beta
ILDR1 Immunoglobulin-like domain containing receptor 1
LPS Lipopolysaccharides
JAMs Junctional adhesion molecules
KHK Ketohexokinase or fructokinase
KHK-/- KHK knockout
Klf4 Kruppel-like factor 4
M Microfold
MAGUK Membrane Associated Guanylate Kinase Homologs
MetaHit Metagenomics of human intestinal tract
MLC Myosin light chain
MLCK Myosin light chain kinase
NAFLD Non-alcoholic fatty liver disease
NEFAs Non-esterified fatty acids
7
NHE3 Na+/H+ exchanger
NMDA NR2B-containing N-methyl-d-aspartate
NTS Neurotensin
NTSRs Neurotensin receptors
Oxo-FAs Oxo-fatty acids
Pax4 Paired box 4
Pax6 Paired box 6
PEG Polyethylene glycol
POMC Proopiomelanocortin
Pou2f3 Pou domain, class2, transcription factor 3
PYY Peptide YY
RYGB Roux-en-Y gastric bypass
SBS Short bowel syndrome
SCFAs Short-chain fatty acids
SCT Secretin
SGLT1 Sodium glucose cotransport protein
Sox9 Sry-box 9
SREBP1 Sterol response element binding protein
T2R14 Taste 2 receptor member 14
T1R2/3 Taste receptor type 2 or type 3
T2D Type 2 diabetes
TEER Transepithelial electrical resistance
TGR5 G protein-coupled bile acid receptor
TJs Tight junctions
TLR4 Toll-like receptor 4
TNFα Tumor necrosis factor alpha
TRPA1 Transient receptor potential ankyrin 1
UC Ulcerative colitis
VLDL Very-low-density lipoproteins
WT Wild type
ZO Zonula Occludens
9
INTRODUCTION ... 15
I-Structures and functions of the gastrointestinal tract ... 17
I-1 Structures of the intestinal epithelium ... 17
I-2 Cell populations of the intestinal epithelium ... 19
I-3 Intestinal epithelium renewal ... 21
II-Gut microbiota ... 23
II-1 General overview of the gut microbiota composition ... 23
II-2 The functions of the gut microbiota ... 25
II-3 The stability and dietary-dependent alterations of the microbiota composition ... 25
II-4 The microbial metabolites and components... 27
II-4.1 Short-chain fatty acids ... 27
II-4.2 Bile acids ... 29
II-4.3 Tryptophan metabolites ... 30
II-4.4 Lipopolysaccharides ... 31
II-5 The role of gut microbiota in metabolic diseases ... 31
III- Enteroendocrine functions of the gastrointestinal tract ... 35
III-1 The classification of enteroendocrine cells: from the old to a new dogma ... 35
III-2 Gut hormonal signaling pathways ... 39
III-3 The regulation of enterohormone secretion ... 40
III-3.1 The impact of fructose on the secretion of gut enterohormones ... 40
III-3.1.1 The intestinal endocrine response to acute fructose exposure ... 40
III-3.1.2 The intestinal endocrine response to chronic fructose exposure... 41
III-3.1.3 The potential sensor of fructose in enteroendocrine cells ... 41
III-3.2 The impact of change in the nutrient flow on enterohormone expression ... 42
III-3.3 The role of the gut microbiota and its metabolites on the regulation of enteroendocrine cells ... 43
III-4 Cholecystokinin: its regulation and main function ... 43
III-4.1 Transcript structure and derived molecular forms of cholecystokinin ... 43
III-4.2 Stimulation of cholecystokinin secretion ... 47
III-4.2.1 The fatty acids ... 47
10
III-4.2.3 Sweet and Bitter stimuli ... 49
III-4.2.4 Non-nutrient stimuli ... 49
III-4.3 Physiological effects of cholecystokinin ... 51
III-4.3.1 Food intake ... 51
III-4.3.2 Pancreatic secretion, gut motility and gallbladder contraction ... 52
III-4.3.3 Pain ... 52
III-4.3.4 The central action of cholecystokinin on various behavior processes ... 53
III-5 Regulation of the other gut peptides: Peptide YY, glucagon-like peptide-1, and neurotensin ... 53
III-5.1 Peptide YY ... 54
III-5.2 Glucagon-like peptide-1 ... 54
III-5.3 Neurotensin ... 54
IV- Gut permeability and its major role in metabolic disorders ... 57
IV-1 Gut permeability: definition and main components ... 57
IV-1.1 Transcellular permeability ... 57
IV-1.2 Paracellular permeability ... 59
IV-1.2.1 Tight junction proteins ... 59
IV-1.2.1.1 The claudin family ... 59
IV-1.2.1.2 Occludin ... 59
IV-1.2.1.3 The family of junctional adhesion molecules ... 60
IV-1.2.1.4 The family of zonula occludens ... 60
IV-1.2.2 The regulation of paracellular permeability ... 60
IV-2 The measurement of gut permeability ... 61
IV-2.1 In vivo permeability assays ... 63
IV-2.2 Ex vivo Ussing chamber system ... 63
IV-2.3 In vitro permeability measurements ... 65
IV-3 The effect of nutrients on gut permeability ... 65
IV-3.1 Lipids and chronic exposure to a high-fat diet ... 65
IV-3.2 Sugars ... 67
V-Enteric nervous system ... 69
V-1 The basic structure and functions of enteric nervous system ... 69
V-2 The regulation of enteric nervous system on intestinal barrier function ... 69
V-3 The inflammation induced modification in enteric nervous system ... 71
11
VI- Fructose consumption, transport and metabolism – health consequences of its excessive
consumption ... 75
VI-1 The pattern of fructose consumption ... 75
VI-2 Intestinal transport of fructose ... 77
VI-2.1 The main intestinal fructose transporters GLUT5 and GLUT2 ... 77
VI-2.2 Other potential transporters ... 79
VI-2.3 The regulation of GLUT5 in intestinal tissue ... 79
VI-2.4 Developmental Regulation of GLUT5 ... 80
VI-2.5 The regulation of GLUT5 by luminal fructose ... 81
VI-3 Ketohexokinase: the key enzyme in fructose metabolism ... 83
VI-4 Health outcome of excessive fructose intake ... 85
VI-4.1 Liver: the central target ... 85
VI-4.2 Fructose intake and functional alteration of other organs... 85
VI-5 Fructose malabsorption ... 86
OBJECTIVES ... 89
RESULTS ... 93
Fructose malabsorption - Ketohexokinase knockout mice model ... 95
Article1: Fructose malabsorption modifies the endocrine response of the lower intestine by Modulating microbiota composition and metabolism ... 97
Additional Results for Article 1 ... 143
Article2: Glucose but not fructose alters the intestinal paracellular permeability in association with inflammation in mice and Caco-2 cells ... 151
GENERAL DISCUSSION AND PERSPECTIVES ... 186
I-The potential physiological consequence of the increase in CCK in the lower intestine 186 II-The potential link between the increase in intestinal CCK and the symptoms associated with fructose malabsorption ... 188
III-Nature of the stimuli able to activate CCK in the lower intestine ... 190
IV-The role of the fructose-induced changes in the microbiota composition in the alteration of gastrointestinal endocrine and barrier functions ... 191
V-Impact of fructose on intestinal permeability in normo- and mal-absorptive fructose conditions ... 194
GENERAL CONCLUSION ... 199
12
LIST OF FIGURES
Figure 1. Adult mouse gastrointestinal tract structure ... 16
Figure 2. Schematic organization of the mucus layer in the gut of rats ... 18
Figure 3. Schematic representation of the crypt-villus unit in the small intestine ... 18
Figure 4. Transcription factors involved in the differentiation of the various intestinal cell types ... 20
Figure 5. Microbial taxonomy vs Microbiota composition of healthy population characterized by the metagenomics of human intestinal tract project (MetaHit) ... 24
Figure 6. Bacterial abundance and diversity within intestinal regions... 24
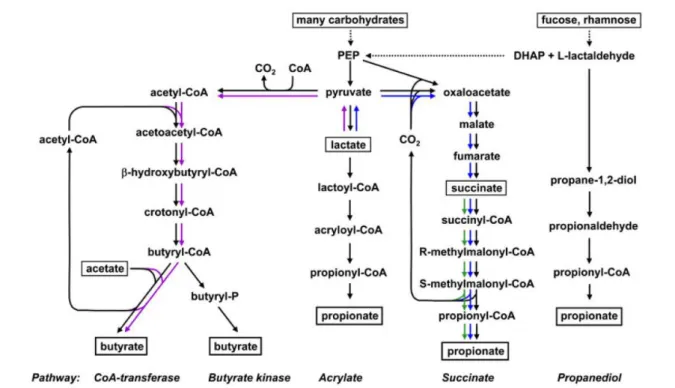
Figure 7. The bacterial metabolic pathways for butyrate and propionate synthesis ... 28
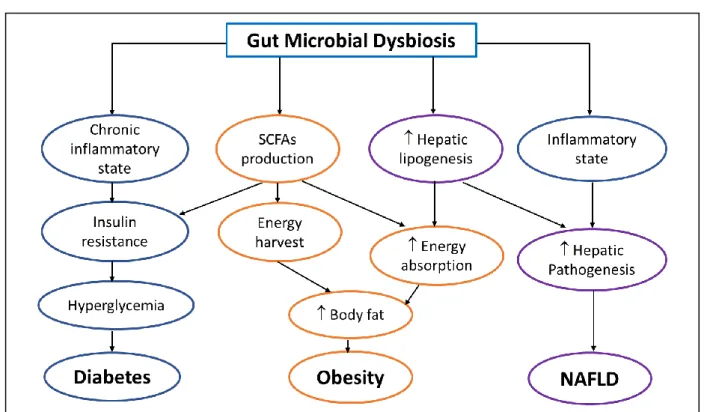
Figure 8. The role of gut microbiota in the onset and maintenance of metabolic diseases ... 32
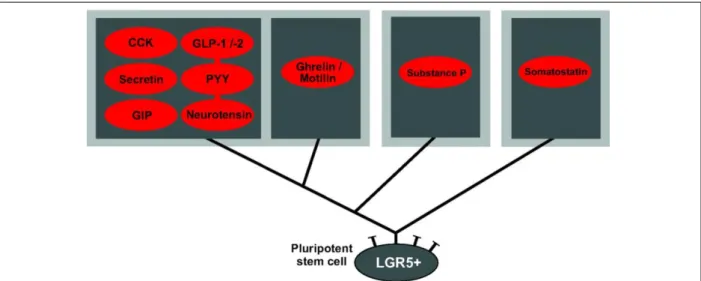
Figure 9. Schematic overview of proposed main enteroendocrine cell lineages of the small intestine ... 38
Figure 10. The four gut hormonal signaling pathways ... 38
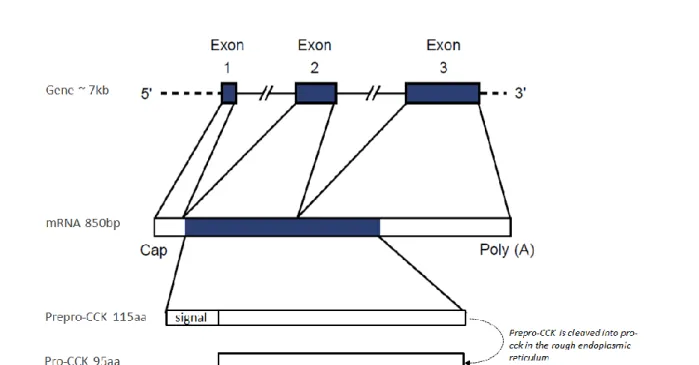
Figure 11. Overall structure of the cholecystokinin gene, mRNA, prepro-cholecystokinin and pro-cholecystokinin ... 44
Figure 12. Posttranscriptional processing of pro-cholecystokinin ... 46
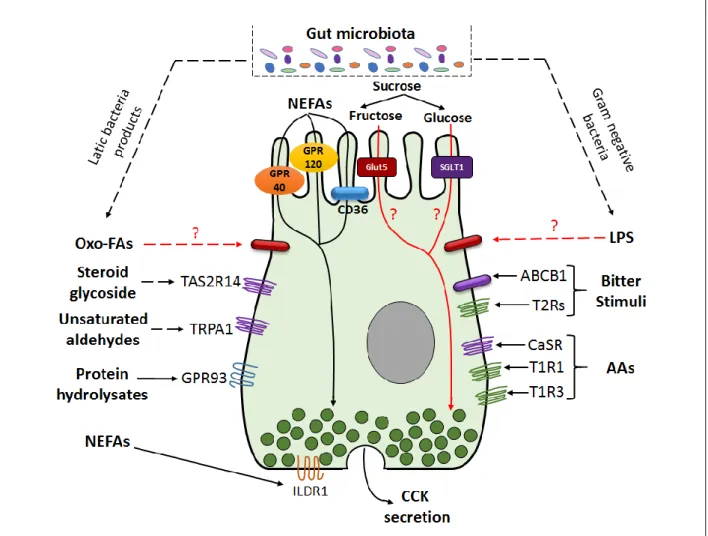
Figure 13. Schematic overview of activation of cholecystokinin by various stimuli ... 48
Figure 14. Physiological effects of cholecystokinin and the related receptors ... 50
Figure 15. Transcellular and Paracellular permeability pathways ... 56
Figure 16. The tight junction protein structures ... 58
Figure 17. The ex vivo Ussing chamber system ... 62
Figure 18. The possible pathways linking high fat consumption and gut permeability to metabolic endotoxemia and chronic diseases ... 64
Figure 19. The sugar effects on paracellular permeability ... 66
Figure 20. The structure overview of enteric nervous system ... 70
Figure 21. Fructose consumption in USA population and sugar consumption across the world between 2002 and 2012 ... 74
Figure 22. Intestinal transport of fructose and glucose ... 76
13
Figure 25. Ketohexokinase gene and construction of Ketohexokinase knockout vectors ... 94 Figure 26. Visceral pain measurement in Wild type and Ketohexokinase knockout mice .... 148 Figure 27. Paracellular permeability and relevant markers expression in jejunum and caecum of wild type and ketohexokinase mice ... 149 Figure 28. Plasmatic CCK and Central POMC gene expression in fructose fed wild type and Ketohexokinase knockout mice ... 188 Figure 29. Expression levels of gastrointestinal hormones in the caecum of conventionally raised and germ-free mice ... 191 Figure 30. Pathways involved in the modulation of paracellular permeability in response to glucose or fructose intake ... 197 Figure 31. Caecal gene expression level of glial fibrillary acidic protein in wild type and Ketohexokinase knockout mice fed fructose ... 197 Figure 32. Graphical summary of fructose impact on endocrine functions and microbiota composition in the lower intestine ... 198
LIST OF TABLES
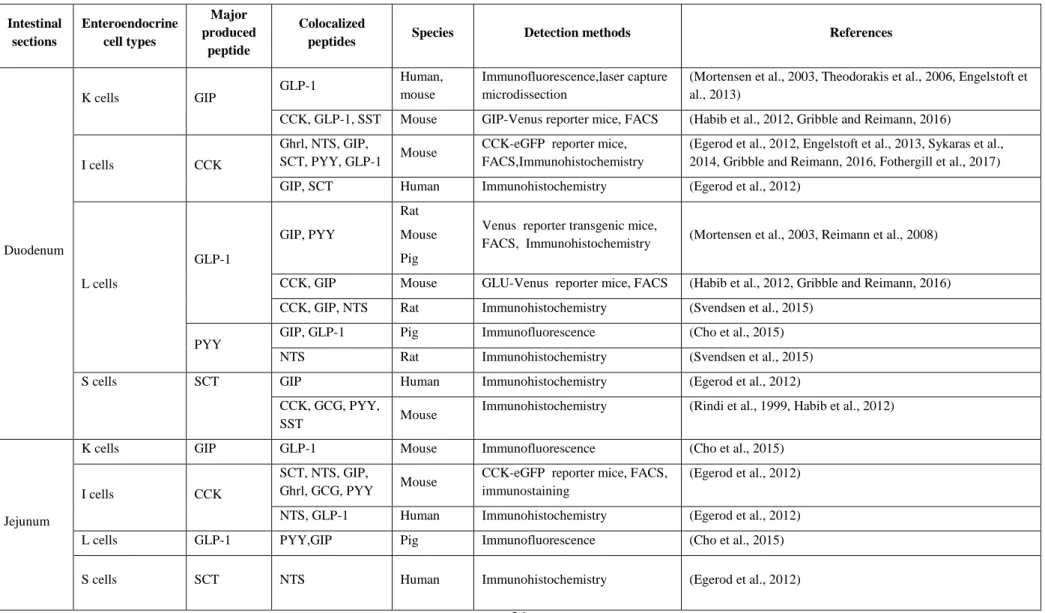
Table 1. The old dogma of localization and secretion of the enteroendocrine cells in the gastrointestinal tract ... 34 Table 2. Enteroendocrine cells and gut peptides colocalization along the gastrointestinal tract ... 36 Table 3. GLUT family proteins properties ... 78
16
17
I-Structures and functions of the gastrointestinal tract
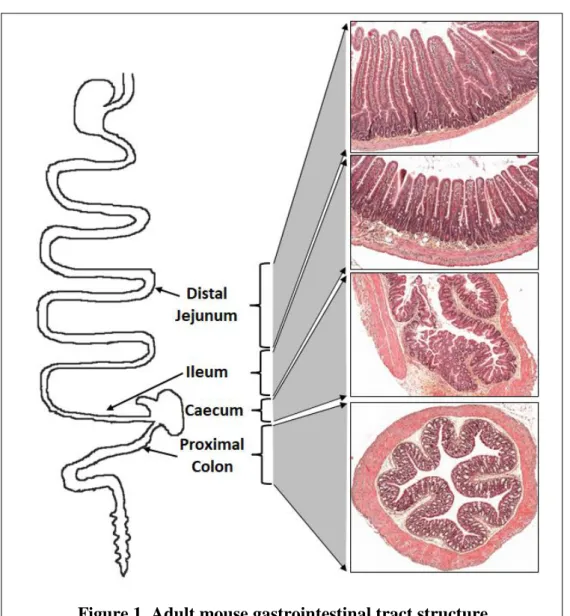
The gastrointestinal (GI) tract goes from the mouth to the anus. It is responsible for food digestion, nutrient absorption, gut-hormone secretion, and immune functions. It is also the first barrier for the protection of the internal milieu from the non-regulated passage of compounds and microorganisms originating from the luminal environment. This long tract can be subdivided into several specific regions that differ in terms of structure and function (Figure 1).
I-1 Structures of the intestinal epithelium
The upper GI tract is composed of the oral cavity, pharynx, esophagus, and stomach. After the pylorus, the GI tract consists of the small and large intestines, of which the small intestine (proximal intestine) is divided into the duodenum, jejunum, and ileum and the large intestine (distal intestine) into the caecum, colon, and rectum (Greenwood-Van Meerveld et al., 2017). Along most of the GI tract, the structure of the intestinal wall is composed of four layers, including, from the lumen outwards: the mucosa, submucosa, muscularis propria, and serosa (Aibe et al., 1986). Despite being composed of the same tissue layers from the mouth to the anus, the mucosal layer exhibits different features depending on the GI tract region. In the stomach, the mucosa folds into rugae (Krag, 1966). In the small intestine, the mucosa consists of crypt invaginations and circular folds, villi, and microvilli, which increase the absorptive surface area of the small intestine by more than 600-fold (Ferguson et al., 1978). In contrast, the colonic mucosa consists of simple flat epithelium with successive crypt invaginations (Ross, 1921, Baker et al., 2014). The caecum is less well-described, likely because it is prominent in mostly herbivorous species. It is located at the transition between the small and large intestine. Its structure is close to that observed in the colon with no prominent villi. However, the surface is less flat and crypt invaginations less deep.
The mucus layers also differ depending on the intestinal segment. Mucus is secreted continuously by goblet cells localized at the villi. The mucus in the colon is composed of an inner and outer mucus layer. The outer layer is loose (~4 times thicker than the inner layer), whereas the inner layer is firm and impermeable. In the colon, the inner layer
18
Figure 2. Schematic organization of the mucus layer in the gut of rats (Adapted from (Johansson et al., 2011))
In the small intestine, the mucus is composed of only one irregular layer. In contrast, the inner layer of the colon provides protection against the luminal bacteria, whereas the outer layer harbors the commensal bacteria represented by the red dots.
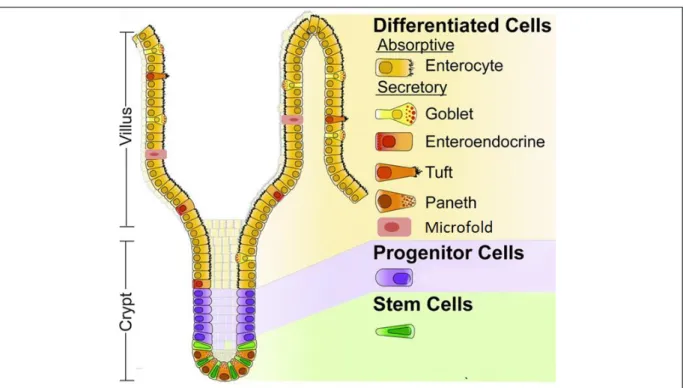
Figure 3. Schematic representation of the crypt-villus unit in the small intestine (Adapted from (Carulli et al., 2014))
The stem and progenitor cells are localized in the crypts. They differentiate into a number of cell types indicated in the right side of the figure as they are displaced from the crypt to the villi.
19
provides protection against the luminal bacteria, whereas the outer layer harbors the commensal bacteria (Johansson et al., 2008). In contrast, the mucus in the small intestine is composed of only one irregular layer (Johansson et al., 2011) (Figure 2). However, early descriptions of the mucus layer also described a thin firm layer in the small intestine (Atuma et al., 2001). Mucus consists of water (98%), mucins (~2%, which are high molecular weight (~500 kDa) glycoproteins) (Andrianifahanana et al., 2006), and other proteins, including immunoglobulins (Johansson et al., 2008).
I-2 Cell populations of the intestinal epithelium
The intestinal epithelium is composed of six types of differentiated epithelial cells (Figure 3): absorptive enterocytes, secretory Paneth cells, goblet cells, tuft cells, microfold (M) cells, and enteroendocrine cells (EECs). Enterocytes are the most abundant cells of the intestinal epithelium and are involved in absorption. In the small intestine, they absorb the nutrients degraded by digestive processes and are involved in the reabsorption of water and electrolytes, as well as the products of microbiota metabolism in the colon. Paneth cells are localized at the base of crypts in the small intestine, where they surround the stem cells (Sato et al., 2011). They secrete antimicrobial peptides, as well as growth factors for the defense against bacteria and signaling molecules for maintenance of the stem-cells (Ayabe et al., 2004, Sato et al., 2011). Goblet cells secrete the mucins that constitute the mucus layer. Their density increases from the duodenum to the colon (4 to 16% of the total epithelium respectively) parallel to the increase in the number of bacteria (Deplancke and Gaskins, 2001). Tuft cells represent less than 0.4% of the total epithelial cells and are involved in chemoreception and regulating type 2 immune responses associated with allergic conditions (Gerbe et al., 2012, Gerbe and Jay, 2016). M cells play a key role in mucosal immunity by transporting antigens from the lumen to cells of the immune system (Gebert et al., 1996). EECs are the hormone-producing cells of the intestine. They represent 1% of the intestinal epithelial cells and are expressed all along the GI tract and can be found in the crypts as well as in the villi. They have a broad spectrum of actions which are described in § III.
20
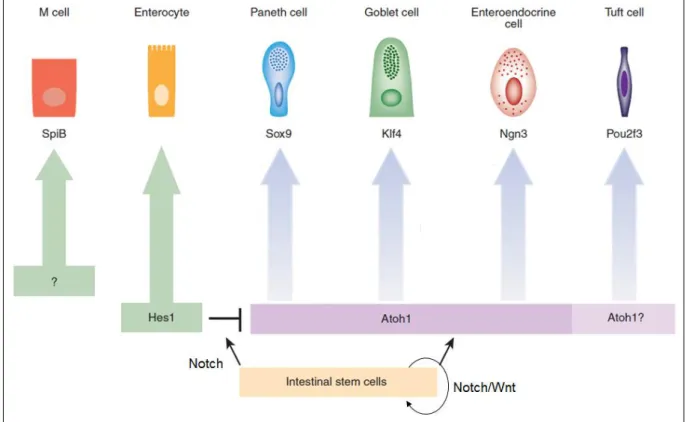
Figure 4. Transcription factors involved in the differentiation of the various intestinal cell types (Revised from (Gerbe and Jay, 2016))
M cell: Microfold cell; SpiB: Spi-B transcription factor; Sox9: sex determining region Y-box 9; Klf4: Kruppel-like factor 4; Ngn3: Neurogenin3; Pou2f3: POU domain, class 2, transcription factor 3 gene; Hes1: Hairy/enhancerofsplit1; Atoh1: Atonalhomologue1.
21
Overall, the epithelial cells of the intestine constitute a monolayer of polarized cells of which the basolateral side faces the lamina propria and the lateral surface is tightly linked with the neighboring cells through various junctions which will be described in § IV.
I-3 Intestinal epithelium renewal
The intestinal epithelium is in a state of constant renewal because of the proliferative and differentiation properties of the stem cells, which are found at the bottom of the crypts. It can be renewed within two to three days in rats and four to five days in humans (Moore and Lemischka, 2006). However, there are differences between the cell types and GI regions. For example, the life span of EECs is up to four months in the stomach, up to 60 days in the ileum and colon, and between six and 10 days in the duodenum (Lehy and Willems, 1976, Tsubouchi and Leblond, 1979, Thompson et al., 1990). The coordinated action of various transcription factors controls the specification and maintenance of the various intestinal epithelial cell types (Sato and Clevers, 2013) (Figure 4). First, the Wnt and Notch pathways allow maintenance of the undifferentiated state of the stem cells. In the lower part of the crypts, the stem cells undergo a rapid series of divisions that generate progenitors which migrate to the middle region of the crypt. Under the control of the Notch pathway, the progenitor cells specialize into either secretory precursors (which give rise to goblet, enteroendocrine, tuft, and Paneth cells) or absorptive precursors (which give rise to enterocytes) (Vooijs et al., 2011). This mechanism is mediated by hairy/enhancer of split (HES1), a major transcription factor for which the expression is initiated by the Notch pathway (Fre et al., 2005, Bar et al., 2008). Activation of the Notch/HES1 pathway promotes differentiation of the absorptive lineage and inhibits differentiation of the secretory lineage via the repression of the transcription factor Atonal homologue 1 (Atoh1 also named Math1). The Math1+-lineage differentiates into EECs under the control of Neurogenin 3 (Ngn3). Then, other transcription factors downstream of Ngn3, including neurogenic differentiation 1 (NeuroD1), the paired box 4 and 6 (PAX4 and PAX6), the winged helix factors 1/2 (FOXA 1/2), and Aristaless related homeobox (Arx) are responsible for the differentiation of various EEC subtypes (described in § III) (Schonhoff et al., 2004). The Sry-box 9 (Sox9) factor (Bastide et al., 2007) is required for Paneth cell differentiation and Kruppel-like factor 4 (Klf4) (Katz et al., 2002) for that of goblet cells. Pou domain, class 2, transcription factor 3 (Pou2f3) is the first transcription factor to be identified for tuft cell differentiation (Gerbe et al., 2016).
22
This extraordinary capacity for renewal confers remarkable plasticity of the intestinal epithelium in response to changes in the luminal environment (nutrients, microbiota metabolites, drugs).
23
II-Gut microbiota
II-1 General overview of the gut microbiota composition
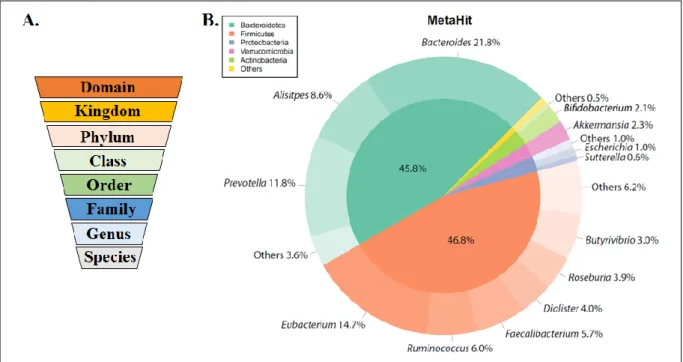
The gut microbiota is composed of a large and diverse community of ~1014 microorganisms that reside in the GI tract (Gill et al., 2006, Qin et al., 2010). Within this community the bacteria are the most abundant, but viruses, archaea, yeasts and fungi are also present (Gevers et al., 2012). Classical microbiology techniques allow the detection and characterisation of only 30% of the total bacteria present in the gut (Rajilic-Stojanovic and de Vos, 2014). Recently, the development of techniques based on the 16S RNA sequencing have allowed the identification of new bacteria and permit a better characterisation of the gut ecosystem species (Fraher et al., 2012). Although more than 1000 bacteria species have been identified within the whole intestinal microbiome, about 160 species are dominant and largely shared among individuals (Qin et al., 2010). Studies demonstrated that 18 bacterial species were present in most of the individuals and that 57 species were shared by 90% of specimens (Qin et al., 2010). Two major phyla of bacteria, Firmicutes and Bacteroidetes, are predominated in both human and mice intestine followed by Actinobacteria, Verrucomicrobia and Proteobacteria (Ley et al., 2005) (Figure 5). The dominant genera found in adult healthy human are
Bacteroides, Eubacterium, Ruminococcus, Clostridium and Bifidobacterium (Ley et al., 2005,
Qin et al., 2010). By comparing gut microbiota composition of large cohorts of human patients originating from different countries, the ecological “enterotype” concept emerged. According to this concept, human population could be divided into three major groups, or enterotypes: the type 1 is defined by dominance of Bacteroides, the type 2 by Prevotella and the type 3 by Ruminococcus (Arumugam et al., 2011, Wu et al., 2011, Costea et al., 2018). Despite this general profile, gut microbiota exhibits spatial differences at the genus level and beyond. The composition and density of the microorganisms vary throughout the digestive tract, due to variation of the pH, the redox potential, the substrates available and adhesion sites (e.g. mucus layer) (O'Hara and Shanahan, 2006). Thus, the bacterial density is about 101 -103 colony-forming unit/ml of luminal content in the duodenum, 104-107 in the jejunum and reaches 1010-1012 in the colon (Figure 6) (Sekirov et al., 2010, Sender et al., 2016). This increase in bacterial density also parallels an increase in density of anaerobic bacteria and a decrease in density of aerobic bacteria. For instance, predominant genus found in the stomach and the proximal small intestine is Streptococcus while Firmicutes and Bacteroidetes are the
24
Figure 5. Microbial taxonomy vs Microbiota composition of healthy population characterized by the metagenomics of human intestinal tract project (MetaHit)
(Adapted from (Arora and Backhed, 2016))
(A) The microbial taxonomy from domain to species. (B) The major phyla percentage of healthy human gut is indicated in the inner pie chart. The outer pie chart shows the respective genera proportions within the phyla.
Figure 6. Bacterial abundance and diversity within intestinal regions (Adapted from (Sekirov et al., 2010))
25
also varies between the lumen and the mucosal surface of the intestine. For example, the mucosal surface is enriched in Akkermansia muciniphila and other bacterial groups able to metabolize the mucins as energy source (Swidsinski et al., 2005, Beaumont et al., 2017).
II-2 The functions of the gut microbiota
The recent development of high throughput DNA sequencing allowed the sequencing and identification of the genes of bacteria present in the digestive ecosystem (metagenome). It was thus established that each microbiota encodes for 500 000 to 600 000 genes such as about 10 million genes are encoded in total by the human microbiota which is 150 times present in the human genome. The gut ecosystem performs various functions essential for host physiology and the maintenance of the host health. The cloning of large DNA fragments permitted the identification of the species responsible for specific physiological functions (Manichanh et al., 2006). These technical advances increased our knowledge of the microbiome and uncover its numerous functions in healthy conditions and its relationship with the development of pathologies. In healthy conditions, the gut microbiome is involved in carbohydrate and protein fermentations, the synthesis of vitamins (B12, K), the synthesis of short chain fatty acids (SCFAs), the secondary bile acids metabolism, as well as the synthesis of numerous components whose nature and functions remain unidentified (Gill et al., 2006, Rowland et al., 2018). The gut microbiota is also involved in the maturation of the immune system, the protection against pathogens and the maintenance of gut barrier integrity (Gordon and Bruckner-Kardoss, 1961, Banasaz et al., 2002).
II-3 The stability and dietary-dependent alterations of the microbiota composition
The gut is colonized by the bacteria at the time of birth either by the microorganisms originating from the maternal vagina (e.g. Lactobacillus and Prevotella) or from the skin (e.g
Streptococcus, Corynebacterium and Propionibacterium) depending on the type of delivery,
vaginal or caesarian, respectively. During the first years of life, the type of diet (breast milk or formula) (Donovan et al., 2012, Iozzo and Sanguinetti, 2018) together with exposure to antibiotics (Cox and Blaser, 2015) are the main factors influencing the evolution of the microbiota composition. The 3-4 years old children microbiota composition is already
26
stabilized and diversified and shares 40 to 60% similarity with the adult ecosystem. In healthy individuals, the predominant phyla and genera show relative stability during the course of the life (Greenhalgh et al., 2016). However as in infancy, diet is one of the main factors influencing the composition, diversity and richness of adulthood microbiota. First, dietary habits largely contribute to the establishment of enterotypes, with Bacteroides enterotype being mainly associated with animal protein, amino acid and fat consumption, Prevotella enterotype being related to high intake of carbohydrates while Ruminococus enterotype was not clearly defined towards any diet (Wu et al., 2011). However, this association of the enterotype with the dietary pattern remains controversial. Indeed, another study associated
Bacteroides enterotype with sugars fermentation and an elevated ability to synthesize the
vitamins B7, B2 and C (Arumugam et al., 2011). In the same study, Prevotella and
Ruminococcus enterotypes appear composed of a majority of species able to degrade the
mucins and Prevotella enterotype also showed an enrichment in genes encoding for synthesis of the vitamins B1 and B9.
Among the various food constituents, the fibers are the most effective macronutrients able to increase the richness and diversity of the gut microbiota. Diets enriched in fiber would specifically increase the abundance of bacteria belonging to the Firmicutes phylum able to metabolize polysaccharides (e.g. Ruminococcus bromii, Roseburia and Eubacterium). In contrast, high-fat diets (HFD) decrease the overall gut microbiota diversity and alter the microbiome composition by decreasing the relative abundance of Bacteroidetes and increasing abundance of Firmicute and Proteobacteria (Hildebrandt et al., 2009, Do et al., 2018). At the family level, HFD decrease Ruminococcaceae and increase Rikenellaceae as well as colonic sulfite-reducing bacteria abundance (Daniel et al., 2014, Shen et al., 2014, Araujo et al., 2017). When fat was associated with high levels of sucrose or high level of fructose in the diet, similar modifications of the microbiota were detected (decreased Bacteroidetes/Firmicutes ratio, and decreased diversity) (Parks et al., 2013, Carmody et al., 2015, Volynets et al., 2017). When not associated with HFD, exposure of rats to moderate ranges of glucose/fructose-sweetened beverages reduced the abundance of Prevotella and
Lachnospiraceae incertae sedis and increased Bacteroides, Alistipes, Lactobacillus, Clostridium sensu stricto, Bifidobacteriaceae, and Parasutterella (Noble et al., 2017). High
fructose diet also results in the increase in Enterobacteriaceae in rats (Jena et al., 2014). More recent findings also showed that high glucose or high fructose (65%) diets significantly reduced the microbiota diversity similarly to a HFD poor in sugar (20% carbohydrates) when
27
with an increase in Verrucomicrobia phylum when compared to the HFD poor in sugar or to the normal diet (Do et al., 2018). In the same study, when compared to glucose, fructose diet induced a lower decrease in the Bacteroidetes/Firmicutes ratio and a higher increase in the Deferribacteres phylum. Interestingly, non-caloric artificial sweeteners such as saccharin also modify gut microbiota composition by increasing the relative abundance of Bacteroides and reducing Lactobacillus reuteri (Suez et al., 2014). Importantly, those modifications are responsible for the development of glucose intolerance observed in response to non-caloric sweeteners intake (Suez et al., 2014).
II-4 The microbial metabolites and components
Changes in mcrobiota composition regulate the host physiology via the metabolites they produce such as SCFAs, bile acids, tryptopan metabolites, or other microbial components such as lipopolesaccharide (LPS).
II-4.1 Short-chain fatty acids
SCFAs are the main products of the fermentation of the non-digestible polysaccharides (e.g. fibers) by the microorganisms of the distal gut (Miller and Wolin, 1996, Flint et al., 2015). There are three major SCFAs: acetate, butyrate, and propionate (Cummings et al., 1987, Flint et al., 2015). Classical biochemistry techniques (Flint et al., 2015), phylogenetic analysis targeting specific bacterial functional genes of SCFA synthesis pathways (Louis et al., 2010, Reichardt et al., 2014) and metagenomic approaches (Vital et al., 2014, Vital et al., 2017) have clarified the pathways and some of the bacteria species involved in the SCFAs production (Figure 7). The majority of butyrate- and propionate-producing bacteria belong to families within the Firmicutes. Among the dominant bacterial species of the human microbiota, species belonging to the Lachnospiraceae family such as Roseburia inulinivorans,
Ruminococcus obeum or coprococcus catus are propionate producers while in the same
family Roseburia intestinalis and Clostridium symbiosum are butyrate producers (Reichardt et al., 2014). In addition, species from the Negativicutes family as well as Bacteroides species from the Bacteroidetes phylum are also major propionate producers (Reichardt et al., 2014).
Roseburia intestinalis, Eubacterium hallii as well as Faecalibacterium prausnitzii are part of
28
Figure 7. The bacterial metabolic pathways for butyrate and propionate synthesis (Adapted from (Flint et al., 2015)).
The purple arrows refer to bacteria that can utilize lactate to form butyrate; The blue arrows refer to bacteria that can utilize lactate to produce propionate; The green arrows refer to bacteria that can utilize succinate to produce proprionate. DHAP: dihydroxyacetonephosphate; PEP: phosphoenolpyruvate.
29
lactate can also contribute to the production of acetate, butyrate and propionate through a process implying cross-feeding between bacteria such as Bifidobacterium adolescentis and
Roseburia spp. (Bourriaud et al., 2005, Belenguer et al., 2006). In the caecum, the
interconversion between acetate and butyrate or between butyrate and propionate are also possible (den Besten et al., 2013). The SCFAs produced by the microbiota play a major role in the energy regulation of the host. Propionate and acetate are mainly transported into the portal blood while butyrate is mostly used as energy source by the colonocytes. Propionate can be used as a precursor for glucose synthesis by the peripheral organs while acetate and butyrate participate in the synthesis of cholesterol and fatty acid (den Besten et al., 2013). The utilization of butyrate by the colonocytes supports their proliferation and participates in the maintenance of the intestinal barrier integrity (Donohoe et al., 2012, Wang et al., 2012). Numerous signaling effects of SCFAs such as the regulation of glucose homeostasis, appetite and gut peptide secretion are mostly mediated via the free fatty acid receptors 2/3 (FFAR2/3 also named G protein-coupled receptors 43 and 41 (GPR43 and GPR41)) (Ulven, 2012, Morrison and Preston, 2016). SCFAs produced by the microbiota can also suppress insulin-mediated adipose accumulation through the activation of adipocyte GPR43 (Kimura et al., 2013, Morrison and Preston, 2016).
II-4.2 Bile acids
Bile acids are amphipathic, saturated steroid acids (Hofmann et al., 2010). Primary bile acids (chenodeoxycholic acid and cholic acid in humans) are synthesized from the cholesterol oxidation in the hepatocytes and then conjugated with the amino acids, taurine or glycine, before to be released into the bile in the small intestine (Gerard, 2013, Ridlon et al., 2014). While most of the bile acids are reabsorbed by the small intestine via a process named the enterohepatic circulation, a fraction of them reacs the colon where they are metabolized into secondary bile acids by the bacteria. In humans, the main secondary bile acids are the lithocholic and deoxycholic acids. However, more than 20 types had been identified (Midtvedt, 1974). The microbial metabolism of bile acids involves several metabolic conversions including (1) microbial deconjugation which is carried out by bacteria expressing bile salt hydrolase such as Bacteroides and Bifidobacterium; (2) microbial 7-dehydroxylation by bacteria such as Clostridium and Eubacterium; (3) microbial oxidation and epimerization which are catalyzed by bacteria expressing hydroxysteroid dehydrogenases such as
30
Clostridium and Eggerthella (Jonsson et al., 1995, Gerard, 2013, Wahlstrom et al., 2016). The
bile acids can also reshape the microbial community by increasing the bile acid-metabolizing bacteria and decreasing the bile sensitive bacteria (Wahlstrom et al., 2016). Functionally, bile acids activate the farnesoid X receptor (FXR) or G protein-coupled bile acid receptor (TGR5) signaling pathways (Makishima et al., 1999). FXR activation had been shown to protect against the development of hypercholesterolemia under chow diet condition, but to promote metabolic diseases such as obesity on high-fat diet (Lambert et al., 2003, Thomas et al., 2008, Parséus et al., 2017). The signaling pathway mediated by TGR5 is activated mainly by secondary bile acids and is involved in the control of glucose homeostasis through the increase in GLP-1 release by the intestinal enteroendocrine cells (Thomas et al., 2009).
II-4.3 Tryptophan metabolites
Tryptophan is an essential non-polar aromatic amino acid that needs to be obtained from diet. In numerous gram-positive and gram-negative bacteria as well as various pathogens, tryptophan is converted into indole by the tryptophanase (Lee and Lee, 2010). Other bacteria unable to synthesize indole are however able to modify or degrade indole to produce indole derivatives such as indole-propionic acid, 5-hydroxy-indoleacetic acid or indole-acetic acid (Danaceau et al., 2003). Therefore, when compared to conventionally raised mice, germ-free mice display a major increase in their plasma concentrations of tryptophan and a decrease in indolepropionic acid (Wikoff et al., 2009). On one hand, indole is sensed by the bacteria; thus it and its derivatives play a central role in the inter bacteria communication and participate in the stability of the intestinal ecosystem (Mueller et al., 2009, Wood, 2009). On the other hand, indole is also a signaling molecule detected by the eukaryotic cells. For instance, the indole and some of its derivatives can activate the aryl-hydrocarbon receptor (AhR) in either immune cells (Hubbard, 2015) or intestinal epithelial cells (Lamas, et al., 2016) therefore regulating the immune response, intestinal barrier integrity and gut endocrine function (Chimerel et al., 2014, Hubbard et al., 2015, Lamas, et al., 2016, Wlodarska et al., 2017). The tryptophan is also a precursor for the synthesis of the serotonin by the enterochromaffin cells. Decrease in serotonin synthesis and plasmatic levels in the germ-free mice suggests that the gut microbiota likely participates in the regulation of the intestinal serotonin production (Yano et al., 2015). Despite a lack of clear mechanisms, two bacterial metabolites mentioned above, the SCFAs and the deoxycholic acid, are likely involved in this regulation (Reigstad et al., 2015, Yano et al., 2015). The serotonin acting via several serotonin receptors plays a major
31
2011). In addition to tryptophan, other aromatic amino acids such as phenylalanine and tyrosine can also be metabolized by the intestinal bacteria and produce bioactive compounds able to regulate a wide range of host physiological functions (Dodd et al., 2017).
II-4.4 Lipopolysaccharides
Lipopolysaccharides (LPS), also known as endotoxins, are composed of a hydrophobic domain (lipid A), a distal O-polysaccharide chain, and a non-repeating R-core oligosaccharide (Rietschel et al., 1994, Caroff and Karibian, 2003). They are the major components of the outer membrane of the gram-negative bacteria (Galloway and Raetz, 1990, Raetz and Whitfield, 2002). The dietary intake, particularly high-fat diet, results in the increased abundance of LPS-containing bacteria associated with a higher plasmatic level of LPS. However, the mechanisms involved in the translocation of luminal LPS into the blood remain unclear and may involve intestinal barrier dysfunction and an as yet unidentified transcellular pathway (Cani et al., 2007, Guerville and Boudry, 2016). The increase in plasmatic LPS, also named endotoxemia, is largely suspected to trigger the low-grade inflammation characteristic of metabolic diseases and to promote the insulin resistance through the activation of Toll-like receptor 4 (TLR4) and its co-receptors (Shi et al., 2006, Cani et al., 2007, Saad et al., 2016).
The above list of bacterial products represents only a subset of known potential regulators originating from bacteria. Clearly, many more remain to be discovered. Furthermore, the list of known host physiological functions regulated by the microbiota will expand significantly in the near future.
II-5 The role of gut microbiota in metabolic diseases
Humans normally exist in a remarkably harmonious relationship with its intestinal ecosystem and alteration in the bacterial profile is at the origin of several chronic diseases (Figure 8). Human and rodent studies demonstrated that obesity is associated with profound changes in microbiota (Cani, 2013, Everard and Cani, 2013, Nieuwdorp et al., 2014). Obese individuals are characterized by a lower microbial gene richness (low gene count) (Le Chatelier et al., 2013), a lower ratio Bacteroidetes/Firmicutes and an increased relative abundance of Actinobacteria (Ley et al., 2006, Turnbaugh et al., 2009) when compared to the non-obese counterparts. However, this association between obesity and low ratio
32
Figure 8. The role of gut microbiota in the onset and maintenance of metabolic diseases (Revised from (Pascale et al., 2018))
The gut microbial dysbiosis has multiple consequences than via interconnected pathways can lead to diabetes, obesity and alcoholic fatty liver disease. SCFAs: short-chain fatty acids; NAFLD: non-alcoholic fatty liver disease.
33
Schwiertz et al., 2010). The induction of a metabolic syndrome phenotype through fecal transplants in mice confirmed the important role of the microbiota in this disease (Ridaura et al., 2013). In addition to obesity, the gut microbiota dysbiosis also contributes to the development of diabetes (Qin et al., 2012), non-alcoholic fatty liver disease (NAFLD) (Le Roy et al., 2013) as well as intestinal disorders such as inflammatory bowel diseases (IBD) (Bamola et al., 2017) and mental diseases including Alzheimer’s (Hu et al., 2016) and depression (Kelly et al., 2016). Studies focusing on the mechanisms involved in the development of hepatic steatosis induced by fructose suggested that endotoxin, originating from microbiota, plays also a major role in the induction of hepatic lipogenesis by fructose (Bergheim et al., 2008, Spruss and Bergheim, 2009, Wagnerberger et al., 2013, Ritze et al., 2014, Sellmann et al., 2015). Antibiotic treatment prevented also the alterations of glucose homeostasis, the increase in tissue oxidative stress as well as the elevation of circulating levels of pro-inflammatory cytokines, LPS and non-esterified fatty acids induced by fructose (Di Luccia et al., 2015, Crescenzo et al., 2017). Similarly, probiotics such as Lactobacillus
kefiri reduced the adipose tissue inflammation, plasmatic hypertriglyceridemia and the hepatic
increase in triglyceride content triggered by high fructose diet (Zubiria et al., 2017). Although those studies do not determine whether fructose is a substrate of certain intestinal bacteria, they highlight the potential role of gut microbiota in metabolic disorders induced by fructose.
34
Table 1. The old dogma of localization and secretion of the enteroendocrine cells in the gastrointestinal tract
Cell type Hormone secretion
Localization
Stomach Duodenum Jejunum Ileum Colon
EC cells Serotonin/5-HT + +++ + + +
D cells SST + + + + +
ECL cells Histamine + - - - -
G cells Gastrin ++ + - - -
X/A cells Ghrelin ++ + + + -
I cells CCK - +++ + - - K cells GIP - +++ (+) - - M cells Motilin - + + (+) - S cells SCT - + + - - N cells NTS - - - + - L cells GLP-1, GLP-2 - (+) + ++ +++ PYY - - (+) + +++ INSL5 - (+) - - +++
5-HT: 5-hydroxy-tryptamine; SST: Somatostatin; CCK: Cholecystokinin; GIP: Glucose-dependent insulinotropic peptide; SCT: Secretin; NTS: Neurotensin; GLP-1/2: glucagon-like peptides 1 and 2; PYY: peptide YY; INSL5: insulin-like peptide 5. Reviewed in (Gribble and Reimann, 2016).
35
III-1 The classification of enteroendocrine cells: from the old to a new dogma
EECs are a population of cells found from the stomach to the distal colon (Dobbins and Austin, 2009). Despite representing only approximately 1% of the intestinal epithelium, EECs constitute the main endocrine system of the entire body (Janssen and Depoortere, 2013). Approximately 30 enterohormones are produced by 15 different subpopulations of EECs which were long defined by the main enterohormones they produced and their localization along the GI tract (Rehfeld, 1998, Brubaker, 2012) (Table 1). Some enterohormones are released throughout the entire intestine, such as serotonin/5-hydroxy-tryptamine (5-HT) (Ormsbee and Fondacaro, 1985, Gribble and Reimann, 2016), whereas others are released by EECs in specific regions of the gut. For example, K, I, M, N, and S-cells, which secrete Glucose-dependent insulinotropic peptide (GIP), cholecystokinin (CCK), motilin, neurotensin (NTS), and secretin (SCT), respectively, are mainly found in the small intestine (Buchan et al., 1978, Kitabgi and Freychet, 1978, Lopez et al., 1995, Itoh, 1997, Parker et al., 2009). L-cells, which secrete glucagon-like peptide-1 and 2 (GLP-1 and GLP-2) and the enterohormones peptide YY (PYY), are distributed from the distal small intestine to the colon (Drucker and Nauck, 2006, Chimerel et al., 2014, Latorre et al., 2016b). However, the distribution of the main enterohormoness (PYY, GLP-1, GIP and NTS) differs among species (Wewer Albrechtsen et al., 2016).
However, the dogma of one cell producing one enterohormone has been largely challenged during the past decade. The use of double or triple immunohistochemistry stains (Egerod et al., 2012, Grunddal et al., 2016), together with that of transgenic mice expressing fluorescent proteins under the control of specific hormone promoters (Aiken et al., 1994, Lopez et al., 1995, Mortensen et al., 2003, Egerod et al., 2012, Habib et al., 2012, Bohorquez et al., 2014, Sykaras et al., 2014, Grunddal et al., 2016) has uncovered the ability of most gut enterohormones to be co-expressed and secreted by the same EEC (Engelstoft et al., 2013) (Table 2). Numerous reporter systems have been developed in in vivo mouse models and have been reviewed by Engelstoft et al. (Engelstoft et al., 2013). Here, we will focus on the results provided by reporter mice in which CCK-positive (CCK-GFP mice (Liou et al., 2011a)), Gcg-positive (GLU-Venus mice (Reimann et al., 2008)), and GIP-Gcg-positive (GIP-Venus mice
36
Table 2. Enteroendocrine cells and gut peptides colocalization along the gastrointestinal tract
Intestinal sections Enteroendocrine cell types Major produced peptide Colocalized
peptides Species Detection methods References
Duodenum K cells GIP GLP-1 Human, mouse Immunofluorescence,laser capture microdissection
(Mortensen et al., 2003, Theodorakis et al., 2006, Engelstoft et al., 2013)
CCK, GLP-1, SST Mouse GIP-Venus reporter mice, FACS (Habib et al., 2012, Gribble and Reimann, 2016)
I cells CCK
Ghrl, NTS, GIP,
SCT, PYY, GLP-1 Mouse
CCK-eGFP reporter mice, FACS,Immunohistochemistry
(Egerod et al., 2012, Engelstoft et al., 2013, Sykaras et al., 2014, Gribble and Reimann, 2016, Fothergill et al., 2017) GIP, SCT Human Immunohistochemistry (Egerod et al., 2012)
L cells GLP-1 GIP, PYY Rat Mouse Pig
Venus reporter transgenic mice,
FACS, Immunohistochemistry (Mortensen et al., 2003, Reimann et al., 2008) CCK, GIP Mouse GLU-Venus reporter mice, FACS (Habib et al., 2012, Gribble and Reimann, 2016) CCK, GIP, NTS Rat Immunohistochemistry (Svendsen et al., 2015)
PYY
GIP, GLP-1 Pig Immunofluorescence (Cho et al., 2015) NTS Rat Immunohistochemistry (Svendsen et al., 2015)
S cells SCT GIP Human Immunohistochemistry (Egerod et al., 2012)
CCK, GCG, PYY,
SST Mouse
Immunohistochemistry (Rindi et al., 1999, Habib et al., 2012)
Jejunum
K cells GIP GLP-1 Mouse Immunofluorescence (Cho et al., 2015)
I cells CCK
SCT, NTS, GIP,
Ghrl, GCG, PYY Mouse
CCK-eGFP reporter mice, FACS, immunostaining
(Egerod et al., 2012)
NTS, GLP-1 Human Immunohistochemistry (Egerod et al., 2012)
L cells GLP-1 PYY,GIP Pig Immunofluorescence (Cho et al., 2015)
37
GIP: Glucose-dependent insulinotropic peptide; GLP-1: Glucagon-like peptides 1; CCK: Cholecystokinin; SST: Somatostatin; Ghrl: Ghrelin; NTS: Neurotensin; SCT: Secretin; PYY: peptide YY; 5-HT: 5-hydroxy-tryptamine ; GFP : Green fluorescent protein ; FACS : Fluorescence-activated cell sorting ; GPR41 : G protein-coupled receptors 41.
peptide
Ileum
K cells GIP GLP-1, PYY Mouse, Pig Immunofluorescence (Cho et al., 2015)
I cells CCK
Sct, Nts, Gip, Gcg,
Pyy Mouse
CCK-eGFP reporter mice, FACS,
qPCR (Egerod et al., 2012)
5-HT Mouse Immunohistochemistry (Fakhry et al., 2017)
L cells GLP-1
PYY Mouse, Pig Immunofluorescence (Cho et al., 2015) PYY, NTS
Mouse GPR41-RFP reporter mice, FACS, laser capture microdissection
(Grunddal et al., 2016)
CCK, GIP Mouse GLU-Venus reporter mice, FACS (Habib et al., 2012)
N cells NTS GLP-1, PYY
Mouse GPR41-RFP reporter mice,FACS, laser capture microdissection
(Grunddal et al., 2016)
S cells SCT GLP-1 Human Immunohistochemistry (Egerod et al., 2012)
Caecum I cells? CCK 5-HT Mouse Immunohistochemistry (Fakhry et al., 2017)
Colon L cells GLP-1 PYY Mouse
GLU-Venus reporter mice, FACS, Immunofluorescence
(Habib et al., 2012, Cho et al., 2015)
38
Figure 9. Schematic overview of proposed main enteroendocrine cell lineages of the small intestine (Adapted from (Egerod et al., 2012))
Enteroendocrine cells (EECs) expressing somatostatin represent a distinct lineage from EECs expressing the rest of the GI peptides. The non-somatostatin cells can be subdivided into three subtypes: 1) the cells having the potential to express CCK, GLP-1/2, secretin, PYY, GPI and neurotensin; 2) the cells able to express ghrelin and motilin and 3) the enterochrofanin cells expressing substance P. GI: Gastrointestinal; CCK: Cholecystokinin; GLP-1/-2: Glucagon-like peptides 1/2; GIP: Glucose-dependent insulinotropic peptide; PYY: peptide YY; LGR5+: Leucine-rich repeat-containing G-protein coupled receptor 5.
Figure 10. The four gut hormonal signaling pathways (Adapted from (Steinert et al., 2017))
The four types of gut hormone signaling pathways include: (1) the classical endocrine pathway in which hormones diffuse into the blood; (2) the neurocrine pathway signaling through the afferent nerves, (3) the paracrine pathway acting on neighboring cells and (4) the neuropod pathway in which hormones such as CCK or PYY are released by EECs neuropods that end in synapse-like appositions connecting directly to the enteric neurons. CCK: Cholecystokinin; PYY: Peptide YY; EECs: Enteroendocrine cells.
39
(Parker et al., 2009)) EEC populations are labeled. The use of transgenic mice in which the expression of green fluorescent protein (GFP) was driven by the Cck promoter established that most CCK-positive cells of the duodenum express Pyy, Gcg, Ghrelin, and Gip (Egerod et al., 2012, Sykaras et al., 2014). Only the co-expression of CCK and ghrelin was not confirmed by immunohistochemistry, in agreement with previous data obtained in pigs and humans (Wierup et al., 2007). Interestingly, the population of CCK-positive cells purified from the ileum, express
Gcg, Pyy, and Nts at equal levels and the specific ablation of GLP-1-positive cells decreased the
number of CCK-positive cells by ~ 60% in the ileum (Egerod et al., 2012), strengthening the assumption of an overlap of CCK and GLP-1 production by L-cells in the distal small intestine. The study of transgenic mice expressing Venus fluorescent protein under the control of the Gcg promoter revealed that Gcg-Venus-positive cells isolated from the upper small intestine not only secrete PYY, as expected, but also GIP (Reimann et al., 2008), and display similar expression levels for Gip, Cck, Sct, Nts, and Pyy (Habib et al., 2012). Only SST secretion does not appear to overlap with that of PYY, GLP-1/2, CCK, SCT, NTS, and GIP in the same EECs (Egerod et al., 2012). Overall, these studies suggest that most EEC cells (except SST-positive cells) can express and secrete a broad range of enterohormones (Figure 9). A comparison of the transcription factor expression profiles by microarray of K- and L-cells isolated from GIP-Venus and GLU-GIP-Venus mice, respectively, revealed that upper small-intestine L-cells (defined as Gcg-Venus-positive EECs) are more closely related to duodenal K-cells (defined as GIP-Venus-positive EECs) than colonic L-cells (Habib et al., 2012). This suggests that the regulation of specific enterohormones in the lower intestine may differ from that in the upper small intestine. Thus, the panel of enterohormones expressed or secreted in each EEC is likely regulated by the position of the EECs along the GI tract in association with nutritional or other luminal (e.g. microbial metabolites) factors.
III-2 Gut hormonal signaling pathways
There are four types of pathways through which gut hormones signal to exert their regulatory functions (Figure 10): (1) the endocrine pathway via the blood, (2) the paracrine pathway by acting on neighboring cells, (3) the neurocrine pathway, mostly by signaling through afferent nerves (e.g. the vagal nerve), and (4) the neurocrine-like pathway, directly connecting glial cells to the EECs. This latter pathway was suggested recently by the discovery of EEC structures
40
called neuropods, which displays axon-like features (Bohorquez et al., 2014). These structures have so far been described for CCK- and PYY-positive EECs (Bohorquez et al., 2015).
III-3 The regulation of enterohormone secretion
A wide range of luminal compounds, such as nutrients (per review (Furness et al., 2013), microbial metabolites (e.g. SCFAs or bile acids) (Christiansen et al., 2018, Kuhre et al., 2018, Lu et al., 2018), and microbial components (e.g. LPS or toxins) (Bogunovic et al., 2007, Lebrun et al., 2017) can stimulate the expression and secretion of gut enterohormones. We will not exhaustively review all activators for all enterohormones. We will first focus on the intestinal endocrine response to acute or chronic exposure to fructose. Then, we will examine the endocrine intestinal response to major changes in nutrient influx into the lower GI tract and discuss the role of microbial metabolites on the regulation of the enterohormones. Finally, the regulation of CCK secretion and its function will be described in more detail.
III-3.1 The impact of fructose on the secretion of gut enterohormones
Sugars, such as fructose and glucose, as well as polysaccharides (fiber and starch), are major components of the diet and play a major role in the regulation of the expression and secretion of gut enterohormones. We will mostly center our review on the acute response of EECs to fructose relative to their response to glucose, as well as the consequences of chronic fructose intake on the intestinal endocrine response.
III-3.1.1 The intestinal endocrine response to acute fructose exposure
GLP-1 secretion is stimulated in response to oral fructose challenge in healthy humans and type 2 diabetic patients (Ganda et al., 1979, Vozzo et al., 2002, Kuhre et al., 2014, Yau et al., 2017). Similar results have been observed for mice and rats (Kuhre et al., 2014). Fructose also stimulates GLP-1 secretion in GLUTag cells (Gribble et al., 2003, Kuhre et al., 2014). In contrast, fructose does not activate the secretion of the other incretin hormone, GIP, in neither humans, rats, or mice (Vozzo et al., 2002, Kuhre et al., 2014). However, GIP secretion is mildly stimulated in response to 10mM fructose in primary mouse cells in culture (Parker et al., 2009). Over the course of a day, fructose was shown to prolong the postprandial release of GLP-1 relative to glucose when glucose and fructose were consumed in the context of isocaloric meals (Teff et al., 2004). In the same study, the postprandial suppression of ghrelin was lower after
41
glucose-containing beverage (Teff et al., 2004). This confirmed previous data found in rats, in which fasting ghrelin levels increased after two weeks of fructose consumption, whereas they remained unchanged after two weeks of glucose consumption (Lindqvist et al., 2008). In humans, acute fructose intake also stimulates the release of CCK and NTS to a similar extent as glucose, whereas PYY blood levels modestly increase in response to fructose but not glucose (Kuhre et al., 2014). Thus, acute exposure of EECs to fructose stimulates the secretion of most enterohormones.
III-3.1.2 The intestinal endocrine response to chronic fructose exposure
Numerous studies in rodents and humans have associated the chronic intake of fructose with impairment in insulin sensitivity and glycemic homeostasis (Thorburn et al., 1989, Aeberli et al., 2013). This suggests that chronic exposure to dietary fructose may impair intestinal GLP-1 and GIP secretion in response to nutrients, as GLP-1 and GIP mediate the insulinotropic response to luminal nutrients. This hypothesis was tested, but the measured effects of long-term fructose intake have been largely variable and contradictory (Madani et al., 2015, Maekawa et al., 2017, Matikainen et al., 2017). The differences observed between studies can be explained largely by differences in the duration of exposure to fructose, the mode of administration (liquid or solid), the composition of other nutrients ingested (e.g. in association with a HFD or not), and the concentration of fructose used. This reflects the complexity of the intestinal endocrine response
in vivo and may also reflect the contradictory food intake behavior and satiety response to
fructose (Soenen and Westerterp-Plantenga, 2007, Lindqvist et al., 2008, Moran, 2009, Page et al., 2013, Purnell and Fair, 2013).
III-3.1.3 The potential sensor of fructose in enteroendocrine cells
The mechanism by which fructose activates enterohormone secretion is less clear than for that of glucose. In the intestine, sweets exert part of their regulatory action through the sweet taste G-protein coupled receptor (GPCR) heterodimer system, taste receptor type 2 or 3 (T1R2/T1R3) (Shirazi-Beechey et al., 2011). This receptor can detect the large variety of sweet-tasting molecules (e.g. glucose, fructose, sucrose, aspartame, and sucralose) (Li et al., 2002). T1R2/T1R3 has been found along the intestinal tract at the apical membrane of most of EECs (Dyer et al., 2005, Jang et al., 2007, Margolskee et al., 2007). Rodent EEC cell lines, such as