Lire
le début
de la thèse
3.6 Proper orthogonal decomposition of
the wake low
In order to have a better understanding of the low behavior, a proper orthogonal decomposition (POD) is performed on the measured velocity ield for the tests at Re = 0.5 · 106 and angle of attack of 10◦. The POD has been computed on the
entire PIV ield. The vorticity of each mode is also computed. The POD allows for detecting the coherent structures featured by the low ield on the basis of their wake number and frequency. The POD is extensively used for the assessment of turbulent low ields, when dealing with experimental data, or with numerical computations [Ber11].
The velocity ield can be expressed as a composition of spatial and temporal modes as follows: U′ (x, t) = n ∑ i=1 ϕi(x)ai(t), (3.1)
being ϕi(x)and ai(t)the ithspatial and temporal modes, respectively. The method proposed in Ref. [Per05] is selected among the several techniques employed for the low modal decomposition. This approach is particularly suitable for experimental data. As the ield is discretized in Nx spatial samples for each N snapshots, PIV issues a matrix of data that can be written as:
M = u1 1 u21 uN −11 uN1 u1 2 u22 uN −12 uN2 u1 Nx u 2 Nx u N −1 Nx u N Nx v1 1 v21 v1N −1 v1N v1 2 v22 v2N −1 v2N v1 Nx v 2 Nx v N −1 Nx v N Nx (3.2)
The correlation matrix required for the modal decomposition is computed as :
R = 1
NM
T · M, (3.3)
and the corresponding eigenvalue problem writes
RA = λA, (3.4)
being λ the array of eigenvalues and A the matrix of eigenvectors. The com-puted eigenvalues are then rearranged in descending order as λ1 > λ2 > ... > λN = 0. The matrix of eigenvectors is employed to compute the spatial modes as follows:
ϕi = N ∑ j=1A i juj || ∑N j=1A i juj|| , i = 1, 2, ...N (3.5)
being ϕi the ith spatial mode. The computation of the temporal modes is
straightforward:
ai = ϕiM (3.6)
Based on 15000 snapshots, the irst 200 modes are retained from the POD. In the following only the irst ive modes and the higher order modes exhibiting the most signiicant vortical structures are displayed and discussed in a irst time. Subsection 3.6.5 deals with higher POD modes to underline the control strategy. Namely, Von Kármán, Kelvin Helmholtz and two other coherent vortical structures have been detected within the wake. First the static coniguration, i.e. with the trailing edge non-actuated, is discussed. Then PODs for the velocity ields obtained by trailing edge actuation at frequency f∗
a = 3.7(55Hz) and amplitude a
∗
= 0.03% (500V) and a∗
= 0.06% (1000V) respectively are illustrated. Finally the spatial and temporal modes for excitation at frequency f∗
a = 0.83 12.5Hz and amplitude
a∗
= 0.09%(1000V) are described.
The Figures 3.16, 3.18, 3.20, 3.22, 3.23, 3.24a, 3.25, 3.26, 3.27c, 3.27b represent from left to right: i) the stream-wise component of the ith spatial velocity mode; ii)
the crosslow component of the ithspatial velocity mode; iii) the vorticity computed
for the corresponding ith spatial velocity mode; iv) the power spectral density
(PSD) of the temporal mode associated to the velocity magnitude. The velocity spatial modes are normalized by the free stream velocity. The black triangle on the left hand side of the low ields represents the location of the wing trailing edge.
The PSDs are computed using the Welch’s weighted overlapped segment aver-aging estimator [Wel67]. Periodogram estimations use 4 s Hamming windows with 64% overlap (minimum variance) and zero padding. The shedding frequencies are often provided in non dimensional form, using Strouhal number.
3.6.1 POD of the PIV measurements for the
baseline coniguration
Figure 3.16 displays the irst ive modes issued by the POD. The irst mode (four plots on the top of the igure) corresponds to the time average of the low ield. The wake region is clearly visible both on the velocity and on the vorticity ields. In particular the two counter-rotating vorticity regions correlated to the low from the upper and on the lower side of the wing section are clearly visible. The PSD of the temporal mode decays rapidly, as expected for the mean ield. The energy content of mode #1 is equal to the 98.4% of the total energy, see Figure 3.15. An estimation of the energy featured by a speciic mode is provided by the associated eigenvalue, or equivalently by the area subtended by the PSD of the temporal mode. Modes #2 and #3 exhibit shear layer vortical structures, detectable both on the velocity and on the vorticity ields. The peak at Strouhal St = 11.5 observed in the PSD conirms shedding phenomena typical of Kelvin Helmholtz instabilities. The shear layer instability frequency is consistent with the estimation provided in section 3.4, as well as with the indings of [Szu+15] for numerical simulations in transonic conditions. With this regard it’s worth remarking that the low beside the wake in Ref. [Szu+15] features local Reynolds number comparable to that of the experiments carried out in the present work. In fact the low is substantially decelerated downstream the shock on the suction side. By considering at the veloc-ity ields of modes #2 and #3, they are in space quadrature, and additionally they feature the same spectrum and the same energy content. Therefore a progressive wave of counter-rotating vortices occurs, alternately shed from the trailing edge, and convected downstream.
Modes #4 and #5 seem chaotic and are discussed in 3.6.5.
1 10 20 30 40 50 60 70 80 90 100 110 120 130 140 150 160 170 180 190 200 10−4 10−3 10−2 10−1 100
Mode energy of baseline configuration
Mode number Energy distribution (a) 5 10 15 20 25 30 10−4 10−3 10−2 10−1 100 98.4256% 0.0552% 0.0546% 0.0347% 0.0335% 0.0308% 0.0298% 0.0283% 0.0261% 0.0249% 0.0239% 0.0227% 0.0217% 0.0217% 0.0212% 0.0199% 0.0196% 0.0191% 0.0189% 0.018% 0.017% 0.016% 0.016% 0.016% 0.01% 0.01% 0.01% 0.01% 0.01% 0.01% Mode number Energy distribution
Mode energy of baseline configuration
(b)
Figure 3.15: Energy distribution of the irst modes issued from the POD for the baseline coniguration. The irst 200 are presented in (a), (b) focuses on the irst 30.
Figure 3.16: POD of the irst ive modes for the non actuated coniguration. From left to right: stream-wise velocity component; crosslow velocity component; vor-ticity of the corresponding mode; PSD of the temporal coeicients of each POD mode.
3.6.2 POD of the PIV measurements for HFVTE at
f
a
∗
= 3
.7 a
∗
= 0
.03%
(
55
Hz 500V
)
Results of the POD performed for the velocity data measured with actuation at
f∗
a = 3.7 a
∗
= 0.03%(55Hz and amplitude 500V) are discussed here. The trailing edge tip cross low peak to peak velocity imposed by the actuation corresponds to 1%U∞. The reader can refer to Figure 3.3 (performance of the HFVTE
actu-ator), assuming in this actuation case the vibration amplitudes and velocities are halved, as the voltage is halved compared to the 1kV characterization in the igure (speciically, assuming linear piezoelectricity).
Figure 3.18 shows the irst ive spatial modes, together with the PSD of the corresponding temporal mode. The irst row of igures from the top is the irst mode, therefore it describes the mean behavior of the wake. The velocity and vorticity ields, as well as the PSD of the temporal mode, resemble the static counterpart. However in this case the energy associated to the irst mode contains the 97.5% of the total energy, therefore it is smaller than the static analogue. As a consequence a larger fraction of energy is contained within the higher order modes, see Figure 3.17.
The second row of plots in Figure 3.18 displays the second mode of the POD. Mode #2 shows non-coherent vortices with almost lat and high amplitude PSD. Modes #3 and #4 exhibit Kelvin Helmholtz vortices. Their frequency shifts from
St = 11.5(173Hz) of the non-actuated case, to St = 11 (165Hz). The
correspond-ing dimensional frequency of 165 Hz corresponds to three times the actuation frequency. Mechanisms of such change in low due to morphing are explained in section 3.6.5.
1 10 20 30 40 50 60 70 80 90 100 110 120 130 140 150 160 170 180 190 200 10−4 10−3 10−2 10−1 100
Mode energy of 12.5Hz 1kV configuration
Mode number
Energy distribution
Mode energy of 55Hz 0.5kV configuration
(a) 5 10 15 20 25 30 10−4 10−3 10−2 10−1 100 97.6599% 0.0694% 0.0576% 0.0569% 0.0547% 0.0451% 0.0418% 0.0397% 0.0383% 0.0362% 0.0340% 0.0319% 0.0312% 0.0286% 0.0282% 0.0276% 0.0276% 0.0269% 0.0247% 0.024% 0.023% 0.022% 0.022% 0.020% 0.02% 0.02% 0.02% 0.02% 0.02% 0.02% Mode number Energy distribution
Mode energy of 55Hz 0.5kV configuration
(b)
Figure 3.17: Energy distribution of the irst modes issued from the POD with trailing edge harmonic actuation at f∗
a = 3.7 a
∗
= 0.03% (55Hz 500V). The irst 200 are presented in (a), (b) focuses on the irst 30.
Figure 3.18: POD of the irst ive modes with trailing edge harmonic actuation at f∗
a = 3.7 a
∗
= 0.03% (55Hz 500V). From left to right: stream-wise velocity component; crosslow velocity component; vorticity of the corresponding mode;
3.6.3 POD of the PIV measurements for HFVTE at
f
a
∗
= 3
.7 a
∗
= 0
.06%
(
55
Hz 1000V
)
Figure 3.20 shows the irst ive POD modes extracted by the measured velocity ield. The energy content of the irst mode is 97.5% of the total energy, as for the actuation at 500V. Therefore the energy content of the mean low remains unchanged when doubling the actuation amplitude, as shown in Figure 3.19. Mode #2 exhibits a tight peak in the PSD of the temporal mode at three times the actuation frequency, i.e., St = 11. This mode is associated with coherent vortical structures not observed within the non actuated coniguration. The energy content of mode #2 is found to be larger compared to the static counterpart.
With regard to modes #3 and #4 similar efects to those obtained when ac-tuating at 500V are observed. Namely Kelvin Helmholtz structures are shifted to St = 11 (165Hz), corresponding to three times the actuation frequency. The mechanisms of such change in low due to morphing are explained in section 3.6.5.
1 10 20 30 40 50 60 70 80 90 100 110 120 130 140 150 160 170 180 190 200 10−4 10−3 10−2 10−1 100
Mode energy of 55Hz 1kV configuration
Mode number Energy distribution (a) 5 10 15 20 25 30 10−4 10−3 10−2 10−1 100 97.5549% 0.0614% 0.0597% 0.0592% 0.0529% 0.0477% 0.0466% 0.0444% 0.0436% 0.0388% 0.0364% 0.0346% 0.0332% 0.0305% 0.0295% 0.0290% 0.0269% 0.0258% 0.0256% 0.025% 0.024% 0.023% 0.023% 0.022% 0.02% 0.02% 0.02% 0.02% 0.02% 0.02% Mode number Energy distribution
Mode energy of 55Hz 1kV configuration
(b)
Figure 3.19: Energy distribution of the irst modes issued from the POD with trailing edge harmonic actuation at f∗
a = 3.7 a
∗
= 0.06%(55Hz 1000V). The irst 200 are presented in (a), (b) focuses on the irst 30.
Figure 3.20: POD of the irst ive modes with trailing edge harmonic actuation at f∗
a = 3.7 a
∗
= 0.06% (55Hz 1000V). From left to right: stream-wise velocity component; crosslow velocity component; vorticity of the corresponding mode; PSD of the temporal coeicients of each POD mode.
3.6.4 POD of the PIV measurements for HFVTE at
f
a
∗
= 0
.83 a
∗
= 0
.09%
(
12
.5
Hz 1000V
)
The response of the low to harmonic excitations at frequency f∗
a = 0.83 (12.5Hz) and amplitude a∗
= 0.09% (1000V) is inally investigated by means of POD. The delection velocity of the trailing edge tip is 0.45%U∞.
Figure 3.22 shows the irst ive modes issued by the POD of the measured velocity ield. The irst mode, corresponding to the time average of the velocity and of the resulting vorticity, features an energy content of 97.6%, not dissimilar to that of the static counterpart, see Figure 3.21.
The energy content of mode #2 contains the 0.06% of the total energy amount. The corresponding velocity and vorticity ields show non-coherent vortices with almost lat and high amplitude power spectral density. The low energy of this mode appears to be signiicantly increased compared to the non-actuated case. A similar phenomenon as f∗
a = 3.7 a
∗
= 0.06% (55Hz 500V), i.e. a new chaotic second POD mode is found. Discussion is detailed in section 3.6.5.
The PSD of mode #3, #4 and #5 show peaks at 10 times the actuation frequency (St = 8.5), associated to very coherent structures and corresponding to Kelvin Helmholtz vortices. Moreover, a secondary energy peak is visible at St = 11.7 (175Hz), i.e., 14 times the actuation frequency.
1 10 20 30 40 50 60 70 80 90 100 110 120 130 140 150 160 170 180 190 200 10−4 10−3 10−2 10−1 100
Mode energy of baseline configuration
Mode number
Energy distribution
Mode energy of 55 [Hz] 0.5 [kV] configurationMode energy of 12.5Hz 1kV configuration
(a) 5 10 15 20 25 30 10−4 10−3 10−2 10−1 100 97.6308% 0.0635% 0.0515% 0.0481% 0.0469% 0.0444% 0.0407% 0.0360% 0.0355% 0.0327% 0.0324% 0.0318% 0.0315% 0.0312% 0.0308% 0.0290% 0.0269% 0.0266% 0.0245% 0.024% 0.022% 0.022% 0.022% 0.022% 0.02% 0.02% 0.02% 0.02% 0.02% 0.02% Mode number Energy distribution
Mode energy of 12.5Hz 1kV configuration
(b)
Figure 3.21: Energy distribution of the irst modes issued from the POD with trailing edge harmonic actuation at f∗
a = 0.83 a
∗
= 0.09% (12.5Hz 1000V). The irst 200 are presented in (a), (b) focuses on the irst 30.
Figure 3.22: POD of the irst ive modes with trailing edge harmonic actuation at
f∗
a = 0.83 a
∗
= 0.09% (12.5Hz 1000V). From left to right: stream-wise velocity component; crosslow velocity component; vorticity of the corresponding mode;
3.6.5 Wake mechanisms, higher order modes and
control strategies
This section now details some wake mechanisms and focuses on comparison be-tween the diferent actuations. The control strategy described in section 3.4 is illustrated with experimental results.
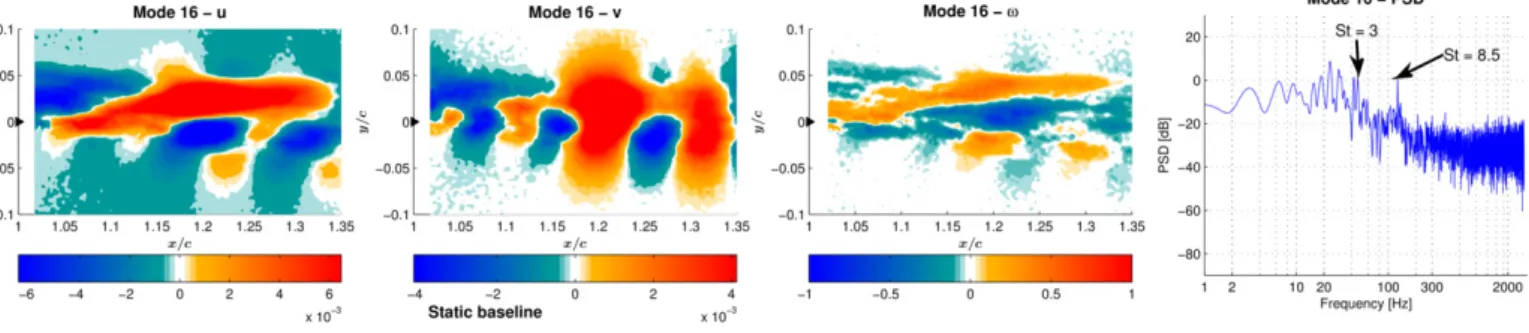
1) Von Kármán vortex shedding. Regarding the static baseline, two
co-herent structures are also observed at St = 8.5 (127Hz) and at St = 3 (46Hz), or multiples of this latter frequency. Figure 3.23 shows an example of a mode where coherent structures at these frequencies are detected. Speciically modes where peaks at multiples of St = 3 (46Hz) are detected are #8, #9, #16, #17, #18, #19, #20, #24, #27, #34 and #35. Modes with vortex shedding phenomena at St = 8.5 (127Hz) are #12, #13 (Figure 3.25), #14, #15, #16, #17, #18, #19, #21, #22, and #24. As a consequence, there are some modes which exhibit both of these two vortical structures, respectively coupled, see Figure 3.23. It is worth noting that this coupling is found to be strongly afected by the trailing edge ac-tuation discussed in the following. The peak at St = 3 (46Hz) can be associated with the Von Kármán instabilities. The peak at 127Hz (which will be referred to as the letter A in the next section) is a combination of Von Kármán (VK) and shear layer (SL) instabilities according to: StA= StSL− StVK.
Figure 3.23: POD mode #16 for the non actuated baseline coniguration. From left to right: stream-wise velocity component; crosslow velocity component; vorticity of the corresponding mode; PSD of the temporal coeicients of each POD mode.
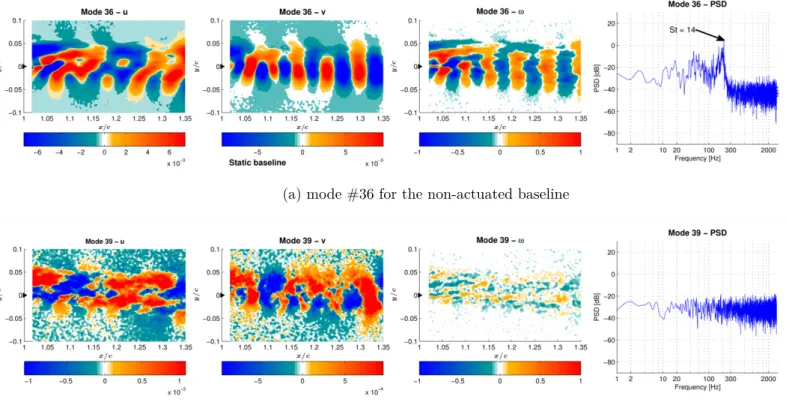
2) Higher order mode St = 14. Figure 3.24a shows the mode #36 issued
by the POD of the static case. This mode shows a special coherence and the PSD for the temporal mode corresponds to St = 14.1 (212Hz peaks referred to as B in section 3.5). The corresponding modes in case of morphing at f∗
a = 3.7 a
∗
= 0.03% (55Hz 500V) are #38 or #39, because the actuation inserts new patterns. For this reason, in the morphing case, mode #39 of the actuated case is compared to mode #36 of the static case (see Figure 3.24b). It can be seen that this mode has lost its spatial coherence, the spectrum does no more display predominant peaks and the vorticity ield of this mode indicates a signiicant of the wake thickness, corresponding to approximatively 15%. This morphing induced efect is analogue to the re-injection of turbulence by means of higher-order POD modes studied numerically by Szubert et al. [Szu+15], enhancing an eddy-blocking efect.
It’s also worth remarking that none of the 60 modes retained from the POD for all actuation cases exhibit peaks at St = 14.1 (212Hz). This conirms that these coherent structures are actually dissipated and are not moved towards larger wave numbers. This is an example of vortex breakdown.
3) Shift of modes associated to the shear layer towards higher
order-lower energy modes. Both actuations at f∗
a = 3.7 a ∗ = 0.03% (55Hz, 500V) and f∗ a = 0.83 a ∗
= 0.09% (12.5Hz, 1000V) exhibit a downshift of the modes #2 and #3 compared to the static baseline. This efect is also present on the
f∗
a = 3.7 a
∗
= 0.06% (55Hz, 1000V) with a higher presence of the actuation frequency in the spectra, due to a larger forcing amplitude. The cause is twofold. Firstly, the forced low is found to exhibit vortex shedding phenomena at super-harmonics of the actuation frequency. The two actuations at f∗
a = 3.7(55Hz) have shifted the Kelvin Helmholtz shedding frequency from St = 11.5 to 3 times the actuation frequency St = 11 = 3 · f∗
a. Actuation at f
∗
a = 0.83 has shifted this frequency to 10 times the actuation frequency St = 8.5 = 10·f∗
a. Again the forced low is found to exhibit vortex shedding phenomena at super-harmonics of the actuation frequency. A similar behavior was showed for instance in Refs. [Mot15a; Mot15b] on the low response to a harmonically oscillating L-shaped Gurney lap. Secondly, morphing introduces a new chaotic second mode - see modes #2 in Figures 3.18 and 3.22. This energy injection is the signature of the eddy blocking efect described in Section 3.4. The modes #3 and #4 of the morphing case are similar to the modes #2 and #3 of the baseline, so morphing causes the shift of these two modes to higher order. These two modes characterize the main vortex shedding of the wake lost energy. This downshift in energy is associated to vortex breakdown. Speciically, the energy distribution of this morphing case (f∗
a = 3.7 a
∗ = 0.03%) shows that the chaotic mode #2 is 3% more energetic than
the coherent mode #3 - see Figure 3.17. This decrease in energy reaches the value of 23% between mode #2 and #3 for the f∗
a = 0.83 a
∗
-(a) mode #36 for the non-actuated baseline
(b) mode #39 for the f∗
a = 3.7 a
∗
= 0.03%morphing case
Figure 3.24: Comparison of two POD modes. From left to right: stream-wise velocity component; crosslow velocity component; vorticity of the corresponding mode; PSD of the temporal coeicients of each POD mode.
see Figure 3.21. Further shifts in the low modes with respect to the static case are observed when actuating at f∗
a = 3.7 a
∗
= 0.03% (55Hz, 500V). Namely coherent structures observed for mode #16 of the static coniguration are found on mode #32, not reported here for brevity purposes.
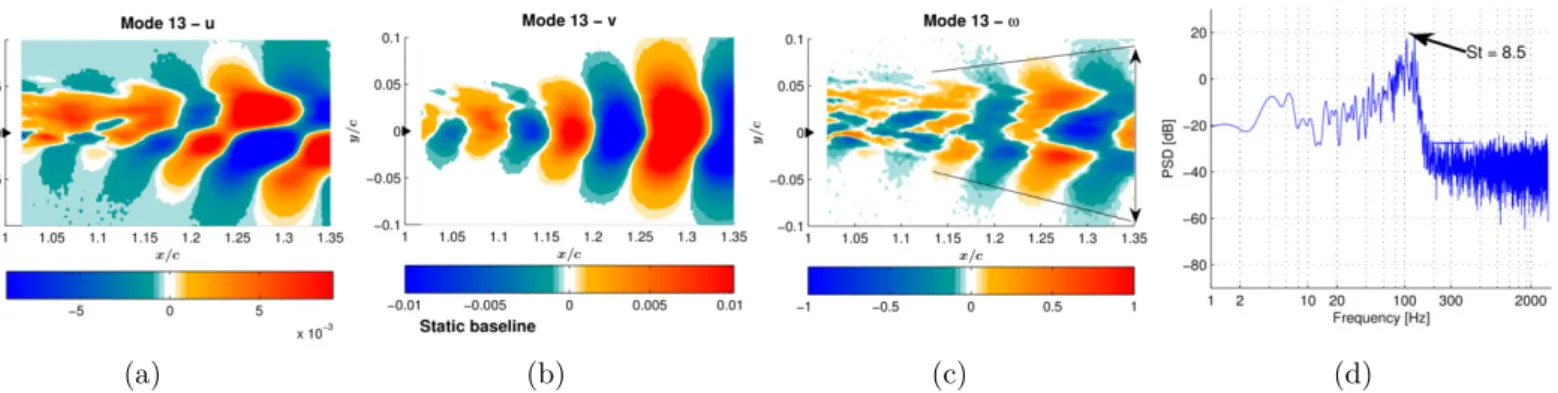
4) Shear layer thinning. Morphing efects on wake thickness are visible on
higher POD modes. For instance, the mode #13 of the static baseline (Figure 3.25) indicates wake expansion. The actuated case at frequency f∗
a = 3.7 a
∗
= 0.06% (55Hz, 1000V) illustrates the eddy blocking efect. The POD mode #22 (Fig-ure 3.26) corresponds to the baseline mode #13, because there are similarities in the spatial mode distribution and their temporal coeicients show the same peak at Strouhal of 8.5; besides, actuation frequency is present in the spectrum of the morphing case (Figure 3.26d). The v component of the mode indicates a thinner wake which decreases in the wake expansion, after x/c = 1.25. The wake thickness, indicated by arrows on Figures 3.25c, 3.26c is reduced by approximately 22% at
x/c = 1.35, thanks to the actuation. One can also remark that – due to the
mor-phing – the magnitude of the characteristic peak at Strouhal of 8.5 has decreased by 10 dB, which means the power density divided by 10.
5) Downshift of the higher energy chaotic modes. Now considering the
modes #4 and #5 of the static baseline (Figure 3.16 or Figure 3.27a), similarities can be found with modes #57 of the case f∗
a = 3.7 − a
∗
= 0.03% (Figure 3.27b) and the mode #40 of the case f∗
a = 0.83 a
∗
= 0.09%(Figure 3.27c). These modes have comparable spatial energy distribution. Modes #4 and #5 of the baseline are chaotic but with high energy. The corresponding morphing modes have thinner wakes, due to the eddy blocking efect. Spectra of morphing modes #40 and #57 present peaks that are not present in the static modes; these peaks correspond to harmonic of the actuation frequencies: the Strouhal of 9.2 corresponds to 11 times the actuation frequency (9.2 ≃ 11·0.83) for the mode #40 whereas the Strouhal of 11corresponds to 3 times the actuation frequency for the mode #57 (11 ≃ 3 · 3.7). It is worth noting that these two morphing cases, both diferent in amplitude and frequency generate equivalent efects.
(a) (b) (c) (d)
Figure 3.25: POD mode #13 for the non actuated baseline coniguration. From left to right: stream-wise velocity component; crosslow velocity component; vorticity of the corresponding mode; PSD of the temporal coeicients of each POD mode.
(a) (b) (c) (d)
Figure 3.26: POD of mode #22 with trailing edge harmonic actuation at f∗
a = 3.7 a∗
= 0.06%(55Hz 1000V). From left to right: stream-wise velocity component; crosslow velocity component; vorticity of the corresponding mode; PSD of the temporal coeicients of each POD mode.
(a) POD mode #5 for the non actuated baseline coniguration. From left to right: stream-wise velocity component; crosslow velocity component; vorticity of the corresponding mode; PSD of the temporal coeicients of each POD mode.
(b) POD mode #57 with trailing edge harmonic actuation at 55 Hz and 500 V. From left to right: stream-wise velocity component; crosslow velocity component; vorticity of the corresponding mode; PSD of the temporal mode for the velocity magnitude.
(c) POD mode #40 with trailing edge harmonic actuation at 12.5 Hz and 1000 V. From left to right: stream-wise velocity component; crosslow velocity component; vorticity of the corresponding mode; PSD of the temporal mode for the velocity magnitude.
3.6.6 General remarks on the POD results
The proper orthogonal decomposition is carried out on the wake velocity ield mea-sured by PIV surveys. The irst 60 modes issued by POD are investigated in terms of velocity and vorticity ields. The PSD of the temporal mode is also analyzed. It appears that the vortical structures observed at certain frequencies on the unforced low are shifted to the actuation frequencies or to their higher harmonics. This efect occurs equally for the two actuation amplitudes here considered. With this regard it appears that for the excitation frequency of f∗
a = 3.7(55Hz), actuating at
a∗
= 0.03% (500V) is more favorable compared to a∗
= 0.06% (1000V), where a signiicant increase in the energy of mode #2 relative to the static case is observed. In general comparing the unforced and the forced low, this latter features a slightly higher level of energy. The fact that the same vortical structures are observed on higher order modes relative to the static case is an indication that a proper vortex breakdown –limited to the larger coherent structures– is occurring. The turbulent luctuation dynamics shows signiicant modiications due to the morphing:
• shift of the non-actuated modes 2 and 3 (Figure 3.16) associated to Kelvin-Helmholtz towards the higher order modes 4 and 5 (Figure 3.22) for actuated case;
• disappearance of coherent higher frequency modes: St = 14 for instance, shift of modes associated to the shear layer towards higher-order lower-energy modes;
• shear layer thinning at x/c=1.35 of order 22% (Figures 3.25c and 3.26c); and • decrease of spectral amplitude of the peak at St=8.5, Figures 3.25d and
and 3.26d.
Furthermore, the low response to wake forcing is similar to that reported in Ref. [Szu+15] for transonic low conditions. This conirms the potential suitability of high frequency actuation both for subsonic low conditions here investigated typical of descent light, and for cruise speeds.
3.7 Spectral analysis of low velocity
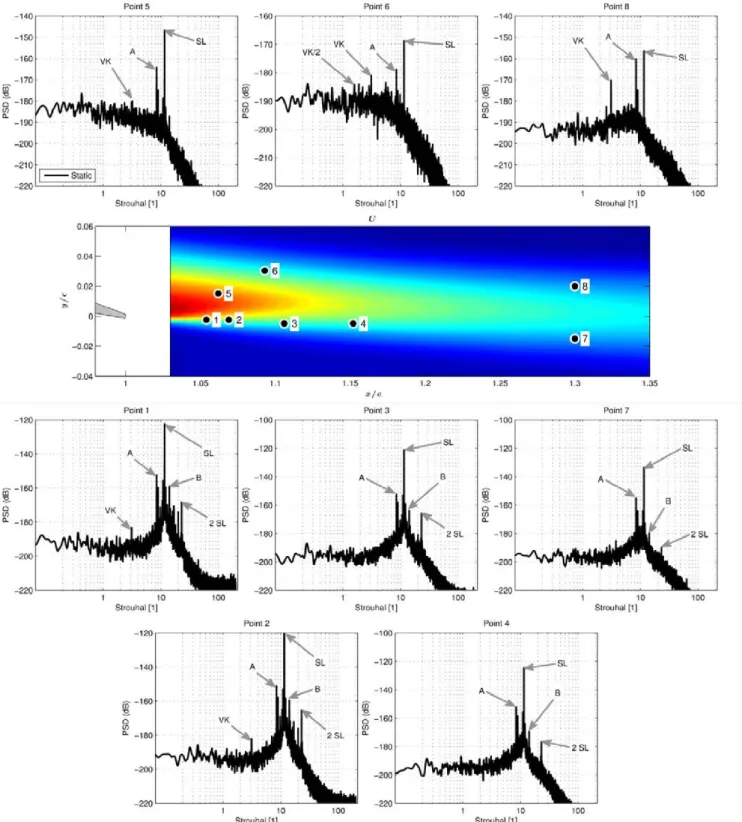
The crosslow velocity component is extracted for 8 points from the TR-PIV mea-surements. These points are located in the wake close to the trailing edge and downstream, below and above the trailing edge. The center of Figure 3.28 presents the time average stream-wise velocity ield of the non-activated baseline low. The 8 points are numbered on the ield. The trailing edge is visible on the left. The diferent Power Spectral Densities (PSD) of the crosslow velocities are presented in the spectra around the central velocity ield. The PSDs are again computed using the Welch’s weighted overlapped segment averaging estimator [Wel67]. To maximize the accuracy of the estimator, temporal signals of the three experiment repetitions are concatenated to obtain 33 s signals. Periodogram estimations use 4 s Hamming windows with 64% overlap (minimum variance) and zero padding.
According to the POD results, the low energy is mainly dominated by the shear layer (SL) coherent instabilities. This corresponds to the SL arrows pointing to the frequency peaks. The shear layer instability is more concentrated in the lower low, as the SL peaks of points 1 to 4 are over −130dB and the second harmonics are visible (2SL peaks). The points 1, 2, 5 and 6 which are located close to the trailing edge show the frequency signature of the Von Kármán vortices – presented by VK and VK/2 arrows. Coherent structures highlighted by POD analysis at Strouhal of 14.1 appear as B peaks. These peaks are absent from points 6 and 8 corresponding to the low coming from the suction side. The Von Kármán Strouhal number is evaluated to 3. This is again comparable to CFD simulations of Ref. [Szu+15] with a Strouhal of 2.4 (computed relatively to the chord with the frequency 2630Hz). Peaks A, present on each of the considered points, correspond to the coupling of the Von Kármán and the shear layer structures. Indeed the Strouhal of the peak A is linked to these structures by the relation StA= StSL−StV K. Physically, this can be interpreted as Kelvin Helmholtz amplitude modulation due to the Von Kármán instabilities. This peak identiication not only allows for the understanding of the phenomena but also allows identifying spectral signatures in the low. These signatures can be detected by pressure transducers (see section 3.8). In addition, the low is signiicantly afected by the actuation and its efects are clearly visible on the reported spectra.
The crosslow velocity component is extracted for the actuated conigurations. Globally the peaks described above are still visible, but some modiications are noticeable. As some spectra are similar, only signals from points 4, 5 and 8 are compared.
Figure 3.29 shows a comparison in PSD of point 4 between the baseline and the
f∗
a = 0.83 (12.5Hz) actuation. The frequency range is focused on Strouhal from 7.5 to 15. Actuation harmonic frequencies from 9 to 18 are presented on the x-axis.
Peaks of baseline low named A, SL and B are withdrawn by the actuation. In exchange the actuation gives rise to other peaks. Most of them have lower ampli-tude and others are harmonics of the actuation frequency. Black arrows indicate peaks corresponding to harmonics of the actuated low. This phenomenon tends to spread the peak energies over actuation harmonics and over other frequencies. This could be interpreted as a vortex breakdown of the largest coherent structures. Concerning the other points in the wake and the other actuation cases, table 3.1 deals with the Root Mean Square (RMS) values of luctuating crosslow velocity
v2 of the 8 extracted points. Variations compared to the non actuated baseline are
calculated in percentage. The turbulent energy is decreased by 5 to 7% everywhere for the f∗
a = 0.83 (12.5Hz) actuation. The f
∗
a = 6.7 (55Hz) actuations decrease energy close to the trailing edge by more than 8% but slightly increase it down-stream. This efect is more visible for the higher amplitudes for the a∗
= 0.06% (1kV) actuation compared to the a∗
= 0.03% (0.5kV). This result conirms the previous remarks.
Table 3.1: Variations of crosslow velocity RMS at extracted points compared to the baseline coniguration.
Point number 1 2 3 4 5 6 7 8
Baseline 0.0% 0.0% 0.0% 0.0% 0.0% 0.0% 0.0% 0.0%
12.5[Hz] 1[kV] -7.9% -6.7% -7.1% -7.1% -2.4% -3.3% -4.9% 1.0% 55[Hz] 500[V] -8.7% -5.8% -0.1% 4.1% 0.3% -4.0% 5.4% 6.5% 55[Hz] 1[kV] -10.0% -6.7% 0.4% 7.7% 1.5% -2.1% 8.2% 9.7% Table 3.2: Variations of crosslow velocity PSD at some noticeable frequencies, at the extracted points 4, 5 and 8. Values are relative to the baseline coniguration. Points are ranked by position starting from the trailing edge (point 5) and moving downstream (point 8). Crosses (×) indicate non visible peaks.
VK (St = 3) A=SL-VK (St = 8.5) B (St = 14) Fa A∗ pt 5 pt 4 pt 8 pt 5 pt 4 pt 8 pt 5 pt 4 pt 8 12.5[Hz] 1[kV] -3 dB 0 dB -11 dB +7 dB +13 dB +9 dB -3 dB -3 dB × 55[Hz] 500[V] -2 dB × -14 dB +1 dB +8 dB +4 dB -5 dB -5 dB × 55[Hz] 1[kV] -2 dB × -14 dB 0 dB +1 dB 0 dB × -7 dB × SL (St = 11.5) 2SL (St = 23) pt 5 pt 4 pt 8 pt 5 pt 4 pt 8 12.5[Hz] 1[kV] -17 dB -18 dB -16 dB +37 dB -13 dB × 55[Hz] 500[V] -5 dB -5 dB -4 dB × +4 dB × 55[Hz] 1[kV] -5 dB -4 dB -4 dB +1 dB -3 dB ×
Table 3.2 sums up the efects of morphing on remarkable peaks of the spectra. It is remarkable that a few thousandth of chord fraction vibration amplitude is capable to reduce the large wake vortices power by nearly 99.9% (30 dB). It appears on one hand that both f∗
a = 6.7(55 Hz) and f
∗
a = 0.83(12.5 Hz) morphing increase the A peaks, related to the interaction of Von Kármán and shear layer instabilities. On the other the signatures VK linked to the Von Kármán vortical structures are signiicantly reduced. A noticeable result is that actuation at f∗
a = 0.83(12.5 Hz) deletes the most energetic peaks SL but increases the harmonic peak 2SL in the region close to the trailing edge. In comparison to this actuation, the two morphing cases f∗
a = 6.7 (55 Hz) yield smaller reductions and risings of the PSD peaks. Another important result is that the impact of the amplitude at f∗
a = 6.7 (55 Hz) is low compared to the impact of the frequency: a larger actuation amplitude increases a bit more the efects on higher frequencies B and 2SL as well as the coupling A between SL and VK. Apart from the efects on the main frequency peaks of the baseline static wing, the actuation generates other frequency peaks. Most of these peaks are actuation harmonics. Harmonic 3 of the f∗
a = 6.7(55 Hz)
a∗
= 0.03%(500 V) actuation presents an important PSD level everywhere which increases by 3 dB for the a∗
= 0.06% (1 kV) actuation.
Finally, despite the creation of coherent structures due to the actuation, the HFVTE can be beneicial as it decreases the Von Kármán and Kelvin Helmholtz vortex energies. The actuation amplitude has to be set as a compromise between vortex breakdown efect and energy introduced in the wake.
Figure 3.28: PSD of the crosslow velocity on the 8 extracted points, from the baseline coniguration. The center igure presents the positions of the extracted points within the time average stream-wise velocity.
9 f*a 10 f*a 11 f*a 10 13 f*a 14 f*a 15 f*a 16 f*a 17 f*a 18 f*a −200 −190 −180 −170 −160 −150 −140 −130 Strouhal Point 4 PSD of v (dB) Baseline static f* a=0.83 a *=0.09% HFVTE actuation B SL A
Figure 3.29: PSD magniication of point 4 of the crosslow velocity. Baseline is compared to 12.5Hz actuation. Black arrows indicate peaks at multiples of the actuation frequency f∗
3.8 Efect of high frequency actuation on
aerodynamic loads
A second test campaign is carried out in order to investigate the efects of higher frequency actuation on local and resulting airloads over the wing section model. Measurements are performed at Reynolds number Re = 106 and angle of attack of
10◦.
Lift and drag are measured with an aerodynamic balance, whereas pressure is acquired by means of a microphone located at the 90% of the chord and in the middle of the model span. To ensure the statistical convergence of measurements an acquisition time of 40 s is employed for each run. For this time lapse all the main statistical indicators have found to converge, both for force and pressure measurements. Flow visualizations are not reported as the limited acquisition time of 6.5 s of the PIV camera memory does not allow reaching the statistical convergence of the measured phenomena for this Reynolds number.
Sinusoidal harmonic inputs are provided to the piezo-actuators, with frequen-cies in the range f∗
a ∈ [3.2, 14.6] (Fa ∈ [100, 450]Hz) and amplitude 1000V. The actuation amplitude a∗ (or A) is not maintained constant. As mechanical
reso-nance can occur in the range f∗
a ∈ [4.9, 7.2](Fa ∈ [150, 220]Hz), the results of the HFVTE actuation in this section depend on both coupled frequency and amplitude. With the aim to check the repeatability of measurements, several acquisitions are performed by alternating actuated with non-actuated runs. For each run, the mea-sure is launched 20 s after the switch of the control input (on/of and vice versa), to allow for the settling of the permanent regime in the low dynamics, as indicated in A.2. The maximum percentage diference in drag between runs is 0.5%. This conirms the reliability of the measured quantities. With regard to the non actu-ated coniguration, diferences between repeactu-ated runs are below 10−4% for both
lift and drag.
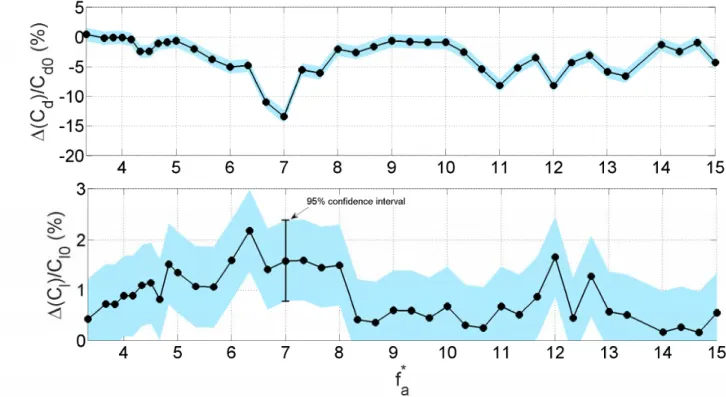
Figure 3.30 displays the percent gain in terms of drag and lift obtained with the trailing edge actuation at a speciic frequency referred to as f∗
a and maximum amplitude 1000 V, relative to the non-actuated case. Positive values indicate that the actuation increases the measured quantity, whereas the opposite is meant for negative gains. For each of the actuation frequencies, positive gains in lift and neg-ative gains in drag are obtained. Therefore high frequency trailing edge actuation appears beneicial in improving the overall sectional aerodynamic performance. It can be noticed that the low at Reynolds number of 1 million undergoes a strong unsteady behavior with modiications of the forces, being this case likely to be close to a bifurcation. The vibration of the trailing edge increases the turbulence intensity in the boundary layer and the transition to turbulence goes more
Figure 3.30: Percent gain of mean drag (top) and lift (bottom) coeicients obtained with HFVTE, relative to the non-actuated case. Experiments are done at Re = 1M
stream. Therefore, the low regime becomes critical. These critical aspects may yield a high sensitivity of the measured drag to the initial conditions and to the perturbations induced by the patch vibrations.
Therefore the eddy blocking efects, observed on in terms of velocity ield, ap-pear to yield the expected drag reduction. At f∗
a = 7 (210 Hz) the largest drag reduction is obtained. The speciic percent gains in drag and lift are:
∆D = −13, 48 + / − 1.8% (with incertitude : 3σ) ∆L = +1.58 + / − 1.12% (with incertitude : 3σ),
being σ the standard deviation of the measures (not the measurement accuracy). At St = 6.3 190Hz the largest lift augmentation is obtained. The corresponding percent gains read:
∆D = −4.80 + / − 1.08% (with incertitude : 3σ) ∆L = +2.17 + / − 0.65% (with incertitude : 3σ),
Signiicant efects of piezo-actuation are found both on lift and on drag co-eicient. By the way high frequency–low amplitude trailing edge actuation was irst conceived speciically to reduce drag within the framework of the present re-search project. Therefore details on drag behavior are provided by analyzing the results achieved in terms of pressure measurements in the following. Speciically the actuation at f∗
a = 7 (210 Hz), where the maximum gain in drag is found, is considered. Pressure measurements – especially if performed on the trailing edge – provide a good indication of the phenomena occurring in the wake, as low pertur-bations propagate in each direction, being the Mach number much smaller than the unity everywhere in the domain. In order to check the reliability of pressure measurements the same approach adopted for the balance acquisitions is followed. Namely, for each excitation frequency, several measurements are carried out al-ternating non-actuated and actuated runs. The maximum diference in terms of measured mean values is 1% among all the runs, for any of the considered ex-citation frequencies. The statistical stability of measurements without actuation is veriied in the same manner. In this case diferences between runs are below 10−4%.
Figure 3.31 shows the power spectral density (PSD) of the pressure luctuations measured with trailing edge actuation at St = 7 (210 Hz) (HFVTE activated) and without actuation (MFC OFF), respectively. The plot on the bottom is a blowing up of the top counterpart on the area surrounded by the rectangle. The trailing edge actuation provides a shift of the low modes, compared to the non-actuated case. Namely, peaks at the actuation frequency, as well as at the corresponding super-harmonics and sub-harmonics are observed. At the same time the peak at
St = 9.5(285 Hz), clearly visible on the PSD of the non-actuated case (observed on
loads spectra as well), has diminished by 17% compared to the mean spectral level when actuating at f∗
a = 7(210 Hz). In fact actuation adds new peaks in the power spectral density, but the corresponding low modes result less detrimental for drag, relative to the natural peak at St = 9.5 (285 Hz). It’s worth remarking that the peak at St = 9.5 (285 Hz) highlighting Kelvin Helmholtz instabilities is consistent – in terms of Strouhal number – to the results reported in the previous section for a smaller Reynolds number, as well as to the estimations of Ref. [Szu+15] for transonic low conditions.
Good indications of the low instabilities are also provided by the statistical moments of the measured pressure [Nor11]. The variance, the third order (skew-ness), and the fourth order moments (latness) are computed on the time histories of pressure measures for excitations at f∗
a = 7 (210Hz), and for the static conigu-ration. The percent diferences between the actuated and the non-actuated cases are reported in Table 3.3:
10−1 100 101 10−8 10−6 10−4 PSD( δP) f a * = 7 Static baseline f a * =7 HFVTE actuation 101 10−8 10−6 10−4 St PSD( δP)
Figure 3.31: PSD of pressure luctuations measured on the wing section with actuation at f∗
a = 7 (210 Hz) and without actuation. On the bottom the same plot is blown up around f∗
a = 7 (210 Hz).
Quantity Percent diference between actuated and non-actuated
Variance (RMS) -7.66%
Skewness -36.25%
Flatness 13.03%
Table 3.3: Percent diference in statistical moments between the measures at f∗
a = 7 (210Hz) and those of the static coniguration.
The actuation at f∗
a = 7 (210 Hz) leads to a smaller variance with respect to the baseline coniguration. This is consistent with the results obtained in terms of drag. Indeed a reduction in the low instabilities related to large vortical structures, i.e., in the pressure variance, yields a decrease in pressure drag. The skewness is related to instabilities in low statistics. For a more stable wake, with less intense shedding phenomena, a smaller skewness (to be meant with sign) is expected. Actuating at f∗
a = 7 (210 Hz) provides a reduction in skewness with respect to the static coniguration, accordingly to the measured drag downturn. The increase in latness encountered for the actuated case is also in agreement with the observed drag reduction. Indeed latness is larger for more regular lows, where weaker shedding phenomena are encountered. This actuation provides a vortex breakdown for the largest coherent structures and yields an upscale in the turbulent cascade from smaller scales towards larger ones.
Similar results on forces can be found at lower velocities. Figure 3.32 presents lift measurements from an accurate balance at Reynolds number Re = 500 k. Depending on the actuation frequency, lift improvement above 2% is measured. Each of the measured points in Figure 3.32 comes from two diferent runs. The sequences of the tested actuation frequencies have been randomly generated to avoid any dependence from a measure to another. Lift measurement accuracy has been evaluated to +/ − 0.3% for this experiment.
0 50 100 150 200 250 300 350 400 450 −0.5 0 0.5 1 1.5 2 2.5 Actuation frequency (Hz) ∆ c L 0 5 10 15 20 25 30
Re=500k AoA=10° Initial camber
Reduced actuation frequency (f
a *
)
Off
Full actuation
Figure 3.32: Percent gain of mean lift coeicients obtained with maximal HFVTE amplitude actuation, relative to the non-actuated case. Experiments are done at
Re = 500 k
3.9 Conclusion
This chapter presents an experimental study of the electroactive morphing efects on the aerodynamics and time-dependent low structures in the wake of an Air-bus A320 aerofoil with piezo-actuated vibrating trailing edge. Camber control has been achieved using Shape Memory Alloys. Therefore, high frequency-low amplitude trailing edge actuation has been performed by wind tunnel tests. The angle of attack was set to 10◦. Velocity measurements have been carried out at
Re = 0.5 · 106 in the near-wake region by TR-PIV. A detailed investigation of
the mechanisms modifying the eddy structure due to morphing has been done by means of the averaged velocity ields, Proper Orthogonal Decomposition and by spectral analysis. The aerodynamic forces and wall pressures on selected points have been measured by means of an aerodynamic balance and pressure transducers, respectively. A speciic range of cambers and trailing edge vibrations have been depicted yielding a signiicant increase of lift in the order of 27%, where 4% are achieved thanks to the small amplitude vibrations. Concerning the neutral con-iguration (clean wing), the piezo-actuated Higher Frequency Vibrating Trailing Edge signiicantly afects the low response. Namely:
• a vortex breakdown is observed for the largest coherent structures;
• an upscale energy transfer from smaller scales towards larger coherent ed-dies occurs. A signiicant reduction of large scale instabilities is obtained – approximately 20 dB power reduction (99.9%) of the predominant frequency peak is obtained.
• a reduction in pressure drag and an increase in lift are observed. Approx-imately 5% of drag reduction and a 2% lift enhancement is measured in optimal conditions. Beyond this study, such macroscopic changes are linked
signiicant changes in wake dynamics. Important reduction in wake’s width together with efects upstream the actuation are visible on PIV measures of Figure 3.14.
A wise choice in amplitude and actuation frequency has to be made to ensure the beneits without creating unwanted actuation-induced vortices. The present chapter substantiates the potential feasibility of hybrid morphing actuation as a novel means of improving aerodynamic performance by manipulating the near wake turbulence.
In a next step, the coupling between the camber control and the vibrating trailing edge is to be investigated in more detailed. Finally a closed loop control based on the best actuation frequency is currently studied.
Acknowledgements
The authors are grateful to Airbus and RTRA-STAE Foundation as well as the Direction Generale de l’Armement - DGA that provided funding for this research. The authors are also grateful to Dominique HARRIBEY, Karl Joseph RIZZO, Robert LARROCHE, Sébastien CAZIN, Moïse MARSHALL, Christophe KOR-BULY, Gilles HARRAN and Philippe MOUYON for their useful advice and help.
CHAPTER
4
Design through
optimization: true scale
cambered control lap
“Everything should be made as simple as possible, but not simpler.”
Albert Einstein This chapter is written like an article and will be soon submitted.
flap
force
SMA
can
two
section
split
spring
cost
one
low
w
in
g
ela
st
ic
co
st
s
ribs
edg e leve r part due span like must cold also first free a rm presents used so lu tio n high large po s itio n s s ma ll front limi ts well table e rro r result done total vie w thus lo c u s hig her Shape using rib issue flight mo d e l wires area i.e skins life s tra in related aircraft fla ps smart c a mb e re d every scale allow T h e re fo re new h_2 always arms Two made tip final deals devices red spar On e h_1 d e fo r me d larger Sketch N.m return cross act apply uses Force step Flag M_u limi t room loads right p ro gra m rang e work Skin TRL areas cycle errors c h a n g e true parts taut stress hot rotations p u ll Alloy ratios consists Cost tensions mean non sizes found device sum study bio -in spired named come s added hung h_Xi located less alloys M_sp carry global case works flow wa y test fit a ctiv e thin F _a nt Thus size co lo r blue top re ar norme d loop bottom set sized Prev ious Taking upward Areas 100(1-e co de d ones L_min avoid First slim four stay linked EQ:F PS penalty unique relies Ev alu a te fit tin g 1:N finally s ta r ts plus static side upper levels tests ea rly circles takes allow s c ove rs worst tak e achieve max add draw will time stretch EQ:s k in2 fuel CAD Thill ma y L yu2 01 5 D esp it e wings fact ad ap te d Flap rela xed q uite worth load value Get M orp h in g F_X bad drag 0.02Nm bird designing Illustration covered Now coated F_y heterogeneous aspects skin's Due going slide pre-stress artificial flutter happen Young y_p decoupling 2(_p protect aluminum htan impose stands contact ensuring glide T_max heavy PSp an8H_ma x 3]4Et closed mandatory thick EIS 22L pre-stresses extremal equations ensures Early close hF_y Flipo f_1 fabric observed M_frot paid even approxima tely end justify EQ:P are toCost consider wide spots move decreases exist last refe rence 142.3Nm 4.7 Nm 368.1Nm impact 0.4Nm easiness Multi-objective front's grateful focus causes comp aring taking choose useful else help Maxime terms crossing ability corner outlooks target Deta iled inclining anymore macro Side place necessary activ ation concerns squared inverse averaged bound variable given methods rema in i-th gap insignific ant implementation h_Yi 0 defin ition compares many randomly min lasts bend rotate spaces detected remo ved factor half zero knowing loops sound come rules converge stop core Angle Sheller wake fractions hybrid Scheller2015jfs safety lift pre senting valid campaign brake synergy layers years ten driven fix Top Airfoil Bottom consumer fromM ishiganOp tiTE proof define covering region scope acce pted alloy topic bottle explain led mili tary regard Level experiments propose frame work save Air overcome show fie ld CLEEN use dual operating package Compliant features cases see compare chose cover informa tion giving per try Limits abrasion In deed keep Whilst tend cable depict H=P g reen orange systems jump s efficiency next p refer red mu scle analogy axes lig ht fits func tion's now Model centers inside Hin ge's quasi-static slow Generally longer eases coupling draws tailo r commonFigure 4.1: Word cloud of this chapter content (www.wordclouds.com).
Abstract Morphing requires a structure lexible enough to be easily deformed whilst being stif enough to withstand the aerodynamic loads. This paradox leads to cur-rent issues in skin and actuator design. This cahpter presents a multi-criteria optimization process that con-siders the wing as a system doing diferent functions. Each function is addressed through diferent techno-logical solutions. Diferent solutions for articulations, agonist-antagonistic shape memory alloy actuators, skin or feathers are described in the chapter. Taking into ac-count industrial constraints, the optimization results in a feasible, low weight, low power consumption morphing wing design. Finally the optimal wing is designed based on the feasible optimized result.
4.1 Introduction
This work takes place within the design of the Large Scale Prototype of the ongoing European project SMS1, as detailed in the outlooks of this manuscript 4.7.
Limiting energy consumption has become a central concern for reducing the aircraft operational costs. Improving aerodynamic performance is a way to reduce the fuel consumption during light.
Current airfoil shapes are generally optimized for one working point, corre-sponding to nominal cruise conditions. During light, the altitude, the weight and the speed are continuously changing. Hence this design is suboptimal for the whole aircraft mission. Traditional solutions to control and adapt the wing shape (like slats and laps) exhibit limited performance ranges [Bar+11]. Changing the shape of the wing during a mission can save several percents of fuel for a regional passenger aircraft [LM15]. The concept of real time shape adaptation enabling multipoint optimization is called morphing.
Within the framework of aircraft aerodynamic performance, morphing has been known for decades [Bar+11]. It was demonstrated that camber control of the trailing edge of a wing is very eicient to improve airliners performance by Lyu et al. [LM15]. It is also shown that morphing applied to a limited part of the airfoil chord may feature efectiveness comparable to that of entirely morphed airfoils. Additionally, the required deformations result in a change of camber by about 2% of the wing chord length, which corresponds to 7% of the lap chord length.
Despite the fact morphing wings have been used for military ighting aircrafts, research concerning industrial passenger aircrafts has not led to commercial
cations. One can explain this as technology is not mature enough, the potential gains are known but reliability, maintenance, mass and power consumption of the added devices deteriorate the assessment. The skin or the interface between the structure and the outside airlow is the current technological bottle neck. Some studies simply do not deal with this issue (experiments at low velocity do not ex-hibit issue with elastomeric skins), others propose a degraded skin (i.e. corrugated skin for example that cause turbulent transition). As the skin is a part of the mor-phing system, it has to be taken into account. Thill et al. [Thi+08] draw review of morphing skin and its challenges. With this regard relatively high Technology Readiness Level (TRL) projects, targeting current industrial airliners at true scale, were undertaken. The European research program SARISTU2focuses on operating
cost reductions as well as on improving the aerodynamic performance. One work package of SARISTU deals with a morphing wing trailing edge [Dim+16]. The device is based on servomotors driving an articulated structure. The European re-search program CleanSky3 works in this direction as well. It focuses on a lap with
twofold actuation, provided by servomotors and redactors respectively [PAM16]. The dual actuation allows for camber control during the diferent light phases/as-sets. Another trailing edge morphing concept, called Adaptive Compliant Trailing Edge, was developed by NASA in cooperation with FlexSys Inc.4. This concept
features an adjustable structure which can be actively deformed. Endurance light tests for this concept were performed and described in Ref. [KFC16]. This solution was proved to yield aerodynamic beneits and its efectiveness and airworthiness are being ultimately assessed.
However these new adaptive structures are actuated through conventional ac-tuators like electromechanical or hydraulic servomotors. Recent advances in the ield of smart materials show the potential to overcome diiculties to make a wing both stif enough to withstand the loads, and lexible enough to be easily de-formed [Bar+14]. The related research focuses mainly on low TRL, mainly applied to low scale Micro Air Vehicles. Among electroactive materials, Shape Memory Alloys (SMAs) are the most frequently used. SMAs are characterized by ther-momechanical behaviors, and most applications use an electrical resistor or the resistance of the SMAs themselves to activate the transformation. Diferent mor-phing concepts were developed, an overview of which is presented by Barbarino et al. in [Bar+11]. A counter example of the low TRL research is a recent industrial application of the SMAs within the Boeing CLEEN research program. A topic of the program consists in a lap actuated by a SMA twist tube, [CM16]. Safety is-sues have been solved using a redundant hydraulic actuator. It also provides brake
2http://www.saristu.eu
3http://www.cleansky.eu/
4http://www.lxsys.com/
and damping functions to maintain a delected lap without requiring actuation energy. A light test campaign has been successfully done, reaching TRL 7.
In the works previously mentioned the desired operation is generally accom-plished using one speciic smart material. But a combination of diferent smart material leading to a synergy is possible. As the SMAs can achieve large deforma-tion at low speed, and as piezoelectric material can achieve small deformadeforma-tion at higher speeds, a combination of both material can enhance the global performance of the actuation. This is the proposed approach of the synergistic smart morphing
aileron [PFI15]: the combination of a SMA actuated hinge followed by a lexible
piezoelectric driven trailing edge. Another approach is an airlow point of view. Lift and large low instabilities can be controlled through camber control whereas smaller instabilities responsible for drag and noise can be modiied through active turbulence control of the trailing edge wake’s shear layers. For ten years of collabo-rative efort from two laboratories (LAPLACE and IMFT) this approach has been leaded to the electro-active hybrid morphing concept: a low frequency (< 1 Hz) camber control (∼10% of the chord) thanks to SMAs and a higher frequency vi-brating trailing edge (fractions of millimeters up to 400 Hz). It was demonstrated that the low dynamics are signiicantly afected by the trailing edge actuation. The wing’s wake energy was reduced, leading to an improvement in aerodynamic performance, according to Sheller et al. in [Sch+15].
Based on an Airbus commercial aircraft, this chapter deals with a morphing lap design. After irstly describing the morphing lap concept with design re-quirements; diferent used technologies for actuator, skin and hinges are modeled. Thirdly, the optimization problem is described before presenting important results. Finally the chosen design is followed by a conclusion.
4.2 Morphing wing concept and
modeling
The proposed morphing concept is applied to a lap but the assumptions are valid for a whole morphing wing. The function assessed by the proposed morphing is to adapt the wing shape coniguration. This allow to change the shape that corre-spond to lower drag for every light step. The high lift function is not addressed so that safety is not critical for this function. The morphing lap is based on an articulated ribs where Shape Memory Alloy actuators control the rotations of the elements around the hinges. This concept is irstly described. Then input geom-etry and loading are deined before the modeling of the whole camber controlled lap.
4.2.1 Articulated concept
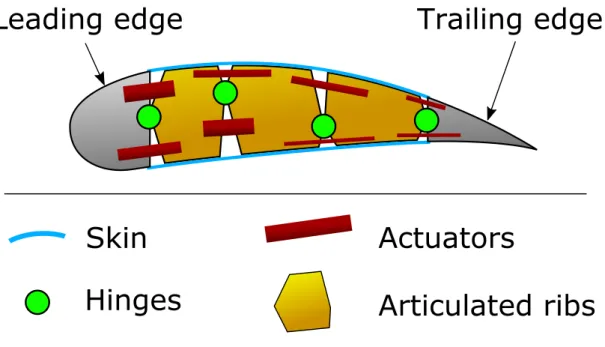
The proposed concept, presented in Figure 4.2, is decomposed fourfold:
• articulated ribs deine the geometry and carry the other components. They have to withstand the internal and external (i.e. aerodynamic) forces, whilst being low weight.
• hinges allow the rotation of the articulated ribs. Parts of forces are transmit-ted through these components without generating much parasite force (or torque) when rotated.
• actuators are devices that transmit mechanical energy to the structure. The actuators are responsible for the shape control and have to counteract aero-dynamic forces as well as some internal forces coming from the other compo-nents.
• skins or covering devices guarantee the airtightness of the wing, transmit the aerodynamic forces to the structure and ensure a smooth shape during mor-phing. The skin must endure deformation without unexpected displacements like bumps or wrinkles.
Leading edge
Trailing edge
Articulated ribs
Hinges
Actuators
Skin
Figure 4.2: 2D illustrative sketch of the proposed concept. Articulated ribs are placed between ix leading edge and trailing edge. Actuators and speciic skins are located within the morphing lap.
Additionally, mechanical stops are provided to limit the rotations of the articu-lations, thus preventing overloads in actuators. The internal structures represented by the articulated ribs actually consist in an engineered mechanical structure com-posed of ribs and spars. The ine design of this structure is outside the scope of this study, it is accepted that the lower the force in the structure, the lighter the structure. The proposed actuators consist in cylinder like actuators. Composed of shape memory alloy wires, they are able to pull on the articulated ribs, thus imposing the rotations. More detailed are presented in 4.3. One can notice the presented concept is not breakthrough, but the original purpose of this study is the comparison of the diferent technologies that can be applied.
4.2.2 Requirement and objectives
The previous concept performance assessment is based on a representative lap of an industrial passenger aircraft. To simplify the design, the lap’s aspect ratio is assumed rectangular, with 1 m chord by 2 m span. The airfoil proile is presented in Figure 4.3. The morphing region targeted in the present chapter extends from 15% to 75% of the chord length. The trailing edge is committed to the integration of a Higher Frequency Vibrating Trailing Edge, corresponding to an actuation concept that manipulate the turbulence to enhance aerodynamic performance, developed in other studies of the authors, [Sch+15] and [Sch15]. The speciied load is also presented in Figure 4.3. This vertical surface force distribution is assumed vertical and constant along the wing span. Globally, the resulting aerodynamic force on the 2 m span lap is about 1 ton force. One can notice that the higher force density are located at the trailing edge, thus the rear part of the wing carries lighter forces; this is beneicial for actuation requirements. This force speciication is representative of nominal working points of the lap during all light conditions where actuation is needed.
Regarding the objective, a lap design must perform the camber control func-tion. Two objectives shapes are deined. Starting from the neutral initial shape, the lap can reach a low cambered shape (corresponding to upward displacement of the trailing edge tip) or also a high cambered shape (corresponding to a downward displacement of the trailing edge). The two objective shapes are presented in Fig-ure 4.4, on the top two red airfoil proiles. According to the optimized shapes from [LM15] as well as Airbus speciication, a vertical trailing edge tip displacement by about 7% of the lap chord is enough to optimally increase the cruise performance – 10% is selected for the design of a proof of concept. The proiles’ deformations have been interpolated by polynomial; then the polynomials are applied to current lap proile to obtain the high and speciied low cambered shapes. Finally, the op-timized designed lap has to respect the morphing shape while being as lightweight
and low-energy consumer as possible – the objective formulations are detailed in the following.
4.2.3 Model
As the morphing concept and its objective and speciications are deined, the opti-mization model is now deined.
4.2.3.1 Shape calculation
Starting from the positions and the rotation angles at every hinge, the proile is cut in sections corresponding to the diferent ribs sections. Then, using rotation matrices, every section is rotated. After the calculations of the new positions of the hinge centers, the rotated sections are assembled together. It results a deformed lap which is lightly faceted. To evaluate the relevance of the obtained shape, ver-tical position diferences between the obtained shape and the objective shape are calculated for the upper and lower side of the airfoil proile. For each of the two
ob-0 0.25 0.5 0.75 1
0 5 10 15
Crossflow load (kPa)
x (m)
0 0.25 0.5 0.75 1
Front spar Rear spar
Figure 4.3: Top: Airfoil proile. Camber controlled part is located between the front spar and the rear spar. Bottom: distribution of the resultant surface vertical force loading.
jective shapes, articulation angles are found by minimizing the diference between the current articulated lap proile and the targeted proile. The function’s cost is deined as the sum of the mean absolute error plus the maximum absolute error. This minimization is done thanks to a multi-variable gradient based constraint algorithm5. Figure 4.4 presents an optimized articulated lap with superimposed
objective.
4.2.3.2 Force balance
Figure 4.5 schematically represents an articulated lap with four hinges. The lead-ing edge is recessed in the spar. Actuators are present at every articulation, in parallel with the hinge. As the morphing displacement is slow, quasi-static as-sumption is done, thus the Newton’s second law can be applied on a selected wing section Ω comprising a rib section and all the following ones until the trailing edge.
5Mathwork MATLAB fmincon function.
0 0.1 0.2 0.3 0.4 0.5 0.6 0.7 0.8 0.9
−0.1 0 0.1
High cambered shape
0 0.2 0.4 0.6 0.8 1 −0.1 0 0.1 0.1 0.2 0.3 0.4 0.5 0.6 0.7 0.8 0.9 1 −5 0 5 x (m) Error (mm)
Error between objective and actuated flap Intrados Extrados (a) 0 0.2 0.4 0.6 0.8 1 −0.05 0 0.05 0.1
Low cambered shape
0 0.2 0.4 0.6 0.8 1 −0.05 0 0.05 0.1 0.1 0.2 0.3 0.4 0.5 0.6 0.7 0.8 0.9 1 −10 0 10 x (m) Error (mm)
Error between objective and actuated flap
Intrados Extrados
(b)
Figure 4.4: From top to bottom: The two objective shapes superimposed with the original non-deformed proile; deformed shape of the articulated morphing lap itting the objective; error between the articulated lap and the objective. (b) presents the low cambered shape with upward trailing displacement, whereas the high cambered shape characterized by downward trailing edge displacement is presented in (a).
An example of the selection is blue highlighted in Figure 4.5. The resulting forces and moments expressed at the hinge location are:
• Actuators’ participations: Force Fact = ΣFacti and Mact = ΣFacti · li, where
li are the lever arms. The actuators inside the selected wing section Ω. • Hinge’s participations: Parasite moment due to elasticity or friction in the
hinge Mhinge and Fhinge the resulting force transmitted to the previous rib through the articulation.
• Aerodynamic forces: Resulting force Faero = ∫
ΩP (x) · dx and resulting
mo-ment Maero =∫
ΩP (x) · x · dx
The force balance is presented in equation 4.1.
Fhinge = −(Fact+ Faero)
Mact= −(Mhinge+ Maero)
(4.1) Two important results sum up this balance: 1- the force transmitted to the previous ribs Fhingeallow the sizing of the hinge; 2- the resulting moment allow for the sizing of the actuator moment Mact, where the actuators’ forces and lever arms are design variables.
Selected wing
section
Ω
F
act
1F
act
2F
hinge
x
P(x)
Figure 4.5: Sketch of the lap’s force balance model. Among the 4 articulations of this design, the force balance is presented for the 2nd one. The parasite hinge moment is not represented for greater clarity.
4.2.3.3 Hinge technologies
Various technologies realize mechanical articulations between two parts at low rotation angles. The speciications of the articulations are to transmit the forces with minimal movement in every direction and rotation. Excepted for the rotation axes where the parasite torque has to be minimum. The articulations have to be as light as possible and it with the available room. Then two technological families exist. The irst one is based on deformable parts, i.e. metallic bending beams or elastomer links. The behavior of such hinges can be modeled as elastic links, thus the parasite moment is linked to the rotation angle and the stifness of the hinge. This stifness is determined by the sizing that depends on the transmitted forces. The second family is based on gliding bearings. As the rotation angle and velocity ranges are small, ball bearings are not suitable. The parasite torque is due to friction, which is linked to the transmitted forces.
These diferent hinge technologies have been compared regarding the morphing lap sizing. For brevity purpose, the models are not detailed. For gliding bearings and elastomer links, routines have been coded to automatically select a hinge within a subcontractor catalog that its the requirements. For the metallic bending beams, the beams must be as lexible as possible whilst withstanding the load with no buckling. To avoid large translations, the beams have to be as shorter as possible, but thin enough to stay slim. A routine has been coded to size the elastic beams while respecting the constraints. All these routines are parts of the sizing code described in this chapter.
4.3 Actuator modeling
The proposed morphing concept relies on actuators using Shape Memory Alloy (SMA). This section irst shows that SMAs are suitable for the actuators. Then actuators are modeled and actuation topologies are described. It is important to notice that non linearity like material hysteresis, slake SMA wires or dependencies between actuators are not discussed in this chapter. Those speciic issues are assumed to be addressed by suitable controllers.
4.3.1 Shape Memory Alloy behavior
Amongst smart materials, SMA are metallic alloys that exhibit an impressive thermo-mechanical coupling, due to crystallographic phase changes at microscopic scale. They have been studied for decades, Lexcellent draws a complete handbook about SMAs, [Lex13]. The most common are based on Nickel-Titanium alloys