HAL Id: tel-02407434
https://hal.inria.fr/tel-02407434
Submitted on 12 Dec 2019
HAL is a multi-disciplinary open access archive for the deposit and dissemination of sci-entific research documents, whether they are pub-lished or not. The documents may come from teaching and research institutions in France or abroad, or from public or private research centers.
L’archive ouverte pluridisciplinaire HAL, est destinée au dépôt et à la diffusion de documents scientifiques de niveau recherche, publiés ou non, émanant des établissements d’enseignement et de recherche français ou étrangers, des laboratoires publics ou privés.
Quality Management of Information Systems - A
Human-Centric Point of View
Virginie Thion
To cite this version:
Virginie Thion. Quality Management of Information Systems - A Human-Centric Point of View. Databases [cs.DB]. Université Rennes 1, 2019. �tel-02407434�
HABILITATIONA` DIRIGER DES RECHERCHES
Universit´e Rennes 1 Sp´ecialit´e Informatique
par Virginie THION
QUALITYMANAGEMENT OF INFORMATIONSYSTEMS
–
A HUMAN-CENTRIC POINT OFVIEW
Soutenance publique le 10 octobre 2019
David Gross-Amblard, Professeur, Universit´e Rennes 1, France, examinateur Mohand-Said Hacid, Professeur, Universit´e Lyon 1, France, rapporteur
´
Oscar Pastor Lopez, Professeur, Universidad Polit`ecnica de Val`encia, Espagne, rapporteur Olivier Pivert, Professeur, Universit´e Rennes 1, Lannion, France, examinateur
Chantal Reynaud, Professeure, Universit´e Paris-Sud XI, France, rapportrice
2
Remerciements.
Un grand merci aux coll`egues rapporteurs de mon manuscrit et membres du jury de cette HDR.
Merci `a ceux qui ont cru en moi, et m’ont offert de m’accueillir au sein de leurs ´equipes : Serena C. et Nicole B. (poste de doctorante), puis Franc¸oise G., Marie-Luce P. et Sylvaine N. (poste d’ing´enieur-chercheur `a EDF), puis Camille S.-R. et Philippe R. (poste MCF Paris Dauphine), puis Michel S., Michel C. et Philippe R. encore (mutation MCF au CNAM Paris), puis Oliver P. (mutation MCF `a l’Univ. Rennes 1, ENSSAT Lannion). Merci `a tous les coll`egues (universitaires et industriels) avec qui j’ai eu le plaisir de collaborer, et qui m’ont tant apport´e scientifiquement et humainement.
Mes remerciements tous particuliers vont `a quelques chercheurs que j’ai eu la chance de cˆotoyer durant mon parcours professionnel, remarquables mod`eles de patience, bonne humeur et constance, qui m’ont si r´eguli`erement apport´e leur soutien bienveillant : Nicole B., Syl-vaine N., Philippe R. et Olivier P. Merci ´egalement aux enseignants du syst`eme universitaire (LMD informatique de l’Universit´e Paris XI d’Orsay en l’occurrence) pour leur solide en-seignement qui a constitu´e le socle des connaissances sur lesquelles s’est appuy´e mon par-cours menant `a cette HDR. Je suis heureuse d’avoir ´et´e form´ee `a la fac, environnement si pr´ecieux de formation de qualit´e et d’ouverture d’esprit.
Mon parcours n’aurait pas ´et´e possible sans le soutien infaillible de ma famille : mon alter ego Franc¸ois et nos petites merveilles Loulou, Chouchou et Mimi, mes parents Claude et Gilles, et mon fr`ere Arnaud. Mille mercis ne suffiraient `a exprimer ma tendre gratitude.
`
A ceux dont la pr´esence au quotidien me permet de maintenir le cap lorsque cela est n´ecessaire : mon oncle Jean-Louis B., Marie-No¨elle A., Sonia D., Ga¨elle M., Sandrine P., Delphine D., Del-phine B., Elise et Vincent B., S´ebastien L. M., Jean-Paul F., Salima B., Nathalie et Bruno C. Mon affectueuse reconnaissance vous est individuellement t´emoign´ee.
Je me dois de saluer quelques uns suppl´ementaires qui m’ont indirectement soutenue tout au long de la phase de r´edaction : Ella Fitzgerald, Christophe Andr´e, et Saint-Joseph (cuv´ee 2016).
3
`
A mon oncle Jean-Louis dont la joie de vivre, l’humour et la bienveillance manqueront cruellement `a ma vie.
Abstract
This Habilitation `a diriger les recherches presents a summary of some of my research activi-ties, focusing on my main and favourite research theme: Quality Management in Information Systems. I have conducted these activities as a research engineer at EDF Research & Develop-ment (Clamart, France) from 2004 to 2008, and then as an Associate Professor in Computer Sciences at Universit´e Paris Dauphine in the LAMSADE laboratory from 2008 to 2010, at CNAM Paris in the Vertigo team of the CEDRIC laboratory from 2010 to 2013 and finally at Universit´e Rennes 1 in the DKM/Shaman team of the IRISA laboratory since 2013.
C
ONTENTS
1 Preliminary notions 9
1.1 The information system . . . 9
1.2 Managing the quality of an information system . . . 16
2 Assessing quality 21 2.1 Assessing the quality of data . . . 25
2.1.1 Defining the quality of data . . . 25
2.1.2 Measuring the quality of data . . . 28
2.2 Assessing the quality of a business process . . . 30
2.2.1 Defining the quality of a business process . . . 30
2.2.2 Measuring the quality of a business process . . . 35
2.2.3 Analyzing the results . . . 37
2.3 The limits of a quality assessment . . . 38
3 Dealing with quality issues: Improving... or not 41 3.1 Improving a business process . . . 47
3.2 Quality-aware querying . . . 50
3.2.1 Quality-aware queries for graph-based data . . . 50
3.2.2 Flexible query language for graph-based data . . . 56
4 Conclusion and perspectives 63
I
NTRODUCTION
In everyday life, we often face the consequences of poor quality in information systems. This may be a letter not delivered to the expected recipient because of an inaccurate address, a misfilled field in an administrative form that blocks the enrolment of our children to activities, a booking not taken into account because of a defective software, an unreachable web site or application, etc. Quality problems are plentiful and may have a lot of negative repercussions on the performance of an organisation, for instance the loss of commercial opportunities (by missing an order or a prospect, or by losing an unsatisfied customer), lawsuits, slower pro-cessing operations, higher maintenance costs, etc. As quality problems may have significant impacts and costs, which seriously affect the efficiency of organisations and businesses (En-glish, 1999; Eppler and Helfert, 2004; Batini and Scannapieco, 2016), the quality management of information systems has become a serious issue for the companies and the research com-munity.
The quality management of an information system is a complex subject. The information sys-temitself is an intricate concept covering multiple components that interact with each other: databases, software, business processes, and humans. The notion of interaction becomes tricky when it concerns humans, which have their own individual backgrounds, perceptions and ways of thinking. Also, the notion of quality is a multidimensional concept whose management is complex. First, eliciting quality requirements is a methodologically delicate problem. Second, the elicited quality criteria may concern many facets of the quality, which may be correlated one with each other, and also concern diverse components of the information system, which may again be correlated one with each other.
As an illustration, let us consider the quality of data in the Customer Relationship Management (CRM) database, embedded in the information system of a company. The database contains customers contact details, like the name, the phone number, the postal address and the e-mail address of each customer. Some of these data may suffer from quality problems: some of them may be inaccurate, incomplete, deprecated or imprecise. In the company, various
6 CONTENTS
business users retrieve data from the database, in order to achieve their business goals, which may be different from one user to another.
For an entity that sends the customers’ invoices, the focus is (i) on the availability of the in-voiced amount, which of course has to be accurate, and (ii) on the postal address, which has to be filled out, up-to-date and sufficiently precise (let us note that a postal address does not necessarily have to be perfectly precise as the post office is often able to deal with some im-precision). For another entity in charge of prospecting the customer portfolio, by e-mail, in order to promote new products, the e-mail has to be filled and exact (we can assume for the illustration that the rest of the customers’ information does not really matter for this usage). This very simple use case shows that the users of the information system have different re-quirements concerning the quality of the system, depending on their business goals. A user may be concerned by some quality issues for a specific usage, by some other issues for another usage, and they can be completely different for another user. Of course, the quality require-ments do not only concern the data of the system, but also the system itself (for instance, they can also concern the quality of its services, like the availability of its access point), and the quality of the system does not only concern the users’ satisfaction (for instance, it also con-cerns the quality of the information system processes). Then the first question that arises is: ”Given an information system and its users, which are the quality requirements, and does the system meet them?”
Let us continue our example of the CRM database. We now consider a third entity that uses the database. This entity is composed of the operators in charge of the customer hotline. They must quickly respond to the customers’ requests. For this entity, the availability of the database (quick answer of the database management system to data queries) is important. Let us now assume the data freshness is not satisfactory for the first entity (we recall that the data freshness – up-to-date information – is important for the first entity). This leads this entity to ask for an improvement of the freshness, by adding a refreshment process in the system. Is it a relevant measure ? Maybe not because adding a refreshment process on the database could negatively impact the availability of the database, needed by the thirst entity... So, if the system does not meet the quality requirements, another complex question arises: ”How to deal with quality problems?”
Roughly speaking, for managing the quality, two main issues have to be considered. The first issue is the assessment of the quality, whose goals are to define and examine the quality of the system. The second issue consists in dealing with quality problems, either by improving the quality, or by making the usage of the system as robust as possible to quality problems. In these problems, the human being is centric (i) as a stakeholder (internal or external to the system) for whom the quality of the system must be ensured, or (ii) as a “component” of the
CONTENTS 7
information system because humans are involved in its business processes.
This document supporting my Habilitation `a Diriger les Recherches reports on some of my contributions, on the topic of the Quality Management of Information Systems – A Human-Centric Point of View. It is organised as follows.
Chapter 1 (Preliminary notions) presents background notions concerning the quality manage-ment in an information system. I clarify the concept of information system, and introduce the problem of its quality management.
A quality management process includes an assessment stage where the quality is first defined and then measured. Chapter 2 (Assessing quality) presents a synthesis of some contributions on the quality assessment of the data and of the quality assessment of the business processes of an information system.
Once the quality is assessed, the analysis of the quality report allows detecting quality prob-lems, and deciding how to deal with them. Two approaches may be thought of. A first one consists in improving the quality, that is to say repairing quality problems or system malfunc-tions. Another approach consists in using the information system as it is, meaning without improvement, taking quality problems into account when the system is used. Chapter 3 con-cerns these scientific problems. It is divided into two sections. Section 3.1 (Improving a business process) presents a synthesis of some contributions on the improvement of a business process (first approach). Then, Section 3.2 (Quality-aware querying) presents a synthesis of some contributions for extending query languages in order to improve their usability when queried data have quality problems (second approach).
Chapters 2 and 3 start with a summary of my activities related to the considered topic. I indicate in which scientific projects the topic was investigated, the supervising activities, the institutions I collaborated with, and the associated publications.
C
HAPTER
1
P
RELIMINARY NOTIONS
In this chapter, I present some background notions underlying the problem of the quality man-agement of an information system. In Section 1.1, I present the notion of information system, and then, in Section 1.2, I present the fundamentals of its quality management.
1.1
The information system
The notion of information system was intensively studied in the literature. There is a consensus for generally defining an information system as a set of components that interact, in a complex environment, in order to support business goals. But things become more difficult when a precise definition has to be laid down. A lot of different formal definitions were proposed in the literature. They differ in the classification and the scope of the elements that compose the system and its environment.
Different points of view. In her PhD thesis, Grim-Yefsah (2012) reviewed about thirty dif-ferent definitions of the concept of information system in the literature. Among these defini-tions, two general trends emerge. According to their point of view, some authors restrict the information system to a computer-based system only, while some others consider the informa-tion system from a more global point of view, including the business organisainforma-tion and humans in the system.
A typical purely computer-based point of view of the information system is the one of Jes-sup and Valacich (2008), who propose the following definition : “Information Systems are combinations of hardware, software and telecommunications networks that people build and use to collect, create, and distribute useful data, typically in organizational settings.” Such a definition restricts the information system to a set of connected programs like front-end
10 1. PRELIMINARY NOTIONS
and back-end applications or database management systems, hosted in hardware components. Among the most restrictive points of view that can be found in the literature, Pawlak (2002) defines an information system as being a structured data set: “An information system is a data table, whose columns are labeled by attributes, rows are labeled by objects of interest and entries of the table are attribute values.”
Avgerou (2001) states that “what is generally called ’information system’ in the jargon of practitioners as well as academics cannot be meaningfully restricted to computer or com-munications applications within an independently delineated social environment.” In such a trend, some authors propose a more global point of view that includes human and organisa-tional features in the scope of the information system. This intrinsically includes not only tangible concepts that can be modelled like explicit knowledge, business processes or official social networks, but also intangible concepts like tacit knowledge, skills, intuition, informal social networks or professional affinities carried by humans that belong to the system and interact with it, and in it.
In a process-oriented point of view, Paul (2007) proposes the following definition of an infor-mation system. “The IS is what emerges from the usage that is made of the IT delivery system by the users (whose strengths are that they are human beings not machines). This usage will be made up of two parts: 1. First the formal processes, which are currently usually assumed to be pre-determinable with respect to the decisions about what IT to use. [..] 2. Second the informal processes, which are what the human beings who use the IT and the formal processes create or invent in order to ensure that useful work is done.” This author also insists on the fact that the information system is not a static concept. It constantly adapts to the evolution of business requirements and usages.
With a complementary goal-oriented point of view, Huber et al. (2006) define an information system as “an organized collection of people, information, business processes and information technology, designed to transform inputs into outputs, in order to achieve a goal.” This defini-tion goes further in the formalizadefini-tion of the components of an informadefini-tion system, identifying types of its components, that is to say the people, the information, the business processes and the technological artefacts.
Some authors consider that human actors are the primary elements of the information system. This is the case for Reix and Rowe (2002), who define an information system as a set of social actors that record and transform tangible concepts through information technologies and procedures1. This definition is clearly human-centric. The social agent has her/his own
1 This is a personal translation for the initial sentence “Un syst`eme d’information est un ensemble d’acteurs
sociaux qui m´emorisent et transforment des repr´esentations via des technologies de l’information et des modes op´eratoires.”
1.1. THE INFORMATION SYSTEM 11
psychological profile, reasoning, understanding and interpretation processes, business goals and context.
For Mason and Mitroff (1973), the information system can even be defined from one person for one usage by the following definition “An information system consists of, at least, a person of a certain psychological type who faces a problem within some organizational context for which he needs evidence to arrive at a solution, where the evidence is made available through some mode of presentation.”
According to the previous definitions, there can be an information system without a computer, for instance composed of people that use pens and papers in order to store information, and letters in order to communicate, but there cannot be an information system without a human being.
MANAGEMENT AND ORGANISATIONAL DIMENSION
Actors knowledge Information Business processes TECHNICAL DIMENSION Software information Hardware data supports based on
Figure 1.1: The information system (inspired by (Morley et al., 2004))
Alter (1999) distinguishes the management and organisational dimension of the information system from its technical dimension. This widely accepted point of view conducts to consider an information system that has two layers (Morley et al., 2004) that makes explicit the organ-isational and the technological parts of the information system. This is the definition that we consider in the following. Figure 1.1, inspired by the vision of Morley et al. (2004), is an il-lustration of this point of view. The technological layer is composed of software and hardware components. Data is stored in this layer and retrieved when needed by components of the man-agement and organisationallayer including the actors. According to a human-centric point of
12 1. PRELIMINARY NOTIONS
view of the information system, human actors use their knowledge, communicate with each other, transfer (or not) some information and knowledge. In order to achieve business goals, actors perform complex tasks made of activities that are logically articulated. The activities and their arrangement are formally defined in business processes of the information system.
The business processes. The International Organization for Standardization (ISO) (2000) defines a process as “a set of interrelated or interacting activities that transforms inputs into outputs.” Thomas H. Davenport and James E. Short (Davenport and Short, 1990) define a business process as “a set of logically related tasks performed in order to achieve a business outcome.” These definitions are intentionally concise in order to cover a large scale of contexts. According to Porter and Millar (1985), the business processes of a company are distinguished between the production processes, which involve the primary activities that allow creating and delivering products to the customers (e.g. factory processes, sales processes), the support processes, which provide the inputs and the environment needed by the primary activities (e.g. software development processes, managerial processes).
It is now well understood that the good governance of an information system includes its Business Process Management(BPM). The goals of Business Process Management are 1) to align the business processes onto the company business goals and 2) to control and improve the processes of the organisation. If the goals of Business Process Management (“why the BPM?”) have reached a consensus in the literature, different definitions of this notion (“what is the BPM?”) were proposed (Palmberg, 2009). A first movement considers the BPM as a part of managing the whole organization. A second movement considers the BPM as a structured systematic approach to analyse and continuously improve processes. Lee and Dale (1998) proposed a unified vision through the following definition: “Business Process Management is both a set of tools and techniques for improving processes and a method for integrating the whole organization and it needs to be understood by all employees.”
More concretely, BPM includes “concepts, methods and techniques to support the design, ad-ministration, configuration, enactment and analysis of business processes” (Weske, 2012). In order to be analysed, the relevant processes first have to be formalised. This is the modelling. The literature proposes various approaches, metamodels and languages for modelling busi-ness processes (Weske, 2012; Morley et al., 2011). The modelling languages make possible to abstract the real world in order to express the relevant elements of a process in the form of a graphical representation usually called diagram. In most representations, such a diagram is composed of activities2. and their sequencing, performed in order to achieve a business goal.
2
Let us note that the notion of activity itself is also subject to discussion. According to the vision, it may be de-fined as the most detailed level of work that is formulated, or corresponds to the transformation of an informational entity like an activity that makes an invoice change its state from unpaid to paid (see the discussion of (Morley et al., 2004) for details). This level of detail does not need to be considered in the following of the document.
1.1. THE INFORMATION SYSTEM 13
The representation of a business process can be data flow oriented, meaning that the modelling focusses on the transformation of data (inputs and outputs) across the activities of the process. This approach is usually adopted when the process is modelled in order to be automatically executed. Such a vision (voluntary) minimises interactions with humans.
The notion of business process from the point of view of the Information System commu-nity is based on another vision: the process is usually control flow oriented, meaning that the modelling focusses on the activities that may be performed by humans being, and their arrangement. The primary goal of this vision is to develop a common understanding of the process that involves different actors (Rosenthal-Sabroux and Grundstein, 2007; Lud¨ascher et al., 2009), driven by business goals of the company.
Standard languages used for modelling business processes are BPMN (Object Management Group (OMG), 2013) and activity diagrams of UML (Object Management Group (OMG), 2017). Roughly speaking, such languages, used within a methodological modelling process, allow producing an abstract graphical representation of the activities that compose a business process, their sequencing, and the actors that are responsible of the activities.
Figure 1.2 is an example of business process, modelled in activity diagrams UML formalism. It models an accommodation booking process in a hotel. This process involves three actors including two human actors –a customer and a receptionist– and a technological information software –the channel manager–. The initial node (starting point of the process) is the black filled circle. Rectangles having rounded corners are actions (also called activities) performed by actors. Each action is placed in the swim lane associated with the actor that performs the action. The other rectangles model input (respectively output) objects received (respectively produced) by actions. Arrows model data or control flows between the elements. The other nodes specify decision points, parallelised flows and end of flows. If needed, the content of the activities can be detailed by a sequencing of actions3. In the process, a customer requests for a booking in the hotel (modelled by the first activity in the Customer swim lane). Then the receptionist opens a request processing (second activity in the Receptionist swim lane) for which the channel manager software checks the feasibility according to the provisional schedule of the hotel (third activity in the IS swim lane). The result of the channel manager is sent to the receptionist, who informs the customer. Then there are two cases: either the request of the customer cannot be satisfied (if the hotel is completely booked for the required period), or it can be satisfied, leading to a pre-booking in the system and an offer to the receptionist that communicates this offer to the customer, etc.
3
This presentation contains only a simplified and incomplete vision of the activity diagram UML formalism, but I do not go further into details as the contributions in this document do not depend on the details of the chosen modelling language.
14 1. PRELIMINARY NOTIONS
Figure 1.2: A modelled business process
Data may be used in order to perform activities, for instance the information of the customer request -dates, number of persons, type of room-, the provisional schedule of the hotel and the rates of the rooms. The quality and the availability of these data are key factors in the success of the booking process. The efficiency of the channel manager software is also important (must accurately and efficiently answer to queries). But, in most cases, data and software are not the only “inputs” of a business process. We can also go beyond this technological view of the process that only considers encoded information. Indeed human beings (actors) are involved in the business process. They use personal knowledge (skills) in order to perform tasks. For instance, the receptionist knows how to interact with the customer, how to react to dissatis-faction, how to propose relevant alternative solutions according to the customer profile, how to cleverly assign the rooms in order to optimise the customer satisfaction and the hotel oc-cupancy rate, etc. Such behaviour results from the application of her/his personal knowledge.
1.1. THE INFORMATION SYSTEM 15
The notion of knowledge, which is far from being trivial, is presented below.
Data, information and knowledge. Because knowledge is precious for an organisation, its semantics attracted a lot of attention in the scientific community. The definition of the knowledge concept itself has been widely discussed. The well-admitted vision consists in distinguishing data from information, from knowledge (Ackoff, 1989; Davenport and Prusak, 1998).
Dataare a set of collected observations, measurements or facts, stored on a persistent physical storage (for instance in hard disks or paper files). They are not supposed to have any meaning in themselves but they provide a basic material from which information is produced.
Informationis an arrangement of data expressed as a flow of messages (Nonaka, 1994). Infor-mation is subject to interpretation from the receiver according to her/his interpretative frame-works and previous knowledge (see (Arduin et al., 2013), on the basis of the theory proposed by Tsuchiya (1993)). By definition, the information is not necessarily persistently stored. Knowledge is a justified true belief (Nonaka and Takeuchi, 1995), that is to say an under-stood and absorbed information. Knowledge is created and organized by the very flow of information, anchored on the commitment and beliefs of its holder (Nonaka, 1994), meaning that information is converted into knowledge once it is processed in the mind of an individ-ual (Alavi and Leidner, 2001). Knowledge results in the application and the relevant use of information.
These concepts are interdependent as knowledge is a prerequisite for the generation and util-isation of data (Alavi and Leidner, 2001), and information is a necessary medium or material for initiating and formalizing knowledge (Nonaka, 1994).
The notion of knowledge itself is subtle, and has been widely studied in the literature. Let us discuss this notion in more detail. Knowledge cannot be considered as an object (Grundstien, 2009) because a part of the knowledge cannot be expressed and thus cannot be easily trans-ferred. Knowledge is often distinguished between the tacit knowledge (also called implicit knowledge) and the explicit one (Polanyi, 1967; Nonaka, 1991).
Explicit knowledgecan be codified or formalised (e.g. written or drawn) and articulated since it can be formally and systematically expressed. Knowledge that is made explicit can become some information.
Tacit knowledge(Polanyi, 1967; Nonaka, 1991) corresponds to knowledge that cannot be cod-ified like e.g. skills, craft, senses, intuition, physical experiences or “job secrets”. These are know-how, action-oriented skills, acquired through practical experience. For instance, after
16 1. PRELIMINARY NOTIONS
years and years of cooking, a Brittany top chef knows how to bake the crˆepes bretonnes4 hav-ing a perfect texture, without behav-ing able to explain her/his exact know-how method that stems from a her/his physical experience. Tacit knowledge can only be acquired through practical experience in a relevant context.
Tacit knowledge can also be distinguished between the individual knowledge and the collec-tiveone (Nonaka, 1994). The individual knowledge is owned by a person while the collec-tive knowledge is created and possessed colleccollec-tively by a group composed of more than one individual. This kind of knowledge is often solicited in innovative processes (for example, scientific research) where a group of persons (researchers in the example) need to integrate the knowledge of individuals in order to solve a problem. Note that collective tacit knowledge is more than the aggregation of individual tacit knowledge of group members as it is created by collective actions (see (Erden et al., 2008) for details).
Let us now turn to the second issue considered in the background notions: the quality man-agement of an information system.
1.2
Managing the quality of an information system
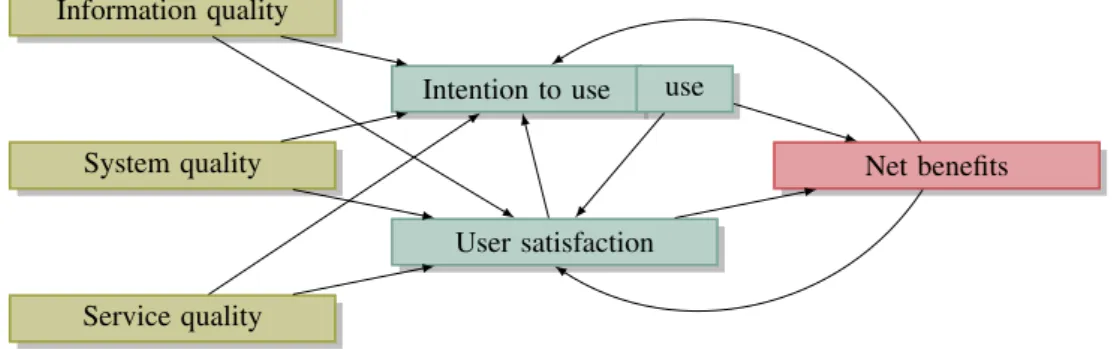
Delone and McLean (1992, 2003) defined the success of an information system though a multi-dimensional model consisting of three inter-dependent levels. Six dimensions of success were proposed, initially classified into three levels: a first technical level, a second level concerning the use of the system, and a third performance-related level.
The first “technical” level is composed of the quality dimensions associated with the system, the information and the service. The quality here includes the quality of technical levels of communication and data processes (hardware and software), which makes information avail-able, and the quality of the information itself (the outputs) produced by the system. It also includes the quality of the service, which measures the overall support delivered by the ser-vice provider (for instance the IS department). The second level contains the use and user satisfaction dimensions. It measures the intent to which the users use the system and the impact of the produced information in terms the users’ and managers’ satisfaction and use. The third level is the net benefits. It contains the individual and organisational impacts as using the system impacts individual users in their business outcomes and then collectively impacts the organization outcomes. It also contains consumer impacts and societal impacts.
4
The crˆepes bretonnes are traditional pancakes from Brittany. Part of the Breton gastronomy, these very thin pancakes are cooked on a traditional a cast-iron heating plate called billig. Cooking them requires hours and hours of practice.
1.2. MANAGING THE QUALITY OF AN INFORMATION SYSTEM 17
The authors modelled causal relations between the dimensions of success. This model is depicted in Figure 1.3. Each association of the form d1 → d2 means that the quality of the
dimension d1impacts the quality of the dimension d2. The Delone and McLean model sets the
system and information quality as the basis of the success of an information system (in the first level of the model). In this model, the user satisfaction and her/his use of data and information also clearly appear as key factors of success (the second level). According to a human-centric point of view (see Section 1.1), the user has her/his own psychological profile and knowledge that affect her/his interpretation of the information produced by the information system. The activities are performed though business processes (see Section 1.1).
Information quality
System quality
Service quality
Intention to use use
User satisfaction
Net benefits
Figure 1.3: Delone and McLean IS success model (Delone and McLean, 2003)
The Delone and McLean model was intensively studied in the literature. Extensions and deeper analyses of the proposed causal relations were performed (Delone and McLean, 2003), and new associations were proposed. Among other results, the influence of the system and information quality (including, among other criteria, the user usability of the system and the data quality) on the individual impacts (e.g. work environment, job performance, quality of work, decision-making performance) was confirmed (Delone and McLean, 2003). This is not surprising as quality problems in information systems generate a multitude of consequences for an organisation, like a loss of revenue or loss of opportunity (missing an order, a prospect, or losing an unsatisfied customer), lawsuits, increased, higher maintenance costs, excess labor costs, etc. This leads to huge costs (of non-quality), which seriously impact the efficiency of organisations and businesses (English, 1999; Eppler and Helfert, 2004; Batini and Scanna-pieco, 2016).
The impact of the business processes quality (included in the use dimension of the Delone and McLean model) over the performance of an organisation is also well recognised and quality standards like the ISO 9001:2008 recommend to continuously control and improve the qual-ity of business processes (International Organization for Standardization (ISO), 2008; Persse, 2006).
18 1. PRELIMINARY NOTIONS
In the following, I focus on the problem of managing the quality of the management and or-ganisational layerof the information system (see Figure 1.1 page 11), and more specifically on the quality management of its data and business processes.
The management community initially defined high-level methods for the quality management of production processes (Shewhart, 1980; Deming, 2000), whose initial goal was to ensure customer satisfaction. These methods have been naturally applied for the quality management of other processes, in particular for business processes. One of the prevalent approaches is Total Quality Management framework (TQM) (Oakland, 1989) based on the principle of a continuous improvement of work processes. Such an improvement implements the Deming cycle (Deming, 2000) also known as Shewhart cycle (Shewhart, 1980) or Plan-Do-Check-Act (PDCA), which proposes to continuously control and improve the quality by iteratively exe-cuting the four stages: Plan, Do, Check and Act, applied to the context of quality management. The first stage (Plan) consists in defining processes required in order to deliver the expected results. The second stage (Do) consists in implementing the processes previously defined. The third stage (Check) consists in evaluating the results of the execution, checking of they are satisfactory. In the last stage (Act, also sometimes referred to as Adjust), the processes are improved if needed. Then the cycle starts again from the first stage, with a planning based on better initial processes.
1. Define 2. Mea-sure 3. An-alyze 4. Im-prove 5. Control
Figure 1.4: The DMAIC cycle
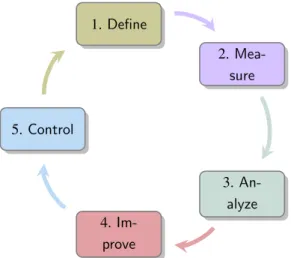
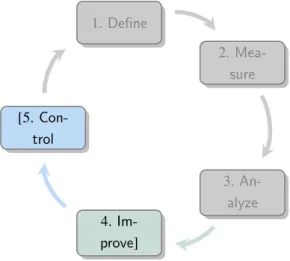
The Six Sigma program proposed an adaptation of PDCA called DMAIC (De Feo et al., 2005), which is applied to the quality management. The acronym DMAIC stands for the five stages of the method: Define, Measure, Analyse, Improve and Control (cycle illustrated in Figure 1.4).
1.2. MANAGING THE QUALITY OF AN INFORMATION SYSTEM 19
The first stage Define is the quality definition, which consists in eliciting data quality require-ments of interest. Concretely, this means choosing a set of measurable criteria of interest called quality metrics, and eventually thresholds associated with, that allows measuring in what ex-tent the data fit the quality requirements according to data usages. In the second stage Measure, the quality metrics are measured. In the third stage Analyze, quality results are analysed; this possibly leads to implement improvement actions in the fourth stage Improve. Finally, the effects of the improvement actions are measured in the last stage Control. A comprehensive explanation of each stage and concrete examples implementing the method are presented in the contribution sections of this document (Section 2 and Section 3).
This framework is the foundation of the quality management methods proposed in the litera-ture, which -roughly speaking- specialise it in order to deal with a specific part of the informa-tion system, like e.g. for managing data quality (see (Batini et al., 2009) for a review of the quality management methodologies dedicated to data quality management).
In the following, each of the contributions that I introduce is positioned according to the DMAIC cycle. The next section, Section 2, deals with the quality assessment, which refers to the stages D, M and A of the DMAIC cycle. Then Section 3 deals with the quality improve-ment, which refers to the I and C stages of the DMAIC cycle.
C
HAPTER
2
A
SSESSING QUALITY
This chapter presents a synthesis of some of my research activities concerning quality assess-ment in information systems (my research activity focused on data and business processes).
22 2. ASSESSING QUALITY
Summary of the research activities concerning quality assessment
Projects. This research was conducted in the following research projects: the CNRS Mastodons project called GIOQOSOa, the Projet scientifique ´emergent Univ. Rennes 1 called QUALITY@PANAMband the ANR ARA Masses de Donn´ees project called QUADRIScproject.
Associated theses and internships. The following PhD thesis and internships participated to this research.
- PhD of Malika Gim-Yefsah (Univ. Paris Dauphine), on the subject Knowledge manage-ment and outsourcing. Technical and managerial contributions for the improvemanage-ment of a transition process, applied to the outsourcing in a PSTId,
- Master 2 Research internship of Louis Smith (Univ. Paris Dauphine/MODO), on the subject of The quality management of business processes,
- Two Master 2 internships Univ. Rennes 1/ENSSAT/INFO, on the subject of Implemen-tation of quality metrics for a library of digital scores.
Collaborations. AID (company), EDF R&D (company), ExQI association, CEDRIC labo-ratory (CNAM Paris), CESR Tours, David (Univ. Versailles Saint Quentin), IReMus Paris, IRISA (Univ. Rennes 1), LAMIH (Univ. Valenciennes).
Associated publications. (Barrau et al., 2016), (Marcal de Oliveira et al., 2012), (Berti- ´Equille et al., 2006), (Peralta et al., 2009), (Akoka et al., 2007), (Berti-Equille et al., 2011), (Grim-Yefsah et al., 2011b), (Grim-(Grim-Yefsah et al., 2010b), (Grim-(Grim-Yefsah et al., 2010a), (Grim-(Grim-Yefsah et al., 2016) (Besson et al., 2016), (Rigaux et al., 2012), (Besson et al., 2018), (Duquennoy et al., 2007), (Besson et al., 2018), (Fiala et al., 2018), (Foscarin et al., 2018).
a
GIOQOSOstands for Quality management of open music scores (translation of GestIOn de la Qualit´e des partitiOns muSicales Ouvertes). I was co-coordinator of this project.
bQ
UALITY@PANAMstands for QUALITY focus on oPen dAta maNAgeMent. I was coordinator of this
project.
cQ
UADRISstands for QuAlity of Data and multi-souRce Information Systems.
d
Translation of the subject (in French) Gestion des connaissances et externalisation informatique. Ap-ports manag´eriaux et techniques pour l’am´elioration du processus de transition : cas de l’externalisation informatique dans un EPST.
23
We can consider that the quality assessment is composed of the first three stages of the DMAIC cycle, that is to say the Define, the Measure and the Analyze stages (see Figure 2.1).
1. Define 2. Mea-sure 3. An-alyze 4. Im-prove 5. Control
Figure 2.1: Quality assessment in the DMAIC cycle (the D, M, and A stages)
We now give some more details concerning these stages.
Define. The first stage Define consists in defining the notion of quality. It is a critical issue as it result constitutes the foundations of the following of the quality management process. The goal of this stage is to identify the quality requirements concerning (a part of) the components of the information system. The contributions that I present in the following of the document focus on the data and the business processes of the information system.
The quality is a complex notion, which embraces different semantics depending on the con-text (Redman, 1996; Batini and Scannapieco, 2016). It is described through a set of quality dimensionsaiming to categorise the criteria of interest. Classical quality dimensions are the completeness(the degree to which needed information is present in the collection), the accu-racy(the degree to which the measured elements are accurate), the consistency (the degree to which the measured elements respects integrity constraints and business rules) and the fresh-ness(the degree to which the measured elements are up-to-date).
The quality criteria over a dimension are defined according to a set of metrics that allow a quantitative definition and evaluation of the dimension. Examples of quality metrics are “the number of missing meta-data” for the assessment of the completeness, and “the number of cities not consistent with the zip code in the postal addresses” for the assessment of the consis-tency. These are very simple examples but the literature proposes a large range of dimensions and metrics, conceptualized in quality models (see the surveys proposed by Batini and Scan-napieco (2016) and Zaveri et al. (2016) for details). Of course, not all the existing dimensions
24 2. ASSESSING QUALITY
and metrics should be used for evaluating data quality in a given operational context. An im-portant property concerning data quality is that it is defined according to fitness for use of data, meaning that quality measurement involves dimensions and metrics that are relevant to a given user for a given usage. This means that a user u1may be concerned by some quality metrics
for a specific usage, by some other metrics for another usage, and they can be completely different than those needed by a user u2.
This stage mainly raises methodological questions.
Measure. As soon as data quality metrics are elicited, one can consider different processes for their computation, including collaborative ones if the information system allows it. This is the Measure stage of the DMAIC cycle.
The quality measurement of course raises technological issues. The main technological issue is “how to measure the metrics?” including the questions of either using an existing tool (and if so, how to choose it?) or implementing a new quality software (tool or module), where to insert the quality measurement module in the system, etc.
But even with an appropriate assessment tool, the Measure stage can lead to reach the limits of the available resources when a large volume of information is considered or when a compre-hensive measurement process is too expensive (moreover, this can happen even with a small amount of data). So, the question of the limits of a quality assessment is partly hidden behind the question of the measurement.
Analyze. Analysing the results enables to (partly) answer to the quality questions, and con-sequently enables to decide whether the measured elements respect the requirements for the given business goal. Quality and business experts seek the causes of quality defaults. This is the Analyze stage of the DMAIC cycle. This analysis is not trivial because quality results are usually incomplete and quality metrics are dependent on each other.
In Sections 2.1 and 2.2, I respectively present some contributions on the quality assessment of data (Section 2.1) and the quality assessment of a business process (Section 2.2). In Sec-tion 2.3, I discuss the limits of a quality assessment method.
2.1. ASSESSING THE QUALITY OF DATA 25
2.1
Assessing the quality of data
I’ll face the truth when I think I can. Only, Sarah Vaughan, 1963
Positioning. In this section, I review some contributions on the problem of data quality evalu-ation, over digital libraries of scores and over multi-sources CRM databases. These contribu-tions are deeply presented in the following publicacontribu-tions: (Besson et al., 2016), (Rigaux et al., 2012), (Besson et al., 2018), (Fiala et al., 2018), (Berti- ´Equille et al., 2006), (Peralta et al., 2009), (Akoka et al., 2007), (Berti-Equille et al., 2011) and (Duquennoy et al., 2007).
2.1.1 Defining the quality of data
There is a growing availability of music scores in digital format, made possible by the com-bination of two factors: mature, easy-to-use music editors, including open-source ones, and sophisticated music notation encodings. We are therefore facing emerging needs regarding the storage, organisation and access to Digital Libraries of Scores (DSL). But it turns out that building a DSL, particularly when the acquisition process is collaborative in nature, gives rise to severe quality issues. There are many reasons for this situation. First, encoding formats have changed a lot during the last decades (from HumDrum and MIDI to XML formats Mu-sicXML and MEI). A lot of legacy collections have been converted from one encoding to the other, losing information along the way. Second, the flexibility of music notation is such that it is extremely difficult to express and check quality constraints on the representation. For instance, many of the formats do not impose that the sequence of events in a measure1exactly covers the measure duration defined in the music score. Third, scores are being produced by individuals and institutions with highly variable motivations and skills. By “motivation”, we denote here the purpose of creating and editing a score in digital format. A first one is obvi-ously the production of material for performers, with various levels of demands. Some users may content themselves with schematic notation of simple songs, whereas others will aim at professional editing with high quality standards. The focus here is on rendering, readability and manageability of the score sheets in performance situations. Another category of users (with, probably, some overlap) is scientific editors, whose purpose is rather an accurate and long-term preservation of the source content (including variants and composer annotations). The focus will be put on completeness: all variants are represented, editor’s corrections are fully documented, links are provided to other resources if relevant, and collections are con-strained by carefully crafted editorial rules. Overall, the quality of such projects is estimated by the ability of a document to convey as respectfully as possible the composer’s intent as it
1
26 2. ASSESSING QUALITY
can be perceived through the available sources. Librarians are particularly interested in the searchability of their collections, with rich document annotations (meta-data). We can finally mention analysts, teachers and musicologists: their focus is put on the core music material, minoring rendering concerns.
Knowing that data quality is fitness for use (depends on the context), the first question that has to be tackled is: ”How to define data quality in DSL?” In order to answer to this question, dedicated methodological guidelines can be followed like the Goal Question Metric (GQM) paradigm Basili et al. (1994), which proposes to define quality metrics according to a top-down analysis of quality requirements. The underlying process of the GQM paradigm is given hereafter.
1. For each user (or each user role) and for each of his/her usage of data, conceptual busi-ness goalsare identified. A business goal specifies the intent of a quality measurement according to a usage of data.
(Example.) We make this process more concrete by illustrating it on a simple example taken from (Fiala et al., 2018). Let us assume that a business user retrieves music scores in order to Perform a given algorithm that searches for similar patterns in the parts of a music score. This is a business goal.
2. Each goal is then refined into a set of operational quality questions, which are a first step towards eliciting the quality requirements.
(Example.) For the running example, the user may express that (i) the results of his/her study is relevant provided that data is complete enough and that (ii) the used algorithm computes relevant results provided that data is accurate enough. Quality questions associated with this use case could then be the following ones.
(QQ1) Does the data contain all the needed information? (QQ2) Are the notes accurate?
3. Each quality question is then itself expressed in terms of a set of quantitative quality metrics with possible associated thresholds (expected values).
(Example.) The quality question (QQ1) could be refined into two more pre-cise quality questions (at the score level). A first ”quantitative” quality ques-tion could be Is the time signature available?. The time signature is the information made of the two numbers that appear after the clef at the begin-ning of a staff (encoded in a specific tag in the MEI file of the music score). The time signature is68in Figure 2.2.
2.1. ASSESSING THE QUALITY OF DATA 27
.
Figure 2.2: Excerpt of a music score
The quality metric (QQ1/M1), defined below, expresses this requirement. (QQ1/M1) Availability of the time signature.(Boolean result). A second quantitative quality question associated with (QQ1) could be Does each measure1cover exactly the expected number of beats?. For instance, the time signature68of Figure 2.2 implies that each measure (except the first one, which is a special case), must have exactly three beats. The circled measure has two quarter notes
ˇ “
(i.e. a value of two beats), and two eighth notesˇ “(
(i.e. a value of one beat), so it respects the declared time signature. The quality metric (QQ1/M2), defined below, may express this requirement at the music score level.(QQ1/M2) Number of measures that fit the expected number of beats (defined in the time signature), over the total number of measures. Assuming that the algorithm is robust up to 10% of malformed measures, then the threshold 0.9 could be associated with this quality metric.
Concerning the quality question (QQ2), it could be refined into a quality metric that measures the syntactic accuracy of the notes, meaning that each note should be an existing one (which belongs to the usual range of notes). A third quality metric could then be (QQ2/M3) defined below.
(QQ2/M3) Number of syntactically accurate notes over the total number of notes.
The quality assessment raises scientific challenges because data quality methodologies of lit-erature are designed at a generic level, leading to difficulties for their implementation in a specific context (operational context and available information system and data). Additional context-dependent quality methodologies are then needed (Barrau et al., 2016). In particular, the literature proposes a large range of quality metrics (Batini and Scannapieco, 2016; Zaveri et al., 2016) but such metrics are general ones. Quality metrics that are specific to the data of the considered domain are still needed, more specifically in the context of digital score libraries for which, to our knowledge, only few quality metrics were proposed in the literature. Contributions. Based on the authors’ practical experience and skills, we proposed in (Besson et al., 2016) and (Fiala et al., 2018) a set of quality rules specific to DSL data. About fifty
28 2. ASSESSING QUALITY
rules composed the first version of the catalog of Fiala et al. (2018). A data quality rule expresses a possible quality requirement. It may be used either (i) in order to tag the data where a quality problem occurs, or (ii) in order to compute a quality metric associated with a score or a corpus. For instance, the quality rule “Each note is syntactically accurate, meaning that it is an existing one (which belongs to the usual range of notes)” expresses the fact that having syntactically accurate notes is a data quality requirement. Such a quality rule can lead to tag the notes that are syntactically inaccurate (those that violate the rule) in music scores of interest. It can also lead to compute a quality metric in order to assess the quality of a music score according to the rule, like the number of syntactically accurate notes over the total number of notes appearing in the score2. The catalog can serve as a basis in order to elaborate users’ quality requirements, by choosing relevant quality rules according to specific use cases. In order to classify the rules, we proposed taxonomy that is specific to DSL data. This allows combining the data quality point of view that organises quality rules/metrics according to classical quality dimensions (completeness, accuracy, etc.) and a business point of view that introduces supplementary DSL-dependent levels (Besson et al., 2018) (dissociating the content issues, from the engraving ones, from the metadata ones). The set of quality rules that we proposed is obviously not exhaustive. New quality rules are regularly discovered and added to the framework. The catalog is then subject to evolution and enrichment.
In (Besson et al., 2016), we proposed a methodology for assessing data quality in a digital score library. Our approach defines a generic data model that supports the specification of quality schemas based on quality metrics of Fiala et al. (2018), lets users define their goals with respect to the schema of their DSL, and matches usages against quality evaluation. The implementation of this framework, focusing on the measurement of the DSL quality metrics, is presented in Section 2.1.2.
2.1.2 Measuring the quality of data
The second challenge of the quality assessment concerns the measurement stage, and more specifically the underlying software tools that measure the quality metrics of interest. Two solutions may be thought of: either using an existing software, or developing a new dedicated tool (or module) attached to a data management software.
For the problem of quality management of CRM databases, we proposed in (Duquennoy et al., 2007) a set of guidelines for choosing a quality tool according to the considered quality metrics of interest. Based on our practical experience, we explained what one can expect of a data quality management tool in a CRM context, and we proposed a selection of about sixty quality
2
By extension, quality metrics at the corpus level may easily be defined by aggregation of the metrics at the score level, for instance the average and standard deviation of the corresponding metric at the score level, computed over the set of scores that belong to the corpus.
2.1. ASSESSING THE QUALITY OF DATA 29
metrics that are relevant in such a context. In (Barrau et al., 2016), we reviewed some of the available software tools that support the management of open data. The idea was to estimate the maturity of the existing tools in terms of data quality management. Such contributions propose guidelines for choosing a quality assessment tool amongst the available ones.
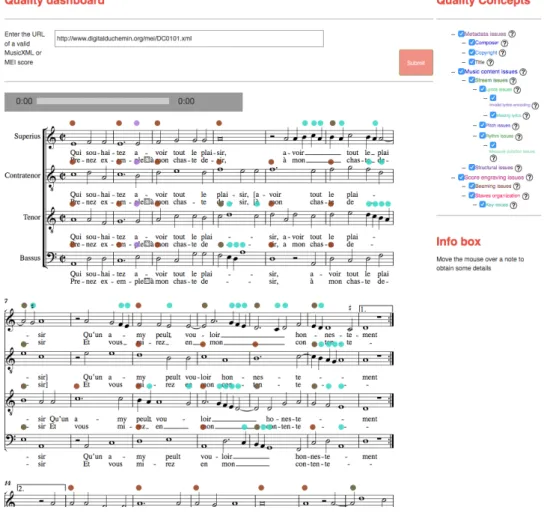
Figure 2.3: Visualisation of quality problems in the NEUMAplatform
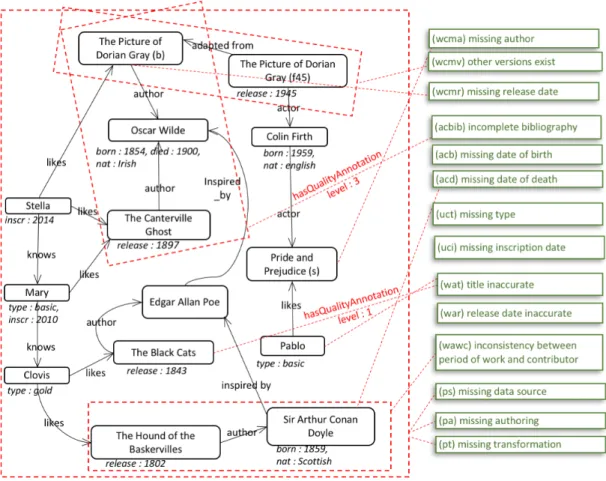
If no suitable tool exists, then one can consider to implement an ad hoc tool or module for managing data quality. This is the approach chosen in the GIOQOSO project, for which a specific tool was developed (Besson et al., 2018) in the NEUMA digital score library plat-form (Rigaux et al., 2012). The corpora of NEUMA are publicly available, on open access athttp://neuma.huma-num.fr. Some of the quality rules presented in Section 2.1.1 are cur-rently being implemented in the NEUMAplatform in the form of a quality module (Besson et al., 2018; Foscarin et al., 2018) that detects quality problems in the data and tags them (Si-Said Cherfi et al., 2017a,b). A graphical user interface allows their visualisation, as illustrated in Figure 2.3. In such an interface, the user chooses a music score whose quality has to be
30 2. ASSESSING QUALITY
checked, her/his data problems of interest (in the right frame in Figure 2.3). After the quality module processing, graphical elements appear in the form of an overprinted layer on the layout of the music score (the coloured points in Figure 2.3) in order to report quality problems that are detected.
(Other works.) As a research engineer at EDF, I also participated to quality assessment studies over data of CRM databases. In this context, we proposed new data quality metrics specific to the electricity business, and participated, in the QUADRISproject3(Berti-Equille et al., 2011), to the definition of a multidimensional model that captures a large variety of measures for characterising the quality of data. These contributions are not detailed in this report. Details of these contributions can be found in (Peralta et al., 2009; Berti-Equille et al., 2011; Akoka et al., 2007).
2.2
Assessing the quality of a business process
Positioning. In this section, I review some contributions on the problem of the quality as-sessment of a business process, deeply presented in the following publications: (Grim-Yefsah et al., 2010a), (Grim-Yefsah et al., 2010b), (Grim-Yefsah et al., 2011b).
2.2.1 Defining the quality of a business process
In the current context of increasing competition, organisations are forced to look for new solutions that aim at generating value. Outsourcing is one of the principles adopted by com-panies that decide to devote internal resources to core business. Outsourcing is a management strategy by which an organisation delegates non-core activities to an external and specialised third party (Willcocks and Kern, 1998). It has been widely adopted in both public and private companies. They mainly outsource support services such as Human Resources management, Finances, or Information System (IS) activities.
In the following, we consider the use case of the IS outsourcing in a French Public Scien-tific and Technological Institution (PSTI). Willcocks and Kern (1998) define IS outsourcing as delegating to a third party the management of IT/IS assets, resources, and/or activities for required results. Different categorisations of outsourcing were proposed (see the survey of Dibbern et al. (2004) for details). In our use case, the outsourcing concerns the develop-ment of a software, performed in project managedevelop-ment mode (Lacity and Hirschheim, 1993), meaning that the development of the software is delegated to a service provider, but the
2.2. ASSESSING THE QUALITY OF A BUSINESS PROCESS 31
ternal IS Department still manages the project and keeps being the main interlocutor of the business entity.
The outsourcing contract rules for a French public organization, like a PSTI, impose that each outsourced project must undergo a new tendering procedure every three years. Such a pro-cedure may lead to change the service provider, during the project in progress. Changing the provider implies to perform a transition stage, which consists in transferring the out-sourced project from the outgoing project team to an incoming one. The transfer concerns the documentations, applications, programming codes and knowledge. Knowledge transfer here cannot be relegated to the background as several studies showed that both the transfer of the explicit and the tacit knowledges plays an important role in the success of the transition process (Alaranta and Jarvenpaa, 2010; Beulen et al., 2011; Olzmann and Wynn, 2012). The transition stage is a complex, risky and challenging building block of strategic importance in an outsourced project (Olzmann and Wynn, 2012). Then ensuring a “good quality” of the transition is fundamental. But there is no consensus on the definition of the quality of a transition. From a practical point of view, the question is “Which indicators should be measured in order to assess the quality of a transition?” This is the first problem that we tackled in our work. (The second problem concerns the improvement of a transition stage, which is presented in Section 3.1.)
Contributions. We proposed quality metrics for managing the quality of a transition pro-cess, and applied these metrics to the quality assessment of a real transition process that is implemented in a French PSTI. The approach that we adopted has the following properties.
- The transition is seen as a business process that can be modelled, analysed and improved. - The quality management follows the DMAIC approach (see background notions in Sec-tion 1.2), using the GQM methodological tool for the definiSec-tion of the quality (see back-ground notions in Section 1.2).
It is worth noting that such an approach, based on a detailed modelling of the process, is classical in the computer science community but not widespread in the project management community. To our knowledge, it had never been experimented in the context of the manage-ment of an outsourced project transition. Our framework also proposes a selection of relevant quality metrics to by used in such a context, including some new quality metrics for assessing the robustness of a business process (which were experimented on a real use case).
Let first present our use case, this is to say the transition process that we consider, modelled as a control flow oriented business process managed by the IS Department (which is an internal entity). It consists of six global activities.
- Activity 1, called Initialisation, corresponds to the official beginning of the transition. The institution officially validates the transition and its global goals, duration,
provi-32 2. ASSESSING QUALITY
sional schedule and actors involved.
- Activity 2, called Third Party Maintenance(TPM) ending consists in inventorying the internal and external documents, applications and programming codes associated with the project to be transferred, and in defining a regulatory framework between stakehold-ers for the transfer. The TPM ending activity contains seven tasks, including four tasks under the responsibility of the IS Department.
- Activity 3 called the Transfer planning consists in the definition of the precise planning of the following of the transition process, aiming at concretely transferring the project from the outgoing team to the incoming one. This activity includes two tasks. The first task is under the responsibility of the outgoing service provider, who defines the planning. The second task is under the responsibility of IS Departement, who possibly adjusts and then validates the planning.
- Activity 4, called Project transfer, essentially consists in transmitting documentations, applications and programming codes to the incoming project team. The outgoing service provider writes documents and codes. The IS Department is almost not involved in this activity. This activity includes four tasks (not detailed here).
- During Activity 5, called Maintenance in cooperation, the outgoing and incoming ser-vice providers assume together a time-limited maintenance of the application. This activity is optional according to the procedure. In practice, for cost or time saving rea-sons, this activity is often skipped or cut back to the bare minimum. If performed, this activity includes five tasks (not detailed here).
- Activity 6, called Transmission of responsibility, is the official ending of the outgo-ing service provider’s job. This activity includes four administrative tasks (not detailed here).
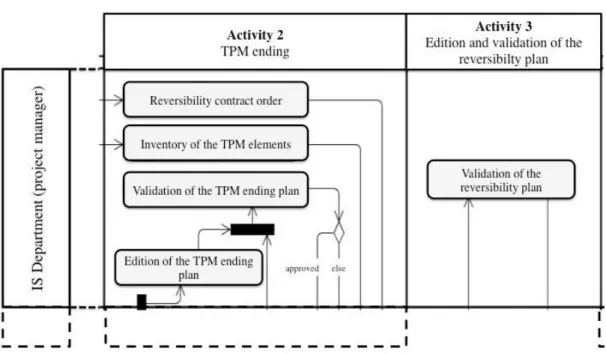
Figure 2.4 is a small excerpt from the modelled transition, focusing on the tasks of the activi-ties 2 and 3 that are under the responsibility of the IS department actor (Grim-Yefsah (2012) gives the whole detailed process in her PhD manuscript). One can see that Activity 2 contains four tasks, including the task called Inventory of the TPM elements, in which an inventory of all the project elements (documents, codes) that have to be transferred is performed, and a task called Edition of the TPM ending plan, in which the procedure for transferring the elements is planned. (The two other tasks are administrative milestones, they are not detailed.)
Following the GQM method, we identified quality goals and questions of interest. Beyond the applicative study itself, this work led us to propose a set of quality metrics for measuring the quality of a transition process, and to define some generic quality metrics that make possible to assess the robustness of a business process to the risk of missing knowledge needed for its execution. I only to survey these contributions, for which details can be found in (Grim-Yefsah et al., 2016).
2.2. ASSESSING THE QUALITY OF A BUSINESS PROCESS 33
Figure 2.4: Activities 2 and 3 of the transition process restricted to the internal IS department actor
Let me give an intuition of the reasoning that led us to choose the quality metrics presented in the following. At first glance, it appeared that (Issue i) the transition stage was difficult to manage by the project manager, and that (Issue ii) at the end of the process, the outgoing team missed a part of the knowledge that should be transferred. It was also observed that (Issue iii) the execution of the business process seemed to activate a network of informal collaborations implying contributors that did not appear in the formal procedure.
The first observation (Issue i) seemed related to the complexity of the process. The second observation (Issue ii) seemed to reflect that the knowledge transfer performed in the process was incomplete. The last observation (Issue iii) seemed to indicate that a lot of (hidden con-tributors’) knowledge used during the process did not explicitly appear in its modelling. Such a situation weakens the robustness of the process as it could unnoticeably miss contributors’ knowledge, especially when it is performed during a period favourable to the absence of per-sons (holidays, seasonal flu epidemic, corporate reorganisation, etc.). This leads to a strong risk of missing knowledge needed for the execution of the process.
These observations had to be quantified and rationalised (as much as possible). So we pro-posed some quality metrics that allow defining the quality of the transition.
A first set of metrics used for the quality assessment study concerned the assessment of the complexity of the process (Issue i). These quality metrics were taken from the literature, which proposed a lot of relevant metrics for assessing the complexity of a business process (Laue and
34 2. ASSESSING QUALITY
Gruhn, 2006; Vanderfeesten et al., 2007). But for Issue ii and Issue iii, no quality metric of literature allowed evaluating the quality of the knowledge transfer or the robustness of the business process according to ”hidden” contributors.
Concerning Issue ii, based on the theory of knowledge transfer (Cohen and Levinthal, 1990; Davenport and Prusak, 1998; Argote and Ingram, 2000), we proposed some quality metrics for assessing the quality of the effective knowledge transfer from the outgoing provider to the incoming one (Grim-Yefsah et al., 2016).
Concerning Issue iii, we proposed some quality metrics for defining the robustness of a busi-ness process, with regard to the risk of losing knowledge that is needed for its execution. These metrics are based on the analysis of social networks (Wasserman and Faust, 1994; De-genne and Forse, 1999) underlying the execution of the process, including formal and informal contributors (Grim-Yefsah et al., 2011b, 2010a, 2011b).
The whole set of metrics were assessed on the transition business use case (Grim-Yefsah et al., 2016).
It is worth noticing that the implemented quality metrics were extremely heterogeneous. They concerned :
- the business process model itself independently of any execution, for instance evaluat-ing a part of the process complexity in terms of the number of elements (tasks, edges) appearing in the model;
- for a specific execution:
- the target artifacts, which are the parts of the business process outer environment that we strike to create or alter (Lohrmann and Reichert, 2013) like
- the resulting autonomy of the incoming provider;
- the tangible deliverables produced during the business process (outputs); - the resources of the business process like
- the execution time of the tasks, the activities or the whole process (time re-source);
- the underlying relationships between persons involved in the execution (hu-man resource).
The quality metrics also concerned the measurements for various aggregation levels: tasks, activities or even the whole process. Moreover, their measurement could be either objective (e.g., the execution time of a task) or subjective (e.g., some metrics are measured in terms of perceived quality).
2.2. ASSESSING THE QUALITY OF A BUSINESS PROCESS 35
2.2.2 Measuring the quality of a business process
Concerning the measurement of the metrics, some metrics were measured on the business process model, independently of its execution. This is the ”easy part” of the evaluation, which may be performed by automatic tools based on the modelling of the process (roughly speaking counts/aggregates the number of tasks, connections, etc. of the model).
All the other metrics depended on the execution of the transition business process. The metrics that measure the quality of the knowledge transfer are measured by interviewing the project manager and the incoming service provider. The metrics involving the underlying social net-works are much more complex as they included a preliminary modelling of the netnet-works (sociologists helped us for the methodological aspects). The (simplified) approach consists in discovering the social network by interviewing the actors (executors and contributors) of the business process, modelling it as a graph and then analysing its structure (Wasserman and Faust, 1994). Collecting the data that compose the social networks is an expensive task in terms of time and human resources.
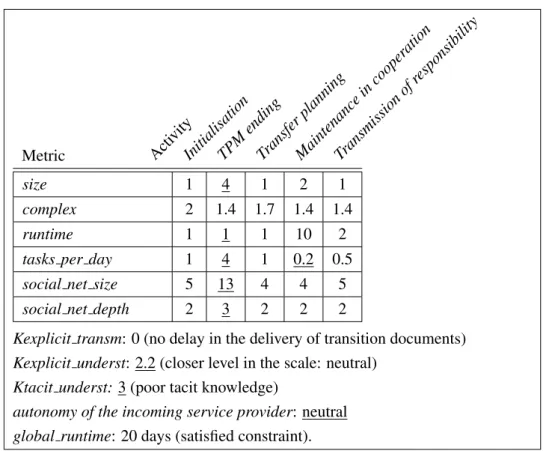
In order to make things more concrete, Figure 2.5 presents an excerpt of the report that resulted from the quality assessment of the considered transition business process. In this report table, the columns are activities of the transition business process and lines are the quality metrics assessed over each activity. In the results, the higher the measured value is, the riskier is the activity. For simplicity, I decided not to go into details (see (Grim-Yefsah et al., 2016) for details) that would require to deeply explain the activities and the quality metrics, but one can see for instance that the values for the quality metrics social net size and social net depth that measure the scale of the hidden social network activated during the execution of an activity, are high for the TPM ending activity, which consists in the inventory of the documents and codes that have to be transferred. Notable values are underlined in Figure 2.5. Moreover, the results of the quality assessment at the task level (which are not given here), exhibited some very sensitive tasks in the TPM ending activity meaning that these tasks are much more com-plex than the official procedure suggested, as the executors of these tasks need additional help. The official procedure does not reflect this.