An alternative approach of the e-nose training phase in odour
impact assessment
S. Giuliani
a, T. Zarra
a, J. Nicolas
b, V. Naddeo
a, V. Belgiorno
a, A.C. Romain
ba
SEED - Department of Civil Engineering, University of Salerno, via Ponte don Melillo, 1, 84084 Fisciano (SA), Italy
bUniversity of Liège, Department “Environmental Sciences and Management”, Avenue de Longwy, 185, 6700 Arlon, Belgium
(E-mail: sgiuliani@unisa.it; Tel. +39 089 969337; Fax +39 089 969620)
Odour emissions are causing serious nuisance for the population, especially in the surrounding of waste water treatment plants (WWTP) and solid waste treatment plants. Extended exposure to odours generate undesirable reactions ranging from emotional stresses such as unease, discomfort, headaches, or depression to physical symptoms. Odour emission characterization is currently discussed in international literature for opportune implementation. Measurement of emissions can be achieved using different methods (analytical, sensorial and/or senso-instrumental) that have different advantages and problems. Among these techniques, there is a growing interest towards the environmental applications of electronic noses. Electronic nose is the only technique that allows continuous monitoring of odours. However, at present there are several limitations affecting the application of electronic nose in the environmental sector.
The study investigates the electronic nose potentialities in the environmental sector. Scope of this research activity is to investigate an alternative method to build training data set necessary to distinguish different odour sources generated by solid waste treatment facilities through electronic nose application. The proposed methodology is based on the straightforward application of the electronic nose directly in field with the aim to reduce the time to build the complete data set.
Results highlight the great efficiency of the proposed approach to reduce the time to build the complete data set, to maximize the electronic nose capability of operating a qualitative classification of odour sources.
1. Introduction
Offensive odours from WWTP and solid waste treatment facilities are a frequent cause for complaints by the community and may cause environmental nuisance (Stuetz et al., 2001). Odours generate a variety of undesirable reactions in people, from annoyance to documented health effects (Zarra et al., 2009a). In communities exposed to odorous emissions, even though there may be no immediately apparent diseases or infirmities, it is clear that physical, as well as mental, wellness is not promoted (Gostelow, 2001; Zarra et al, 2008; Zarra et al., 2009b; Zarra et al., 2010). Currently, available techniques for odour characterisation and quantification are of three different kinds (Gostelow et al., 2001): analytical, sensorial and sensorial – instrumental that have different advantages and problems.
Among the senso-instrumental techniques there is a growing interest towards the environmental applications of electronic noses and many studies have been done. Electronic nose is the only technique that allows continuous monitoring of odours (Persaud and Dodd, 1982). The electronic nose has the best potentialities to answer to the expectations of the various actors of the environmental problems in relation with the odours annoyance (Romain et al., 2008). However, several limitations in environmental sector are associated with the properties of chemical sensors (Barsan et al., 2007), the signal processing performances, and the real operating conditions of the environmental field (Romain et al., 2009). The monitoring of environmental odours in the field remains challenging (Nicolas et al., 2004). The classification of the odours is based on the comparison of the e-nose signals with a database of patterns acquired by the instrument in a previous training phase. The training of the electronic nose is a very important phase (Capelli et al., 2008); this phase is usually made up by different steps summarized below: the identification of the principal odour sources of the plant to be monitored; the collection of representative gas samples in correspondence of these odour sources; the preparation of a set of odorous gas samples to be analyzed by electronic nose; the instrumental analysis of these samples; the data processing, evaluation and selection of the acquired data for the creation of qualitative and/or quantitative model. In order to characterize the odour emissions relevant the plant, gaseous samples are collected in the field at the emission source and analyzed using the electronic nose in laboratory in a controlled indoor environment.
The scope of this study is to investigate an innovative alternative method to build training data set necessary to distinguish different odour sources generated by solid waste treatment facilities through electronic nose application. The proposed methodology is based on the straightforward application of the electronic nose directly in field. The e-nose is constantly moved over the investigated area for recording in real time the data trends to use for developing odour qualitative model with the aim to optimize the classical method in terms of time and costs and to maximize the electronic nose capability.
2. Material and methods
2.1 Odour monitoring
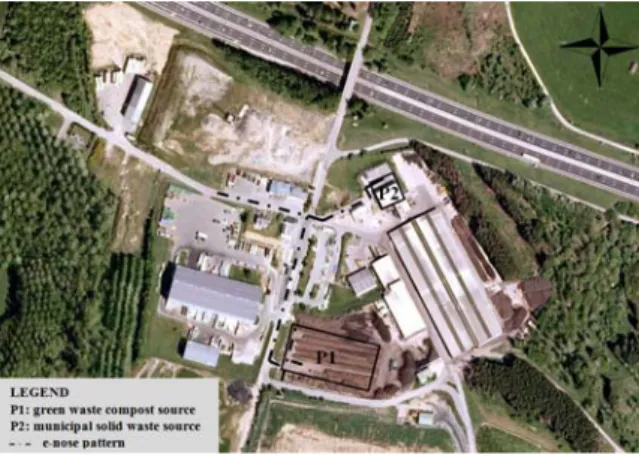
Research study is carried out in a full-scale waste treatment plant located in the rural area of Habay in Wallonia (South of Belgium). The waste treatment plant consists of a municipal solid waste reception unit, an area dedicated to the composting process of windrows of green waste, a landfill area, a garbage acceptance point where customers can get rid of their waste, such as textile, paper and cardboard and plastic bottles. In Figure 1 are showed both the two odour emission sources investigated (P1 – P2); the dotted line represents the defined pattern to move the portable e-nose across the plant.
Figure 1: Identification of odour sources of the waste treatment plant investigated and e-nose pattern
The portable e-nose has been constantly moved over the investigated area to record data trends in real time. The monitoring activity started at the odour source, whereas subsequent measurements have been carried out, using the portable e-nose device, at increasing distance from the odour source.The measurements were made on the field after 30 min, needed to achieve a perfect stabilization of sensor signals. At the same time of the e-nose measurements, the dedicated operator kept close to the instrumentation as to write down all his personal feeling in terms of odour as well as every remarkable event happening in the site together with the time of their appearance.
Odour monitoring was carried out during 6 campaign measurements from May to June 2011. 2.2 Electronic nose
The portable electronic nose consists in a battery powered sensor array and a PC board, with a small keyboard and a display. The system is equipped with six metal oxide gas sensors commercially available and differing in selectivity and sensitivity (Figaro®) (TGS822, TGS2620, TGS2180, TGS842, TGS2610, TGS880). They are placed uniformly in an optimized small sensor chamber to allow a fast change of the air volume at the working flow rate (200 ml/min). A temperature sensor and a humidity sensor are also placed inside the sensor chamber. So, the humidity rate and the temperature of the studied atmosphere are recorded during the measurements. To minimize the influence of these two factors on the gas sensor responses, their value are taken into account by the data processing.
A specific software controls the hardware and allows the acquisition of the sensor signals. The raw electrical conductances of the sensors are recorded each 30 seconds in the local memory. Afterwards, they are downloaded to be off-line processed by statistical and mathematical tools (Statistica© and Matlab©). The features considered for the data processing are the raw sensor electrical conductances (S), normalized by the square root of the sum of all the sensors conductance values squared without any reference to a base line. The TGS2180’s sensor is very sensitive to the water vapour and it is considered only for humidity correction and not to develop odour classification model.
2.3 Data analysis
In this study, both supervised (Linear Discriminant Analysis - LDA) and unsupervised (Principal Component Analysis - PCA) processing techniques are used to develop odour qualitative model for the waste treatment plant of Habay-la-Neuve investigated.
Principal component analysis (PCA) is a linear, unsupervised pattern-recognition technique very useful for analyzing, classifying, and reducing the dimensionality of numerical datasets in multivariate problems. PCA is often used for visual inspection of the evolution of observations over short time periods (Bourgeois W. et al., 2003).
Linear Discriminant Analysis (LDA) is one of the mostly used classification procedure which maximizes the variance between categories and minimizes the variance within categories (Lachlan, 1992).
The pre-p
3. Resu
Figure 2 s the evolu time: 3 ho nose, diff has been Figure 2: The most observati - the ma volume in - the high the green The PCA is presen PCA has different o Figure 3: In figure was mon nose ope We can o ones. Exp part of th concentra certain di “waste” g processing woults and disc
shows the tre tion of the res ours). Based o ferent time int
exposed to d
Trend of sens t interesting re ons of the ope in peaks of t nto the waste p her peaks of t n waste windro A score plot of ted in Figure s been carried odour events. Score plot of 3 it is showed itored at the t erator was mov
observe some planation of th he score plot a ations highligh stance from t group, that, on
ork and data a
cussion
nd of the e-no sponse in term on the operato tervals have b different gas m sor signals of esults can be erator nose. S the odour claspit; he odour clas ows turning. 301 observat 3 in the plane d out on the a PCA showin d that the e-n time waste tru ving away from e lack of defini his phenomeno
are those for ht a lack of d
he emission p n the overall,
nalysis was co
ose sensor sig ms of conducta or feedback th been identified mixtures: odour the e-nose in obtained thro Some of these ss "waste" ha ss "compost" h ions recorded e of the two fi whole data s ng the time ev ose reports v ucks were disc m the odour so ition between on might be g which the ope definition in th point. This has is well defined
onducted usin
gnals as direct ance (S) of th hat has been d (as determi rless air - was
the field ough the corre
results are su ave been rec have been rec d every 30 sec irst componen et, the score
volution of diffe variations in te charging solid ource. Moving some observ iven as it follo erator noted a hat the sampl
s, in turn, led d on the scor
ng ad hoc softw
tly used in fiel he 6 TGS sens
recorded simu ned on the fig ste - compost.
elation of the i ummarized as corded when t corded at the conds for thre nts (explaining plot allows to erent odour ev erms of odour d waste in the g from 14:01 to vations of the o ows: the points
a “light odour” ing did not oc to a bad corre re plot. As to wares (Statist d versus time sors during a ultaneously w gure 2), in wh nstrument info it follows: the trucks em time of the m e continuous g 90.88% of th o highlight the vents concentration e pit; on the op o 14:13, Facto odourless air s identified as ”. Similarly, “w ccur at the so elation of thes consider all th
tica© and Mat
e. The figure a measuremen with the use of
hich the electr
formation alon mptied their tr mechanical ope
hour for the fi he total varian
e time evolut
n, as the poin pposite, at 14 or1 value chan
group and the “compost” on waste” detectio
ource, but ins se points with he previously lab©). also shows t (duration electronic ronic nose ng with the ransported erations of irst of May nce). First, tion of the nt at 14:01 4:13 the e-nged. e compost the upper ons at low stead at a the whole described
elements has been similar od inspected “odourles new rules class by contiguou measurem observati “waste”, The PCA the total v Figure 4. The PCA waste1) a loading p the obser However, sensors a However, method. So, in a s function a canonical observati classificat percentag Table 1: Odour Was Was Com Odou The class observati , four groups n recorded stra dour has been d points wher ss”, is made u s of classificat the operator us in time: th ment for a du
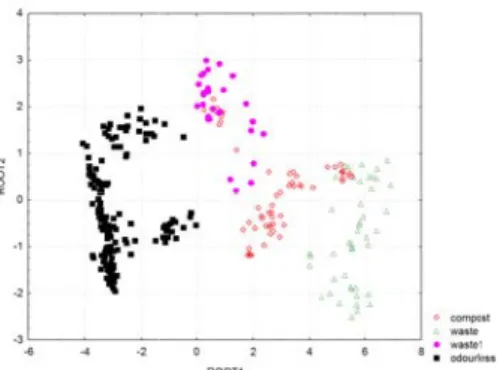
ons were reco 46 for the gro A score plot of
variance).
Score plot (le A score plot hi and the odourl plot is presente rvations of gro , to ensure a as each of th , these prelim second step, analysis (LDA l analysis. To ons (chosen tion probabilit ge of correct c Classification r class % c ste ste 1 post rless sification of e on and the ce
have been int aight on the o n monitored, e re the e-nose p of all the po tion have bee
and after a s he observatio ration time of orded each 1 up “waste1” a these is prese
eft) and loading ighlights that less air. The s ed in Figure 4 oup “odour”, w a good separa em plays a s minary results LDA is perfor A). The figure validate the c at random) a ties are set p classification fo
result for the
correct classi 98 95 96 100 each observat entroid of each troduced: the odour source; even though it e operator co oints over the n applied on a separation in ons concern 2 hour for ev minute for the and 79 for the
ented in Figure g plot (right) in there is a goo separation bet 4. According to while TGS 842 ation among significant role encourage to med on the s shows the sc classification p and the remai proportional t or each odour 4 odour class ification tion is carried h group. first group “w the second g ts intensity is orrelates the plant where t a new data se “waste” and several shor very analysis. e different sou group “compo e 4 in the plan n the plane of od separation tween the thre o the factor1 t 2, 880, 2610,2 the 4 investig e during the o o develop a c same observat core plot in the performance o ining 30% we to the size of r class. ses investigate d out on the aste” represe group “waste lower; the thir odour with a the operator c et. Only the da
“waste 1” are rt intervals of At the end, 3 urces: 154 for ost”. ne of the two f
the two first c n between the ee odours is ho
trend, the sen 2620 are bette gated groups operation of s classification m tions. Figure 5 e plane of the of the model, i ere set aside
f the four dif
ed.
basis of the
nts all the dat 1”, consists in rd group “com a compost ma cannot detect
ata with a per e considered. f time coveri 366 observatio the backgroun first componen omponents of group “odou owever not alw nsor TGS822 i
er associated , it is necess eparation of a model with thi
5 shows the r e two first root
t was calibrate for validation fferent groups
Mahalanobis
ta where a str n all the point mpost” represe atrix; the fou any odour at rfect identifica . So the data ing 5 odour ons are retain
nd air, 87 for nts (explaining f a PCA r” (compost, w ways obvious is rather corre
with group “o sary to consid all the differe is innovative a results of a di ots of the corre
ed with only 7 n purpose. Th s. Table 1 s s distance be ong odour s where a ents all the rth group, all. These tion of the a are non-campaign ed. These the group g 91.1% of waste and . The PCA elated with odourless”. der all the
nt groups. alternative scriminant esponding 70% of the he a priori shows the tween the
Figure 5: This plot results. It the odour and comp month an over the r These rat sampling
4. Conc
The pres measurem investigat capability Further e odour ann Referenc Barsan N Chem Bourgeois waste Capelli L. of odo Actua Gostelow Resea Lachlan, Nicolas J the en Persaud mode Romain A the sig Sensi Stuetz R Publis Zarra T., air po Zarra T., treatm Zarra T., comb Zarra T., asses Score plot in shows a goo t indicates tha r monitoring o pensated with nd therefore, c results of the m ther good resuand measure
lusion
sented result ment in the en tion to reduce y of operating nhancements noyance. This ces N., Koziej D., m. 121 (1), 18– s W., Gardey ewater treatme ., Sironi S., Cé ours from a w ators B 131, p. w P., Parsons arch 35, 579– G. Mc., 1992. ., Romain A.-nvironment for K., Dodd G.H l nose, Nature A.C., Nicolas J gnal processi ng, vol. 188, S R., Frechen F shing, ISBN 1 Naddeo V., B llution manag Naddeo V., ment plant loca Naddeo V., ination of olfac Naddeo V., ssment. Chem the plane of th od clustering o at the sensors of the odours h measureme considering th model ults are obtain ement in a labo ts constitute nvironmental s e the time ne a qualitative c of the e-nose s will lead to a Weimar U.,2 –35. G., Servieres ent plant, Sens éntola P., Del wastewater tre 53–62. s S.A., Stuetz 597. Discriminant C., 2004. Esta r an array of m H., 1982.Analy e 299, pp. 352 J., 2009. Mon ng, in: A. Gut Springer, Berli .B., 2001. Od 900222 46 9. Belgiorno V., 2 ement. Globa Belgiorno V. ated in sensitiv Belgiorno V. ctory and ana Giuliani S., B mical Engineerihe two first roo of the observa array is able of the investig nts of a stand his short perio ned after a sim
oratory.
an importan sector. The res eeded to build classification o e development better compre 007. Metal ox s M., Stuetz R s. Actuators B Rosso R., Il G eatment plant z R.M., 2001 analysis and s ablishing the metal oxide ga sis of discrimi 2–355. itoring an odo tierrez, S. Mar in, 2009, pp. 1 dours in wast 009a. A nove l NEST Journa , Reiser M. a ve environmen , Reiser M., lytical method elgiorno V., 2 ing Transactio ots of LDA ations among to separate t gated waste t dard gas. Ho od, the drift wa mple and fast c
nt step towar sults show the d the complet of odour sourc t consist in its ehension of its xide-based ga R.M., 2003, A c B: Chem. 91, 1 Grande M., 20 at specific re 1. Odour mea statistical patt limit of detect as sensors. Se ination mecha our in the env
rco (Eds.), Bio 121–134.
tewater treatm el tool for estim
al, Vol 11, No and Kranert M nt. Water Sci. Kranert M., ds. Water Scie 2010. Optimiz ons, 23, 93-98 the sources the 4 classes treatment site wever, the st as not signific calibration met rds reliable e great efficien te data set a es. s application in s potentiality in as sensor res chemical sens 109–116. 008. Electronic ceptors: Focu asurements f tern recognitio tion and the re ensors and Ac
anisms in the ironment with ologically Insp ment: measur mating the odo 4, pp 477-48 M., 2008. Od Technol. 58 ( 2009b. Instru ence and Tech zation of field 8.
and confirms of observation . In this study udy was cond ant and there thod directly o
classification ncy of the pro nd to maximi n areas where n terms of relia
search: how t sor array base c noses for the us on training or sewage tr on. New York: esolution limits tuators B: 99, mammalian o an electronic pired Signal P rement, mode our emissions our monitorin (1), pp. 89-94. mental chara hnology, Vol. 5 inspection m
the good cla ns and can be y, the drift was ducted during e is no related on the field an
for odour c oposed approa ize the electr e people comp ability and acc
to? Sens. Ac ed system for e continuous m methods. Se reatment wor Wiley. s of odorous s 384–392 olfactory syste c nose: require Processing for
elling and con of composting ng of small w
.
acterization of 59 (8), 1603-1 ethod for odo
assification e used for s checked g only one d influence d not after continuous ach of field ronic nose plain about curacy. ctuators B: protecting monitoring nsors and ks. Water sources in em using a ements for r Chemical ntrol. IWA g plants in wastewater f odour: a 609. our impact