Earth Surf. Process. Landforms 34, 1487–1496 (2009) Copyright © 2009 John Wiley & Sons, Ltd.
Published online 29 June 2009 in Wiley InterScience (www.interscience.wiley.com) DOI: 10.1002/esp.1834
John Wiley & Sons, Ltd. Chichester, UK ESP Earth Surface Processes and Landforms EARTH SURFACE PROCESSES AND LANDFORMS Earth Surface Processes and Landforms The Journal of the British Geomorphological Research Group Earth Surf. Process. Landforms 0197-9337 1096-9837 Copyright © 2006 John Wiley & Sons, Ltd. John Wiley & Sons, Ltd. 2006 Earth Science Earth Science 9999 9999 ESP1834 Research Article Research Articles Copyright © 2006 John Wiley & Sons, Ltd. John Wiley & Sons, Ltd. 2006
Amount and controls of the Quaternary
denudation in the Ardennes massif (western
Europe)
Denudation in the Meuse basin
A. Demoulin,1,2
* E. Hallot1
and G. Rixhon1,2
1 Department of Physical Geography, University of Liège, Sart Tilman, Liège, Belgium 2
National Fund for Scientific Research of Belgium, Brussels, Belgium
Received 10 October 2008; Revised 25 March 2009; Accepted 21 April 2009
* Correspondence to: A. Demoulin, Department of Physical Geography, University of Liège, Sart Tilman, B11, B-4000 Liège, Belgium. E-mail: ademoulin@ulg.ac.be
ABSTRACT: It is still debated whether the primary control on the middle Pleistocene denudation of the uplifted Ardennes massif (western Europe) is tectonic or climatic. Here, based on geomorphological observations, we calculate the amount of river incision and interfluve denudation in the Meuse basin upstream of Maastricht since 0·7 Ma and we show that the main response to tectonic forcing was incision. This allows us to provide first-order estimates of the tectonic and climatic contributions to the denudation of the Ardennes. From a dataset of 71 remnants of a terrace level dated ~0·7 Ma, we first derive a basin-scale functional relationship linking incision with distances to the regional base level (Lc) and to the source (Ls) in the Ourthe basin (pertaining to the Ardennian
part of the Meuse basin). Expressed as I = I0*(1 – a*Lcb/Lsc), I0 being the incision measured at the basin outlet, this relationship
calculates that river incision has removed 84 km3 of rock in the Meuse basin upstream of Maastricht since 0·7 Ma. In the same
time, 292 km3
were eroded from the interfluves. A comparison of these volumes shows that the tectonically forced river incision accounts for ~22% of the total post-0·7 Ma denudation. Furthermore, the mean denudation rate corresponding to our geomorphological estimate of the overall denudation in the Meuse basin since 0·7 Ma amounts to 27 mm/ky, a figure significantly lower than the ~40 mm/ky mean rate derived from 10Be studies of terrace deposits of the Meuse (Schaller et al., 2004). This suggests that, taken as
a basin average, the 10
Be-derived rate is overestimated, probably due to an overrepresentation of the erosion products of the rapidly incising valleys in the alluvial deposits. Copyright © 2009 John Wiley & Sons, Ltd.
KEYWORDS: river incision modelling; denudation; tectonic forcing; climatic forcing; Ardennes; Rhenish shield
Introduction
Recently, Schaller et al. (2004) wondered how to determine whether the increased denudation rates they inferred from 10
Be data for the Meuse basin since ~0·7 Ma responded primarily to the tectonic uplift of the Ardennes massif or to climatic degradation, and the question is most certainly relevant to all similarly uplifted Paleozoic massifs in the Alpine foreland. Here, we attempt to answer it for the Ardennes by computing river incision and showing that it is the main ‘denudational response’ to rock uplift of the study area.
Measurements of the 10
Be content of the quartz sand matrix of independently dated fluvial terrace deposits provide an indication of the 10
Be heritage of the material, accumulated when it attained the topographic surface somewhere in the catchment, before being taken away by river erosion. As such, these meas-urements are used to calculate average denudation rates, assumedly representative for the catchment upstream of the sample site at the time of the terrace formation (Bierman and Steig, 1996; Schaller et al., 2002). Obviously, these rates are overall estimates integrating the denudational response to all possible triggers, especially tectonics and climate. Therefore,
the separation of the cosmogenic-nuclide-derived denudation rates between their tectonic and climatic components requires that at least one particular component can be estimated from independent data.
River incision is often assumed to fairly reflect tectonic rock uplift amounts (e.g. Bonnet et al., 1998; Meyer and Stets, 1998, 2007; Peters and Van Balen, 2007). However, terrace studies suggesting that an acceleration of river incision correlates worldwide with the climatic degradation of the ‘mid-Pleistocene Revolution’, indicate that non-tectonic causes of incision are also at work (Bridgland et al., 2007; Bridgland and Westaway, 2008). Nevertheless, a first-order estimate of the part of the total denudation due to tectonics should be possible if river incision, though sometimes also driven by other factors, may at least be demonstrated to concentrate the (possibly imbalanced) surface response to uplift. Indeed, incision data are readily converted into eroded volumes that can be compared to those computed from basin-scale denudation rates derived from cosmogenic nuclide studies.
The primary motivation of this work is thus to quantify the impact of the tectonic uplift of the Ardennes massif on its increased denudation rate since 0·7 Ma. For this purpose,
which implies also an independent verification of the reference
10Be-derived rate estimates, we exploit geomorphological
data, first to calculate the two components of the landscape denudation, that is, river incision and interfluve erosion, and second to evaluate the extent to which tectonic forcing determined them. The tectonically triggered volume of eroded rock is then compared with the total denudation estimates and the meaning of the latter is discussed.
With respect to river incision, as we have no clear idea whether the whole fluvial system was at equilibrium when the 0·7 Ma episode of increased incision started and we suspect it has not yet reached a new steady state, a simple extrapolation of its total incision from a limited number of local measurements, scattered mainly along a few larger streams where terrace remnants are preserved, would provide highly uncertain results. Therefore, we prefer to develop an empirical model describing the finite amount of incision performed by the hydrographic network since that time. We adopt an inverse approach, determining the incision from currently measurable features, i.e. post-incision or, at best, time-independent variables and, rather than integrating an a priori parameterized stream power equation, where paleogradients and their downstream varia-tions are poorly constrained, we use a set of reliable incision values since ~0·7 Ma in rivers of varying Strahler’s order to derive a basin-scale functional relationship between incision and location within the Ourthe basin (a part of the Meuse basin in the Ardennes) and to calculate the corresponding eroded volumes. Although much more basic than the currently developed stream incision rules (e.g. Whipple and Tucker, 1999, 2002; Sklar and Dietrich, 1998, 2004; Crosby et al., 2007), this relationship, which will be shown to work fairly well, should be considered as a by-product of our study potentially applicable in settings similar to the Ardennes.
Geomorphological Setting
The Paleozoic Ardennes massif is the western continuation of the Rhenish shield in Belgium (Figure 1). It is located to the west of the Lower Rhine segment of the European Cenozoic Rift System. The major bounding faults of the active Roer graben are located ~20 km to the north-northeast (NNE) of the study area, which corresponds to the north-eastern part of the Ardennes and extends mainly on the Cambrian Stavelot massif. There, the Variscan fold-and-thrust belt has been super-posed on structures inherited from the Caledonian orogeny, resulting in a structurally complex basement wherein longitudinal ENE-WSW folds and thrust faults are cut by numerous NW-SE to NNW-SSE striking normal faults. The Cambrian massif is comprised of phyllites and quartzites and is surrounded by Ordovician and early Devonian slates mainly to the south and east, and middle and late Devonian sandstones, shales and limestones in the north and west.
The deformation of well reconstructed Tertiary planation surfaces and their present-day elevations demonstrate that the region underwent rock uplift of ~450 m, locally even more than 500 m, since the Oligocene, seemingly in response to far-field stresses (Alpine push and Atlantic ridge opening) and possibly also as a consequence of recent mantle upwelling beneath the nearby Eifel (Ritter et al., 2001; Ziegler and Dèzes, 2007). The innumerable studies of the Quaternary terrace staircase in the Rhine, Meuse and Mosel valleys and in those of their tributaries within the Ardennes-Eifel agree on the conclusion that the incision rates (most generally directly translated into uplift rates) increased a first time at the Pliocene-Pleistocene transition and accelerated again towards the beginning of the middle Pleistocene to reach maximum values of ~0·5 mm/y in northeast Ardennes and Eifel between
Figure 1. Digital elevation model of the study area locating the Meuse River and the main rivers of the Ourthe basin (in bold). The open circles locate the data points of river incision since the Younger Main Terrace (YMT). The bold dashed line and the dotted lines delimit respectively the Cambrian Stavelot massif and the subareas of specific interfluve evolution within the Meuse basin. FE, ‘Faille eifelienne’, Variscan thrust fault limiting the Ardennian Paleozoic massif to the north; HFZ, Hockai fault zone; RG, Roer graben; ECRS, European Cenozoic Rift System.
Copyright © 2009 John Wiley & Sons, Ltd. Earth Surf. Process. Landforms 34, 1487–1496 (2009)
730 and 400 ka before coming back to tectonic quiescence in recent times (e.g. Van den Berg, 1996; Hoffmann, 1996; Meyer and Stets, 1998; Quinif, 1999; Van Balen et al., 2000). The border faults of the Roer graben, with estimated ~0·05– 0·1 mm/y individual motion rates during the upper Pleistocene and the Holocene (Camelbeeck and Meghraoui, 1998; Houtgast
et al., 2005), accommodated the main part of the en-bloc
component of the Ardennes uplift.
In this study, we focus on the part of the Ourthe basin located east of the trunk stream (~3060 km2), with two main tributaries,
the Amblève and the Vesdre flowing down a region of fairly homogeneous tectonic uplift (with the exception of the stronger upheaval of the small, ~700-m-high, faulted Baraque Michel block in the northeast). The Ourthe River itself flows into the Meuse River at Liège, which, at 55 m above sea level (a.s.l.), makes a regional base level located approximately at the border of the uplifted massif (Figure 1). The Ourthe basin is representative of the part of the Meuse basin pertaining to the Ardennes massif. Previous field studies identified 10 –12 terrace levels along the main streams, reducing to 6 –7 in their upstream reaches (e.g. Cornet, 1995). The typical valley
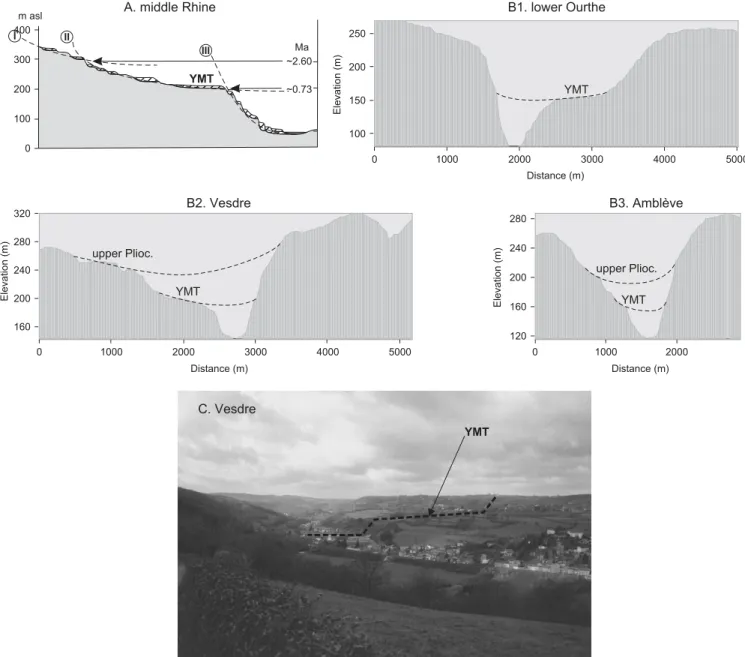
cross-section reflects the two-step increase in incision rate and opposes a narrow steep-sided young valley nested into a broader older valley with gently sloping valleysides carved into the Tertiary paleotopography (Figure 2A). Dated ~0·7 Ma (Van Balen et al., 2000; Boenigk and Frechen, 2006), the extended Main Terrace complex clearly separates the two units and marks the beginning of the middle Pleistocene incision episode. Except for the active Hockai fault zone that crosses the Vesdre valley in the northeast of the study area (Figure 1) and possibly deforms its terraces locally, the Main Terrace complex is not known to be faulted within the Ourthe basin.
Data and Methodology
River incision data
As the younger level of the Main Terrace complex, located at the upper edge of the incised valleys, is readily recognized in the field (Figure 2B), we use it as a reference level for the incision measurements. It has been dated in the Maastricht
Figure 2. (A) Schematic cross-section of the Rhine valley with its terrace staircase (hatched) carved in the Rhenish shield. This profile is typical of most rivers of some importance flowing down or across the Rhenish and Ardennes massifs, including those of the Ourthe basin, with the successively developed Pliocene (I), broad early Pleistocene (II) and narrow middle Pleistocene (III) valleys. (B) Some examples of the nested I, II, III valleys in rivers of the Ourthe basin. (C) View of the Younger Main Terrace (YMT) in the Vesdre valley downstream of Verviers.
area, north of Liège, and can be propagated upstream in the main tributaries by geometric correlation. However, owing to the limited number of terrace remnants and the local partition in sublevels, the reconstructed long profiles of the Younger Main Terrace (YMT) are still debated for many rivers of the study area, and no profile at all can be drawn in most small tributaries. This rules out simply extrapolating the total basin incision from the measurements carried out at the terrace data points. Indeed, our input dataset comprises solely 71 points where the YMT level is unmistakably identified (Figure 1), selected from a compilation of previous terrace studies (Chapelier, 1957; Ek, 1957; Alexandre and Kupper, 1976; Cornet, 1995) and local field observation in small tributaries. The incision data, corresponding to the vertical separation between the YMT remnants and the present-day floodplain are affected by a 95% measurement error of 6·4 m.
River incision modelling
The independent variables against which the incision will be regressed are taken from the 30-m resolution digital elevation model (DEM) of the National Geographical Institute of Belgium with an announced point root-mean squared (RMS) error in (x,y,z) better than 1·6 m. We analysed the statistical relationships between incision I and (1) the drainage area A, (2) the distance
Ls to the source, and (3) the distance Lc to the regional base
level (the Ourthe-Meuse confluence at Liège). Although the river gradient S is also easily extracted from the DEM, we did not include it in the analysis because (1) its derivation entails considerable noise and the necessary smoothing of the data would have biased the analysis to an unknown extent, and (2) the present gradients have no univocal relation with the gradients at 0·7 Ma, when incision started.
As the two variables defining the stream power equation, that is, the drainage area A and the river gradient S, are highly correlated to Ls by power functions (Hack, 1957), Ls seemed a
priori most relevant for evaluating I. However, according to the Playfair’s law stating that a tributary usually joins the principal stream at the latter’s level (Playfair, 1802), the incision within a (sub)tributary also depends on what happens at its own partial base level, which is represented by its confluence with a higher-order stream. It thus strongly depends on the tributary’s position within the basin, via the amount of incision of the principal river at that point. We took this position factor into account by including Lc in the expression of I. Therefore,
we could reproduce that, due to the basin-scale upstream decrease of incision, expressed in the form of the Lc
-dependence of I, the same small Ls implies a different amount
of incision near the source of the trunk stream and in a small tributary flowing into the latter near the regional base level. In other words, the Lc factor better accounted for the upstream
propagation of a wave of regressive erosion.
We evaluated two opposed formulations of various relations linking I to Ls (or A) and Lc, either constraining the incision to
be zero at all river sources and letting it develop downstream with increasing stream power, or starting from the incision value measured at the basin outlet for the considered period of time and describing the propagation of the incision within the whole basin by regressive erosion.
Tributary junction adjustment
After the best non-linear estimation was selected based on the quality of the adjustment and the analysis of the residuals
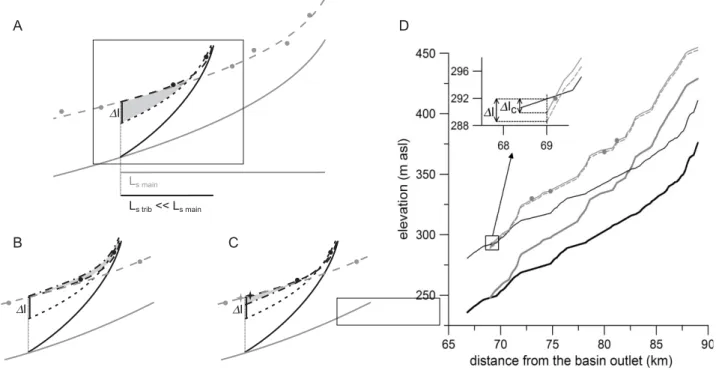
distribution, we still had to remove artificial jumps appearing in the calculated incision values at the confluences and leading to a systematic underestimate of the incision in the lower reach of the tributaries (Figure 3). Indeed, as the incision equation involves the distance to the source Ls, such jumps are
system-atically associated with every tributary junction, due to the step change in Ls when going up from the main river into the
tributary. The jump’s amplitude depends on the ratio between the two streams’ Ls at the junction, much in the way high ratios
of drainage area characterize the junctions where hanging valleys are observed in eastern Taïwan (Wobus et al., 2006) but with the difference that incision jumps affect here all tributary junctions. A similar feature is also produced by the incision models based on the stream power equation but, whereas forward modelling rapidly relaxes the initial steepening of the tributary profiles (Niemann et al., 2001; Crosby et al., 2007), our incision formulation using time-independent vari-ables is unable to cope with the problem and we have to solve it otherwise. As described later, we compared two different ways of correcting for these jumps. First, in order to remove them completely, we applied a correction term to the incision computed in the tributaries. This correction term was defined as +Ii*ΔI/Ic, where Ii is the computed local incision, ΔI is
the incision jump at the confluence, and Ic is the incision
computed at the confluence. It is linearly dependent on the tributary incision and cancels exactly the incision step at the junction. Second, we tested an approach in which we made the tributary incision just upstream of the confluence equal the incision value computed for the principal river at the same place. These pairs of incision values attached to the junctions were then included in an extended dataset for a second adjust-ment taking explicitly the Playfair’s law into account.
Finally, the corrected expression was used to compute the incision over the whole drainage network and to reconstruct the YMT long profiles. The corresponding paleotopography was retrieved by expanding transversally the latter until they intersected the DEM hillslopes and, subtracting the present-day topography from the reconstructed one, we obtained the volume eroded by river incision. Due to the development of entrenched meanders, the simple method used to reconstruct the YMT paleotopography induced a slight underestimation of the eroded volume, however not exceeding a few percentages at the basin scale (Figure 4).
Results
River incision equation
A finite amount of incision being simply the difference between two successive long profiles, it can be tentatively defined by the same functions as the river profiles themselves, i.e. mainly power, logarithmic or exponential functions (Hack, 1957; Snow and Slingerland, 1987; Morris and Williams, 1997; Hovius, 2000). Our tests of several univariate relations showed that, in the Ourthe basin, a power law was always most appropriate to express the link between I and the other variables (Ls, A,
Lc). Moreover, Ls, including the combined contributions of
A and S, was systematically more effective than A to predict I. Taken individually, the variables Ls, A and Lc explained
~50–60% of the variance of I. Also, Ls and Lc appeared
satisfactorily independent, with separate contributions to the variance of I.
The best non-linear fit was obtained with an equation in the form: I = I0*(1 – a*Lc b /Ls c ) (1)
Copyright © 2009 John Wiley & Sons, Ltd. Earth Surf. Process. Landforms 34, 1487–1496 (2009)
where I0= 64 m, the incision measured at the basin outlet,
and the Lc and Ls unit = 10 km. Because of the involved
variables and the adopted power form, this function is basically related to the stream power equation that governs the detachment-limited models of river incision used in high relief areas, where bedrock channel incision prevails (e.g. Seidl and Dietrich, 1992; Whipple and Tucker, 1999). This widely accepted equation expresses that the incision rate ε= KAmSn, where A is the drainage area, a proxy for discharge, and S is the gradient of the channel. Despite extended floodplain
development in most large rivers of the study area, the detachment-limited assumption basically suits because, during the periods favourable to incision, the rivers rapidly cut across their alluvial deposits to chiefly carve their valley and entrench their meanders into the bedrock. Allowing for the observed ~0·05–0·1 mm/y individual vertical motion rates of the massif-bounding faults, the ~105-year-long periods
without incision might have repeatedly produced 5–20 m-high knick points, too small to lead to interference between rock mechanics and fluvial controls on incision (Seidl et al.,
Figure 3. Correction of the incision jumps induced at the confluences due to the use of Ls as an independent variable in the model equation. (A)
Uncorrected adjustment: large underestimation ΔI of the calculated tributary incision at – and upstream of – the confluence, resulting from the abrupt decrease in Ls when entering the tributary. (B) Applying a correction term to the incision all along the tributary, that is, stretching the jump’s
correction over the whole length of the tributary, removes it totally but may involve a significant overestimation of the incision in the tributary (area in grey) because the actual incision decreases often more rapidly upstream than the linear correction term. (C) Reduced underestimation (area in grey) of the incision after a second adjustment has been carried out using additional incision data at the confluences but leaving the model free to adjust everywhere. Circles: original incision data (filled black circles: tributary; filled grey circles: trunk stream). Stars: additional confluence data derived from the main stream’s incision value in the first adjustment. Solid lines: present-day long profiles; dashed lines: YMT true profiles; dotted lines: YMT tributary profile obtained from a first adjustment; axis lines: YMT tributary profile after correction for the incision jump. (D) Present (thick lines) and YMT (thin lines) long profiles of the Amblève (in black) and its tributary, the Salm (in grey). As for the Salm YMT profiles, the uncorrected profile is shown by a dashed line and the profile corrected for the incision jump (which reduces then from ΔI to ΔIc,
see the inset) shown by a solid line. Grey dots are for the YMT data in the Salm valley.
Figure 4. Transverse profile at the apex of an entrenched meander, showing how our very simple reconstruction of the YMT topography may locally underestimate the eroded volume. Black arrow: shift of the meander axis during incision. The grey area denotes the computed eroded slice, which is underestimated by the difference between the hatched areas above and below the bold line taken to represent the bottom of the YMT floodplain (the true YMT transverse profile is represented by the dashed line). Taking into account that omitted part of post-YMT incision in the meander vertical section and the average percentage of a valley length occupied by the meander bends, we evaluate that the resulting error does not exceed 10% of the eroded volume computed for the whole Ourthe basin.
1996) but large enough to accelerate the removal of the alluvial cover and to initiate a wave of regressive incision (Hovius, 2000).
After removal of nine outliers >2σ (mostly related to unreliable data towards the headwaters), a first adjustment based on the remaining set of 62 incision data yielded the values 0·15, 0·66 and 0·37 for the parameters a, b, and c of equation (1), and an excellent multiple correlation coefficient R = 0·92. The latter was significantly better than the R = 0·84 obtained with a relation in the form I = a*Lsb/Lcc, showing that I is better
predicted by constraining its value at the basin outlet and calculating it in the upstream direction (regressive prediction) rather than applying a constraint of zero incision at all sources and running the network downstream.
Tributary junction adjustment
As stated earlier, we attempted to remove the incision jumps occurring at the tributary junctions first by applying a correction term to the tributary incision. After we had so removed the incision jumps and subsequently imposed corrected incision values all along the tributaries, we obtained a lower R of 0·87 (with 12 outliers excluded and two missing data, i.e. n = 57) and, based on the entire dataset, a mean residual νm of –2·5 m
due to an overestimation of I mainly in the smallest tributaries (Figure 3B; note also that, because of the upward widening of the valley transverse profile, a small overestimate of I may lead to a much larger exaggeration of the calculated eroded volume).
The alternate approach to the jumps’ correction was to add to the dataset pairs of new values representing the incision previously computed in the main stream, and thus also expected in the tributary, at the junctions. We used the pairs of values corresponding to the confluences of all tributaries with a length of more than 15 km. A second adjustment based on this new dataset (n = 90) left the correlation coefficient and the parameters of the original incision function practically unchanged (R = 0·91; a = 0·15; b = 0·65; c = 0·37) (Figure 5). In this approach, which left the model free to adjust at the junctions, the incision jumps at the confluences were only
somewhat lowered. However, being then ≤5·7 m for all tributaries with a length greater than 20 km, they lay well below the maximum (depending on Lc and Ls) uncertainty on ν due to measurement errors at the 95% confidence level (6·9 m). Moreover, there exists a strong correlation (R = 0·91) between the remaining incision jumps and the length of the tributaries, (ΔI ∝ Ls–2), which, following the relation given
by Brush (1961), can also be expressed in function of the local gradient of the present-day long profile (ΔI ∝ S 2·85
). As the observed and modelled gradients of the YMT profiles are low in the lower reaches of even the smallest streams, the upstream decrease of incision depends actually mainly on the slope S of the present-day profiles, meaning that the higher shortage in modelled incision induced by the confluence jumps ΔI in the smaller tributaries is generally absorbed within ~1 km by the rapid upstream increase of their longitudinal slope (Figure 3C). We therefore privileged this second treatment of the incision jumps.
River incision amount
The final incision map obtained through this approach shows that the incision calculated along the valley axes decreases only slowly in the upstream direction until it approaches a source, an exponential reduction to zero incision mostly occurring for Ls <5 km (Figure 6). It also underscores that the effectiveness
of the incision wave propagation toward the headwaters varies with the position in the network, diminishing in the regions most remote from the basin outlet. Moreover, independently of the depth of incision, the width of the incised valleys is strongly controlled by the lithology.
As the 6·9 m maximum error on ν at the 95% confidence level corresponds to ~1·6σ of the final incision relation, we identified those outliers >1·6σ as anomalous incision values. Apart from the few poorly modelled areas in the smallest tributaries, a zone of exacerbated incision appears in the middle Vesdre valley, while weaker incision is encountered in the middle valleys of the Magne and the Hoëgne (Figure 6). Another less well defined zone of reduced incision is centred on the Ourthe-Amblève confluence. Although the modelled propagation of the incision wave appears fairly realistic, the analysis of these anomalies of incision allows us to further ascertain whether our regional model applies correctly over the whole study area. Beyond possible misidentification of the YMT in some places, notably causing statistical outliers towards the headwaters, areas of anomalous incision can express lithological, tectonic or hydrographic (e.g. stream piracy) effects. Corresponding to the largest observed anomaly, the excess incision in the middle Vesdre valley appears closely related to local tectonics as it occurs where the valley is crossed by the active Hockai fault zone (Figure 6). As for the Magne negative anomaly, it is located upstream of a marked knick point in the present long profile, due to the occurrence of limestones com-bining a high mechanical resistance with the development of karstic sinks, and it is thus of lithological origin. The other areas of reduced incision are also likely related to the local lithology. These few local deviations do not affect the overall quality of our incision computations.
As a result, we calculated a volume of 11·5 km3 removed
by river incision from the Ourthe basin since 0·7 Ma. As stated earlier, we had to add to this figure the error due to the lateral development of some entrenched meanders during incision, which we estimated at a maximum 10%, i.e. ~1·1 km3, on the
basis of the hydrographic network planform and a mean valley cross-section. We calculated moreover that the total shortage of calculated incision in the tributaries near their confluence
Figure 5. Observed versus calculated incision in the Ourthe basin since 0·7 Ma following the adjustment taking into account the confluence data added to the original dataset to satisfy the Playfair’s law. Circles: original incision data; solid triangles: confluence data for tributaries longer than 20 km; open triangles: confluence data for tributaries of length between 15 and 20 km. The distance between the elements of each horizontal pair of triangles denotes the remaining incision jump at the corresponding confluence.
Copyright © 2009 John Wiley & Sons, Ltd. Earth Surf. Process. Landforms 34, 1487–1496 (2009)
is in the order of a few tenths of km3. This makes a maximum
eroded volume of ~13 km3
due to valley incision, which affected 22% of the basin surface (as opposed to hillslope erosion occurring on the watersheds).
Finally, for the sake of comparison with other denudation data, we extrapolate to the Meuse basin upstream of Maastricht the incision rate derived for the Ourthe basin. This requires however that we incorporate the following conservative approximation: as the Ourthe basin pertains to the most incised area of the Ardennes massif and of the whole Meuse basin, its incision rate represents an uppermost limit. According to the 3·1:20 ratio between the areas of the two basins, incision in the Meuse basin would thus have removed a maximum 84 km3
of rock since 0·7 Ma.
Interfluve denudation
Regarding the denudational behaviour of its interfluves (taken as part of the landscape located above the YMT), the Meuse basin upstream of Maastricht (with an area of ~20 000 km2)
may be morphologically divided in four subareas: (1) the central Ardennes tableland, (2) the Fagne-Famenne area, (3) the cuesta landscape of the northern Paris basin, and (4) the undulating lower plateau of the Condroz along the northern margin of the massif (Figure 1). Within the Ardennes massif, which represents about 30% of the Meuse basin upstream of Liège, the post-0·7 Ma stripping of the interfluves preserved the main features of the Tertiary and pre-YMT landscape and the associated loose sediments and material outside the incised valleys: pre-Quaternary kaolinic weathering products, clay-with-flints and sand remains of former upper Cretaceous and lower Oligocene covers, extended remnants of the YMT and older terrace deposits. Based on these observations and on erosion values derived for similar mid-latitude gently
undulating tablelands (Ahnert, 1970; Pazzaglia and Gardner, 2000), denudation rates most probably did not exceed ~5–
10 mm/ky in this area, thus removing a maximum 33 km3
from the Ardennian part of the Meuse basin since 0·7 Ma. On the contrary, under the morphogenic conditions prevailing during the post-0·7 Ma cold periods (sparse vegetation, fast rock mass disintegration, enhanced runoff and mass wasting), other areas of the Meuse basin with more erodible bedrock underwent a strong periglacial erosion that was able to remove huge volumes of rock. In the region of the Fagne-Famenne, located between central Ardennes and the less uplifted Condroz plateau to the north (Figure 1), the extensively outcropping Frasnian/Famennian shales were readily disintegrated by frost shattering and the removal of the weathering products by slope wash led to the development of extensive Quaternary pediments connected downslope to the fluvial terraces (Alexandre, 1976). Since the abandonment of the Neogene planation surface at ~375 m local elevation, this ~1000-km2-large
area with 225 m present mean elevation was stripped of a 150-m-thick rock slice. In the absence of dating of intermediate morphological levels, and considering the chief processes active in the denudation of the Fagne-Famenne, we conservatively assume that most of this volume was eroded during the harsher post-0·7 Ma glacials, corresponding to the removal of 117 km3.
A more moderate evolution characterized the remaining areas of the Meuse catchment, pertaining to the northern Paris basin and the Condroz plateau. Scouring of the depressions between the cuestas that extend along the southern margin of the Ardennes massif and carving of the limestone bedrock in the synclines of the Condroz area removed a mean 40-m-thick rock slice from the Miocene topography on the interfluves of both regions. However, owing to the nature of the bedrock (soft sediments in the Paris basin and limestone and sandstone in the Condroz), we take into account that there, the Pliocene
Figure 6. Map of the calculated incision in the Ourthe basin since 0·7 Ma. The areas of anomalous observed incision (+: excess of incision, –: deficiency in incision) are circled (V, Vesdre; M, Magne; H, Hoëgne; O-A, Ourthe-Amblève). They are identified as groups of residuals higher than 6·9 m (95% measurement error, corresponding to 1·6σ of the calculated relation).
and early Pleistocene denudation was hardly less efficient than the erosion in the last million years. Therefore, and though it is probably still an excessive estimate, ascribing half of the removed volume to the latter in the two regions makes it contribute for approximately 142 km3
to the post-0·7 Ma denudation of the Meuse basin.
Discussion
Tectonic versus climatic cause of the denudation
The cosmogenic 10Be studies of dated terrace deposits of the Meuse in the Maastricht area have led to the arguing that uniform catchment-averaged rates of ~30 mm/ky were characteristic of the timespan 1·3–0·7 Ma, then rates increased rapidly to keep in the range 40–60 mm/ky, reaching even 80 mm/ky in the latest Pleistocene (Schaller et al., 2001; Schaller et al., 2002; Schaller et al., 2004; von Blanckenburg, 2005). This prompted Schaller et al. (2004) to evaluate the respective roles of climate and tectonics in this increase of the denudation rate. According to them, while the abrupt increase in amplitude of the 100-ky glacial cycles around 0·64 Ma (Mudelsee and Schulz, 1997) might have been partly responsible for the observed changes in erosion rate, the uplift of the Ardennes and the Rhenish shield, driven by the Eifel mantle plume (Ritter et al., 2001), would have had the strongest control on them. However, they noted that active interfluve denudation, which has not yet ceased and would be responsible for the recent high denudation rates, is decoupled from the rapid and brief fluvial incision response to the tectonic pulse that occurred around 0·7 Ma.
Our working hypothesis is also that a pulse of rock uplift around, or prior to 0·7 Ma induced a generalized incision of the valleys within the massif. This does not necessarily mean that fluvial erosion was exclusively caused by active tectonics. From a synthesis of many terrace studies in Europe and world-wide showing that river valleys in non-subsiding areas almost systematically display middle Pleistocene terrace staircases, Bridgland et al. (2007) suggested that only a global trigger, namely the climatic deterioration at 0·7 Ma, could have induced this river incision, maintained through isostatic rebound and lateral flow in the lower crust. Nevertheless, the incision much deeper within the Ardennes-Rhenish shield than in surrounding stable areas, up to ~200 m in the Eifel (Meyer and Stets, 1998) versus ~50 m for rivers of the western Paris basin (Antoine
et al., 2007), indicates that a significant part of that pulse was
of tectonic origin in the Ardennes. This is further confirmed by the Quaternary Eifel volcanism starting at the same time (Schmincke, 2007). However, the deepened valleys did not significantly nibble at the interfluves above the YMT, as shown by the good preservation of numerous YMT and older terrace remnants. Moreover, although the amount of uplift is still debated, it was obviously small enough not to really alter the regional climatic conditions of weathering, nor did it modify the slopes outside the valleys, except at the rim of the massif, thus not causing any significant change in erosion of the interfluves. It follows that fluvial incision can be regarded as the only denudational response to the mid-Pleistocene tectonic uplift of the Ardennes massif and that denudation of the interfluves was controlled primarily by the climatic conditions. Our calculations yielded 84 km3 of rock removed by river
incision and 292 km3
by interfluve denudation, that is, a total 376 km3 of rock eroded from the Meuse basin since 0·7 Ma.
We repeat that, on the one hand, our figures for interfluve denudation are excessive estimates resulting from the assump-tion that the morphogenetic setting during the last 0·7 Ma
was particularly favourable to erosion and, on the other hand, a part of the post-0·7 Ma incision of the valleys probably also responded to a global climatic trigger, as suggested by a comparison with the incision amount of western European rivers of similar size outside the massif (Antoine, 1994; Bridgland, 2000; Maddy et al., 2001). However, as these two effects counterbalance more or less, a first-order approximation shows that the tectonic uplift of the Ardennes would have been responsible, through river incision, for an approximate 84/ 376, that is, 22% of the total post-0·7 Ma denudation in the Meuse basin.
Consequently, according to the relative values of the 10
Be-derived estimates, which indicate a rough doubling of the regional denudation rate at the onset of the middle Pleistocene (Schaller et al., 2004), the tectonically-driven resumption of river incision would have contributed slightly less than the half to this increase, the remainder coming chiefly from the accelerated erosion of the Fagne-Famenne area. However, before endorsing such a conclusion, we must still examine the consistency between the geomorphological and 10Be
denuda-tion data in the Ardennes.
Meaning of the
10Be-derived denudation rates
Even the roughest estimate of a 10Be-derived mean denudation
rate for the Meuse basin over the timespan 0·7–0 Ma must take into account that the values provided by Schaller et al. (2002, 2004) and mentioned in the previous section were obtained from cold-stage erosion products, whereas rates are observed to decrease drastically during the inter-glacials, the Holocene rates being estimated between 15 and 20 mm/ky from measure-ments of dissolved and suspended loads transported by the Meuse river (Petit and Hallot, 2006). Consequently, and taking a 3:1 ratio for the glacial versus interglacial durations, the overall 10Be-derived denudation rate, averaged over the Meuse
basin upstream of Maastricht for the time since 0·7 Ma, may be calculated in the order of a good 40 mm/ky.
By contrast, averaged over the same area and time span, the 376 km3 eroded volume calculated from geomorphological
data translates as a denudation rate of 27 mm/ky. As the 13 mm/ ky difference with the 10Be-derived rate largely exceeds the
uncertainty on the latter’s estimate and the ‘geomorphological’ rate was willingly rather overestimated, we conclude that the
10
Be-derived rate must be in some way biased and that the claim that it represents a basin average does not hold true in the case of the Meuse basin. Indeed, several of the assumptions underlying such a claim (Brown et al., 1995; Bierman and Steig, 1996; Granger et al., 1996) are not encountered here.
Schaller et al. (2002) had already noted in passing that, should denudation have been spatially non-uniform, because of an overwhelming imprint of fluvial incision for instance, the 10
Be-inferred rates would then be improperly extrapolated to the entire basin and overestimate the denudation. Nevertheless, they no longer retained this possibility in their discussion. However, a major deviation from the assumptions mentioned earlier was that the 0·5–1 mm grain size fraction used for the 10Be analyses (Schaller et al., 2004) largely
overlooked the contribution of several regions of the basin. In particular, the slowly eroding Ardennian interfluves, which supplied mainly silts and clays derived from their extended Tertiary weathering mantle, and the fast evolving Fagne-Famenne area, which delivered frost-shattered schist flakes reduced to silt long before they reached the Meuse valley, are poorly represented in the sand fraction of the Meuse sediments. Moreover, the extensive preservation of older morphological features above the YMT level highlights the decoupling between valley
Copyright © 2009 John Wiley & Sons, Ltd. Earth Surf. Process. Landforms 34, 1487–1496 (2009)
incision and interfluve denudation. This resulted in a spatially non-uniform long-term probability for the erosion products to reach the valley floors and be incorporated in the sampled alluvial deposits, the latter coming predominantly from the steep slopes of the narrow valleys that incised rapidly the Ardennes massif.
Therefore, the 10
Be-derived middle Pleistocene rates of 40– 60 mm/ky, up to 80 mm/ky, are likely to record mainly river incision, which we measured between 65 and 90 mm/ky for the main rivers of the Ourthe basin since 0·7 Ma. This interpretation leads to a new understanding of the observed recent increase of the 10Be rates, which, rather than showing the development of
trunk stream erosion into ‘spatial denudation’ (von Blanckenburg, 2005), might reflect the propagation of a wave of regressive erosion only within the hydrographic network, and the consequent increase with time of the latter’s part supplying sediments through fast erosion of the valley slopes. By contrast, our calculated denudation rate of 27 mm/ky is remarkably consistent with the average rates of 25 –30 mm/ky deduced from cosmogenic nuclide concentrations in present-day alluvium for basins in the fairly similar setting of the Great Smoky Mountains (pertaining to the Appalachian Mountains) during the last ~20–25 ky (Matmon et al., 2003).
Conclusions
In this study, we showed that the best statistical model to estimate the finite amount of incision resulting from rock uplift of the Ardennes massif since 0·7 Ma uses an expression that calculates the incision in a regressive way from the basin outlet. Tuned to the Ourthe basin of central Ardennes, this functional model includes power law relationships between
I, Ls and Lc in a two-step adjustment aimed at minimizing
the incision jumps generated at the confluences by the com-putation. It has calculated that ~13 km3 of rock were removed
from the Ourthe basin by fluvial erosion since 0·7 Ma. Extrapolated at the level of the Meuse basin, this yields a volume of 84 km3
removed by river incision, while geomorphological estimates of the interfluve denudation amount to ~292 km3
during the same period. Therefore, the denudational response to the tectonic forcing, which happened almost exclusively through river incision, represents only a maximum ~22% of the total post-0·7 Ma denudation. The main part of the remainder was eroded by periglacial slope processes in parts of the basin with outcropping weak rocks. These regions are located in the margins of the uplifted Ardennes and their denudation was obviously climatically driven.
Moreover, the overall post-0·7 Ma denudation rate estimated from geomorphological observations amounts to only two-thirds of the rate derived from 10
Be data for the same area, suggesting that the latter is exaggerated, probably due to the incomplete representation of the basin’s sediments in the sampled material and to an overrepresentation of the erosion products of the rapidly incising valleys in the alluvial deposits. While the geomorphologically-derived mean erosion rate of 27 mm/ky is identical to those deduced from cosmogenic nuclide data in the north-American equivalent of the Variscan massifs of north-western Europe, the paleorates in the range 40–80 mm/ky derived from 10Be concentrations in middle
and upper Pleistocene terrace sediments of the Meuse basin would be much closer to the incision rates of the time in the Ardennes region.
Therefore, in the absence of a reliable geomorphological estimate of the pre-0·7 Ma erosion rates, it is still difficult to obtain an independent quantitative evaluation of the middle Pleistocene increase of the total denudation rate. Two factors
seem however to have concurred more or less equally in such a change, namely the tectonically-driven river incision and the climatically-triggered enhanced erosion of the Fagne-Famenne area.
Acknowledgements—This paper greatly benefited from meaningful comments of two anonymous reviewers and S. Lane, Associate Editor.
References
Ahnert F. 1970. Functional relationships between denudation, relief, and uplift in large mid-latitude drainage basins. American Journal of Science 268: 243–263.
Alexandre J. 1976. Les surfaces de transgression exhumées et les surfaces d’aplanissement. In Géomorphologie de la Belgique, Pissart A (ed.). Université de Liège: Liège; 75–92.
Alexandre S, Kupper M. 1976. L’évolution des rivières. In Géomorphologie de la Belgique, Pissart A (ed.). Université de Liège: Liège; 51–74.
Antoine P. 1994. The Somme Valley terrace system (Northern France): a model of river response to quaternary climatic variations since 800000 BP. Terra Nova 6: 453–464.
Antoine P, Limondin Lozouet N, Chaussé C, Lautridou JP, Pastre JF, Auguste P, Bahain JJ, Falguères C, Galehb B. 2007. Pleistocene fluvial terraces from northern France (Seine, Yonne, Somme): synthesis, and new results from interglacial deposits. Quaternary Science Reviews 26: 2701–2723.
Bierman P, Steig E. 1996. Estimating rates of denudation using cosmogenic isotope abundances in sediment. Earth Surface Processes and Landforms 21: 125–139.
Boenigk K, Frechen M. 2006. The Pliocene and Quaternary fluvial archives of the Rhine system. Quaternary Science Reviews 25: 550–574.
Bonnet S, Guillocheau F, Brun JP. 1998. Relative uplift measured using river incision: the case of the Armorican basement (France). Comptes Rendus de l’Académie des Sciences 327: 245–251. Bridgland D. 2000. River terrace systems in north-west Europe: an
archive of environmental change, uplift and early human occupation. Quaternary Science Reviews 19: 1293–1303.
Bridgland D, Westaway R. 2008. Climatically controlled river terrace staircases: a worldwide Quaternary phenomenon. Geomorphology 98: 285–315.
Bridgland D, Keen D, Westaway R. 2007. Global correlation of Late Cenozoic fluvial deposits: a synthesis of data from IGCP 449. Quaternary Science Reviews 26: 2694–2700.
Brown E, Stallard R, Larsen M, Raisbeck G, Yiou F. 1995. Denudation rates determined from the accumulation of in situ-produced 10
Be in the Luquillo Experimental Forest, Puerto Rico. Earth and Planetary Science Letters 129: 193–202.
Brush L. 1961. Drainage Basins, Channel and Flow Characteristics of Selected Streams in Central Pennsylvania, US Geological Survey Professional Paper 282F. US Geological Survey: Reston, VA; 145– 181.
Camelbeeck T, Meghraoui M. 1998. Geological and geophysical evidence for large palaeoearthquakes with surface faulting in the Roer graben (northwestern Europe). Geophysical Journal International 132: 347–362.
Chapelier A. 1957. Nouvelles observations sur les niveaux de terrasse de la Vesdre. Annales de la Societe Geologique de Belgique 80: 379–394.
Cornet Y. 1995. L’encaissement des rivières ardennaises au cours du Quaternaire. In L’Ardennes. Essai de géographie physique, Demoulin A (ed.). University of Liège: Liège; 155–177.
Crosby B, Whipple K, Gasparini N, Wobus C. 2007. Formation of fluvial hanging valleys: theory and simulation. Journal of Geophysical Research 112: F03S10. DOI: 10.1029/2006JF000566
Ek C. 1957. Les terrasses de l’Ourthe et de l’Amblève inférieures. Annales de la Societe Geologique de Belgique 80: 333–353. Granger D, Kirchner J, Finkel R. 1996. Spatially averaged long-term
erosion rates measured from in situ-produced cosmogenic nuclides in alluvial sediment. Journal of Geology 104: 249–257.
Hack J. 1957. Studies of Longitudinal Stream Profiles in Virginia and Maryland, US Geological Survey Professional Paper 294B. US Geological Survey: Reston, VA; 45–97.
Hoffmann R. 1996. Die quartäre Tektonik des südwestlichen Schiefergebirges begründet mit der Höhenlage der jüngeren Hauptterrasse der Mosel und ihrer Nebenflüsse. Bonner Geowissenschaftliche Schriften 19: 156p.
Houtgast R, Van Balen R, Kasse C. 2005. Late Quaternary evolution of the Feldbiss Fault (Roer Valley Rift System, the Netherlands) based on trenching and its potential relation to glacial unloading. Quaternary Science Reviews 24: 491–510.
Hovius N. 2000. Macroscale process systems of mountain belt erosion. In Geomorphology and global tectonics, Summerfield M (ed.). Wiley: Chichester; 77–105.
Maddy D, Bridgland D, Westaway R. 2001. Uplift-driven valley incision and climate-controlled river terrace development in the Thames valley, UK. Quaternary International 79: 23–36.
Matmon A, Bierman P, Larsen J, Southworth S, Pavich M, Finkel R, Caffee M. 2003. Erosion of an ancient mountain range, the Great Smoky Mountains, North Carolina and Tennessee. American Journal of Science 303: 817–855.
Meyer W, Stets J. 1998. Junge Tektonik im Rheinischen Schiefergebirge und ihre Quantifizierung. Deutsche Geologische Gesellschaft 149: 359–379.
Meyer W, Stets J. 2007. Quaternary uplift in the Eifel area. In Mantle Plumes. A Multidisciplinary Approach, Ritter J, Christensen U (eds), Springer: Berlin; 369–378.
Morris P, Williams D. 1997. Exponential longitudinal profiles of streams. Earth Surface Processes and Landforms 22: 143–163. Mudelsee M, Schulz M. 1997. The mid-Pleistocene climate
transition: onset of 100 ka cycle lags ice volume build-up by 280 ka. Earth and Planetary Science Letters 151: 117–123. Niemann J, Gasparini N, Tucker G, Bras R. 2001. A quantitative
evaluation of Playfair’s law and its use in testing long-term stream erosion models. Earth Surface Processes and Landforms 26: 1317– 1332.
Pazzaglia F, Gardner T. 2000. Late Cenozoic landscape evolution of the US Atlantic passive margin: insights into a North American Great Escarpment. In Geomorphology and Global Tectonics, Summerfield M (ed.). Wiley Interscience: Chichester; 284–302. Peters G, Van Balen R. 2007. Tectonic geomorphology of the
northern Upper Rhine Graben, Germany. Global and Planetary Change 58: 310–334.
Petit F, Hallot E. 2006. Caractérisation et quantification du transport des sédiments en rivières (matières en suspension et charge de fond) en relation avec une différenciation régionale. Interm Report, Convention 05/43364, DCENN, Région Wallonne.
Playfair J. 1802. Illustrations of the Huttonian Theory of the Earth. Dover: London.
Quinif Y. 1999. Karst et évolution des rivières: le cas de l’Ardennes. Geodinamica Acta 12: 267–277.
Ritter J, Jordan M, Christensen U, Achauer U. 2001. A mantle plume below the Eifel volcanic fields, Germany. Earth and Planetary Science Letters 186: 7–14.
Schaller M, von Blanckenburg F, Hovius N, Kubik P. 2001. Large-scale erosion rates from in-situ produced cosmogenic nuclides in European river sediments. Earth and Planetary Science Letters 188: 441–458.
Schaller M, von Blanckenburg F, Hovius N, Veldkamp A, Van den Berg M, Kubik P. 2004. Paleoerosion rates from cosmogenic 10Be in
a 1·3 Ma terrace sequence: response of the River Meuse to changes in climate and rock uplift. Journal of Geology 112: 127–144. Schaller M, von Blanckenburg F, Veldkamp A, Tebbens L, Hovius N,
Kubik P. 2002. A 30 000 yr record of erosion rates from cosmogenic 10Be in Middle European river terraces. Earth and Planetary Science Letters 204: 307–320.
Schmincke H. 2007. The Quaternary volcanic fields of the East and West Eifel (Germany). In Mantle Plumes, A Multidisciplinary Approach, Ritter J, Christensen U (eds). Springer: Berlin; 241–322. Seidl M, Dietrich W. 1992. The problem of channel erosion into
bedrock. Catena Supplement 23: 101–124.
Seidl M, Weissel J, Pratson L. 1996. The kinematics of escarpment retreat across the rifted continental margin of SE Australia. Basin Research 12: 301–316.
Sklar, L, Dietrich, W. 1998. River longitudinal profiles and bedrock incision models: Stream power and the influence of sediment supply. In Rivers Over Rock: Fluvial Processes in Bedrock Channels, Tinkler K, Wohl E (eds), Geophysical Monograph Series, 107. AGU: Washington, DC; 237–260.
Sklar L, Dietrich W. 2004. A mechanistic model for river incision into bedrock by saltating bed load. Water Resource Research 40: W06301. DOI: 10.1029/2003WR002496
Snow R, Slingerland R. 1987. Mathematical modeling of graded river profiles. Journal of Geology 95: 15–33.
Van Balen R, Houtgast R, Van der Wateren F, Vandenberghe J, Bogaart P. 2000. Sediment budget and tectonic evolution of the Meuse catchment in the Ardenness and the Roer Valley Rift System. Global and Planetary Change 27: 113–129.
Van den Berg M. 1996. Fluvial Sequences of the Maas. A 10 Ma Record of Neotectonics and Climate Change at Various Time-scales. Landbouwuniversiteit Wageningen: Wageningen.
Von Blanckenburg F. 2005. The control mechanisms of erosion and weathering at basin scale from cosmogenic nuclides in river sediment. Earth and Planetary Science Letters 237: 462–479. Whipple K, Tucker G. 1999. Dynamics of the stream-power river
incision model: implications for height limits of mountain ranges, landscape response timescales, and research needs. Journal of Geophysical Research 104B: 17661–17674.
Whipple K, Tucker G. 2002. Implications of sediment-flux-dependent river incision models for landscape evolution. Journal of Geophysical Research 107B: 2039. DOI: 10.1029/2000JB000044 Wobus C, Crosby B, Whipple K. 2006. Hanging valleys in fluvial
systems: controls on occurrence and implications for landscape evolution. Journal of Geophysical Research 111: F02017. DOI: 10.1029/2005JF000406
Ziegler P, Dèzes P. 2007. Cenozoic uplift of Variscan Massifs in the Alpine foreland: timing and controlling mechanisms. Global and Planetary Change 58: 237–269.