doi:10.1182/blood-2004-09-3728
Prepublished online Mar 10, 2005;
2005 106: 27-34
Mandelli, Theo De Witte and for the EORTC/GIMEMA Leukemia Groups
Leoni, Giuseppe Leone, Marco Casini, Francesco Ricciuti, Marco Vignetti, Filip Beeldens, Franco
Muus, Francois Lefrère, Zwi Berneman, George Fillet, Claudio Denzlinger, Roel Willemze, Pietro
Sergio Amadori, Stefan Suciu, Ulrich Jehn, Roberto Stasi, Xavier Thomas, Jean-Pierre Marie, Petra
phase-3 study
older with acute myeloid leukemia: final results of AML-13, a randomized
and/or after induction chemotherapy in patients 61 years of age and
Use of glycosylated recombinant human G-CSF (lenograstim) during
http://bloodjournal.hematologylibrary.org/cgi/content/full/106/1/27
Updated information and services can be found at:
(2536 articles)
Clinical Trials and Observations
(4224 articles)
Neoplasia
(2488 articles)
Hematopoiesis and Stem Cells
collections:
Blood
Articles on similar topics may be found in the following
http://bloodjournal.hematologylibrary.org/misc/rights.dtl#repub_requests
Information about reproducing this article in parts or in its entirety may be found online at:
http://bloodjournal.hematologylibrary.org/misc/rights.dtl#reprints
Information about ordering reprints may be found online at:
http://bloodjournal.hematologylibrary.org/subscriptions/index.dtl
Information about subscriptions and ASH membership may be found online at:
.
Hematology; all rights reserved
Copyright 2007 by The American Society of
200, Washington DC 20036.
semimonthly by the American Society of Hematology, 1900 M St, NW, Suite
Blood (print ISSN 0006-4971, online ISSN 1528-0020), is published
For personal use only.
by on March 27, 2009.
www.bloodjournal.org
Use of glycosylated recombinant human G-CSF (lenograstim) during and/or after
induction chemotherapy in patients 61 years of age and older with acute myeloid
leukemia: final results of AML-13, a randomized phase-3 study
Sergio Amadori, Stefan Suciu, Ulrich Jehn, Roberto Stasi, Xavier Thomas, Jean-Pierre Marie, Petra Muus, Francois Lefre`re, Zwi Berneman, George Fillet, Claudio Denzlinger, Roel Willemze, Pietro Leoni, Giuseppe Leone, Marco Casini, Francesco Ricciuti,
Marco Vignetti, Filip Beeldens, Franco Mandelli, and Theo De Witte, for the EORTC/GIMEMA Leukemia Groups
The role of glycosylated recombinant hu-man granulocyte colony-stimulating fac-tor (G-CSF) in the induction treatment of older adults with acute myeloid leukemia (AML) is still uncertain. In this trial, a total of 722 patients with newly diagnosed AML, median age 68 years, were random-ized into 4 treatment arms: (A) no G-CSF; (B) G-CSF during chemotherapy; (C) G-CSF after chemotherapy until day 28 or recov-ery of polymorphonuclear leukocytes; and (D) G-CSF during and after chemotherapy. The complete remission (CR) rate was
48.9% in group A, 52.2% in group B, 48.3% in group C, and 64.4% in group D. Analysis according to the 2ⴛ 2 factorial design indicated that the CR rate was significantly higher in patients who re-ceived G-CSF during chemotherapy (58.3% for groups Bⴙ D vs 48.6% for groups A ⴙ C; P ⴝ .009), whereas no significant difference was observed be-tween groups Aⴙ B and C ⴙ D (50.6% vs 56.4%, Pⴝ .12). In terms of overall sur-vival, no significant differences were ob-served between the various groups.
Pa-tients who received G-CSF after chemotherapy had a shorter time to neu-trophil recovery (median, 20 vs 25 days;
P < .001) and a shorter hospitalization
(mean, 27.2 vs 29.7 days; P < .001). We conclude that although priming with G-CSF can improve the CR rate, the use of G-CSF during and/or after chemo-therapy has no effect on the long-term outcome of AML in older patients. (Blood. 2005;106:27-34)
© 2005 by The American Society of Hematology
Introduction
More than 70% of patients with acute myeloid leukemia (AML) are older than 60 years, and treatment of these individuals remains a considerable therapeutic challenge.1Older adults are less able to
tolerate intensive chemotherapy regimens (associated with higher remission rates in younger patients), often have pre-existing hematologic disorders, and are more likely to have poor-risk cytogenetic abnormalities or expression of the multidrug resistance phenotype.2-4
Strategies to reduce the toxicity associated with intensive chemotherapy have involved the use of attenuated doses of standard regimens and myeloid growth factors.1,5 Although a
decrease in early death rate can be achieved through dose reduction, response rates are less favorable due to inadequate antileukemic cytotoxicity.5Where active treatment is attempted,
standard practice is thus remission induction followed by a
consolidation phase, the latter intended to eliminate residual leukemia cells. Several trials have investigated the effects of granulocyte colony-stimulating factor (G-CSF) and granulocyte-macrophage colony-stimulating factor (GM-CSF) given after the completion of standard induction chemotherapy.6-11Although these
growth factors can consistently reduce the duration of neutropenia by a few days, they do not modify the overall outcome.12On the
other hand, attempts to improve the response rate by sensitizing leukemic cells with hematopoietic growth factors, administered before or concurrently with remission-induction therapy, have yielded conflicting results.13-22In this report, we present the final
results of a multicenter randomized phase-3 study in which glycosylated recombinant human G-CSF (lenograstim) was given during and/or after an intensive remission induction regimen in patients 61 years of age and older with AML. Our aims were to
From the Department of Hematology, University Tor Vergata, Rome, Italy; European Organisation for Research and Treatment of Cancer (EORTC) Data Center, Brussels, Belgium; the Department of Hematology, Klinikum Grosshadern Ludwig-Maximilians, Munich, Germany; the Hematology Unit, Regina Apostolorum Hospital, Albano Laziale, Italy; the Department of Hematology, Edouard Herriot Hospital, Lyon, France; the Department of Hematology, Hotel-Dieu Hospital, Paris, France; the Department of Hematology, Radboud University Nijmegen Medical Center, Nijmegen, the Netherlands; the Department of Hematology, Necker Hospital, Paris, France; the Department of Hematology, University Hospital, Edegem, Belgium; the Department of Hematology, Sart-Tilman Hospital, Liege, Belgium; the Department of Hematology, University Hospital, Tubingen, Germany; the Department of Hematology, University Hospital, Leiden, the Netherlands; the Department of Hematology, University Hospital, Ancona, Italy; the Department of Hematology, Catholic University, Rome, Italy; the Department of Hematology, General Hospital, Bolzano, Italy; the Department of Hematology, S. Carlo Hospital, Potenza, Italy; Gruppo Italiano Malattie Ematologiche dell’Adulto (GIMEMA) Data Center, Rome, Italy; and the Department of Hematology, University La Sapienza, Rome, Italy.
Submitted September 27, 2004; accepted February 25, 2005. Prepublished online as Blood First Edition Paper, March 10, 2005; DOI 10.1182/blood-2004-09-3728.
Supported in part by grants from the National Cancer Institute (grant numbers 2U10-CA11488-25 through 5U10-CA11488-34). Chugai-Aventis provided an educational grant and GRANOCYTE free of charge.
A list of participating members of the EORTC and GIMEMA Leukemia Groups appears in “Appendix.”
An Inside Blood analysis of this article appears at the front of the issue.
Reprints: Sergio Amadori, Department of Hematology, University “Tor
Vergata,” St Eugenio Hospital, P.le dell’Umanesimo, 10, 00144 Rome, Italy; e-mail: mc7673@mclink.it.
The publication costs of this article were defrayed in part by page charge payment. Therefore, and solely to indicate this fact, this article is hereby marked ‘‘advertisement’’ in accordance with 18 U.S.C. section 1734. © 2005 by The American Society of Hematology
27 BLOOD, 1 JULY 2005
䡠
VOLUME 106, NUMBER 1assess the impact of lenograstim on the efficacy and toxicity of chemotherapy.
Patients, materials, and methods
Study design
The AML-13 was a randomized, open-label, active-controlled, phase-3 study carried out by the European Organisation for Research and Treatment of Cancer and Gruppo Italiano Malattie Ematologiche dell’Adulto (EORTC/ GIMEMA) leukemia groups in 53 European centers. The final protocol was approved by the EORTC Protocol Review Committee and by the Ethical Committee of each participating center. Each patient had to sign an informed consent before randomization.
The main objective of the study was to determine the efficacy and toxicity of adding G-CSF to induction chemotherapy. The primary end point was the overall survival (OS). Secondary end points included the complete remission (CR) rate after induction, disease-free survival (DFS), duration of remission, incidence of death in CR, event-free survival (EFS), the number of days to hematopoietic recovery, and the duration of hospitalization. Other objectives were (1) to assess the role of oral mini-ICE as consolidation relative to intravenous idarubicin-cytarabine-etoposide (mini-ICE); (2) to evaluate the feasibility of myeloablative chemotherapy with autologous peripheral blood stem cell (autoPBSC) support as second consolidation course in patients with a good performance status (PS) and age of 70 years or younger. A detailed analysis of postinduction treatment will be reported in full elsewhere.
Eligibility
Eligibility requirements were as follows (1) age 61 years and older, with an upper age limit of 80 years; (2) diagnosis of primary or secondary AML (sAML, including AML after myelodysplastic syndrome [MDS]) other than French-American-British (FAB) M3 and 30% or more blast cells in bone marrow smears; (3) no prior chemotherapy; (4) World Health Organization (WHO) PS of 2 or more; (5) normal cardiac left ventricular ejection fraction; (6) no evidence of severe concurrent cardiac, pulmonary, neuro-logic, or metabolic disease; and (7) adequate liver (serum bilirubin level⬍ 2 ⫻ upper normal limit) and renal (serum creatinine ⬍ 2 ⫻ upper normal limit) function tests. Exclusion criteria included blast crisis of chronic myeloid leukemia and AML supervening after other myeloproliferative diseases, other progressive malignant diseases, and uncontrolled infections.
Treatment
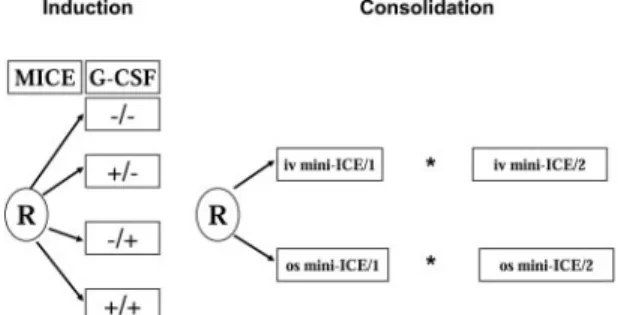
The overall study plan is represented in Figure 1. Enrolled patients were first randomized to receive G-CSF or no G-CSF in combination with induction chemotherapy according to a 2⫻ 2 factorial design (yes or no G-CSF during chemotherapy; yes or no G-CSF after chemotherapy). The cytokine was applied as follows: no G-CSF (⫺/⫺, group A); G-CSF during chemotherapy only (⫹/⫺, group B); G-CSF after chemotherapy only (⫺/⫹, group C); G-CSF during and following chemotherapy (⫹/⫹, group D). G-CSF (lenograstim, GRANOCYTE; Chugai-Aventis, Antony,
France) was given at the dose of 150g/m2daily by 30-minute intravenous infusion. The cytokine was discontinued earlier if (1) the number of circulating blast cells increased more than 2-fold during the chemotherapy course (in that case, G-CSF could be reinstituted during the induction period when the circulating blast cells had disappeared); (2) circulating blast cells persisted at a significant level (ⱖ 1 ⫻ 109/L) for more than 3 days after the chemotherapy course; (3) circulating blast cells (⬎ 1 ⫻ 109/L) reappeared after the chemotherapy course; and (4) the white blood cell (WBC) count after treatment reached 10⫻ 109/L. G-CSF was also to be discontinued in case of serious toxicity considered to be attributable to the growth factor. Induction chemotherapy consisted of the MICE regimen: mitoxantrone 7 mg/m2intravenously on days 1, 3, and 5; cytarabine 100 mg/m2 per day intravenous continuous infusion on days 1 to 7; and etoposide 100 mg/m2as a 1-hour intravenous infusion on days 1 to 3. Patients who achieved a partial remission (PR) received a second, identical induction course. Patients who achieved CR were randomized to receive 2 courses of consolidation therapy with either the intravenous or the oral mini-ICE regimen. Before the start of the trial, centers were asked to choose between the use of a second mini-ICE consolidation course in all patients who were in good clinical condition (WHO PS 0-1), or to administer myeloablative chemotherapy with autoPBSC support in the younger cohort (ⱕ 70 years of age). Centers that chose to use the autografting strategy had to register this intent by the official trial start date, and were strongly advised to obey the following directives: ages 61 to 70 years and WHO PS 0 to 1, eligible for high-dose chemotherapy with autoPBSC support; ages 71 to 80 years and WHO PS 0 to 1, second mini ICE consolidation course; WHO PS 2 or more after the first consolidation course, no further treatment. If the transplantation procedure was not feasible, the patient was to receive a second, identical mini-ICE course as assigned by the second randomiza-tion. The directives for centers not choosing to undertake autoPBSC transplantation were as follows: age 61 to 80 years and WHO PS 0 to 1, second mini-ICE consolidation course; WHO PS 2 or more after first consolidation course, no further treatment.
The prescribed dosage and scheduling of intravenous mini-ICE was as follows: idarubicin 8 mg/m2per day intravenously on days 1, 3, and 5; cytarabine 100 mg/m2per day on days 1 to 5, as an intravenous continuous infusion; etoposide 100 mg/m2on days 1 to 3, as a 1-hour intravenous infusion. The prescribed dose and scheduling of oral mini-ICE was as follows: idarubicin 20 mg/m2per day on days 1, 3, and 5 orally (after breakfast); cytarabine 50 mg/m2on days 1 to 5, as twice-daily subcutaneous injections (total daily dose 100 mg/m2); etoposide 100 mg/m2, twice daily (total daily dose 200 mg/m2), on days 1 to 3 orally (after breakfast and dinner). The use of G-CSF was contemplated neither during nor after the consolidation courses.
Criteria of response and evaluation of outcome
The Cancer and Leukemia Group B (CALGB) criteria for response to treatment and relapse were used.23A CR was defined as a morphologic normal marrow with less than 5% blasts, no evidence of extramedullary leukemia, and recovery of peripheral blood values to platelet counts of at least 100⫻ 109/L and polymorphonuclear leukocytes (PMNs) 1.5⫻ 109/L or more. A PR was defined by bone marrow smears containing between 5.1% and 25% blasts and less than 5% circulating blast cells. Failures of response were classified as treatment resistance when there was no reduction of the leukemic cell infiltration in the marrow or a reduction that would not meet the criteria of PR or CR. Hypoplasia followed by leukemic regrowth was also classified as resistant disease. Early death was defined as death before the completion of the first cycle of induction therapy, and hypoplastic death was defined as death after the completion of induction cycle (1 or 2) before hematologic recovery. Relapse was defined as recurrence of leukemia after initial CR as documented by cytologic or pathologic evaluation of bone marrow or blood smears, or pathologic diagnosis of extramedullary leukemia.
Morphologic classification followed the FAB group proposals.24,25 Standard cytogenetic techniques were used at diagnosis to karyotype the leukemia. Normal cytogenetics (NN), abnormal cytogenetics (AA), Figure 1. AML-13 schema. *After the first consolidation, patients 61 to 70 years old
who were WHO PS 0 or 1 were eligible to receive autoPBSC transplantation instead of a second consolidation.
28 AMADORI et al BLOOD, 1 JULY 2005
䡠
VOLUME 106, NUMBER 1For personal use only.
by on March 27, 2009.
www.bloodjournal.org
and a mosaicism of abnormal and normal karyotypes (AN) were recorded. The NN score was applied only when a minimum number of 20 mitoses had been evaluated; in case of an examination of fewer metaphases, the analysis was considered inadequate. Abnormalities 16q(22) and t(8;21) were considered favorable risk abnormalities, whether other abnormalities were present or not. NN karyotypes or those with only⫺Y were classified as intermediate risk. Deletions of the long arm of chromosomes 5 (5q⫺) and/or 7 (7q⫺), or of the entire chromosomes (⫺5, ⫺7), and complex abnormalities (⬎ 3 abnormalities) were considered to have an unfavorable prognosis. Patients with other abnormalities were pooled into a separate cytogenetic risk group (“other”).
The patients with unknown, not done, or unsuccessful cytogenetics were grouped together as unknown risk. Cytology, immunology, and cytogenetics were each reviewed by central reviewers.
Statistical analysis
Randomization was performed centrally (EORTC Data Center, Brussels) and patients were stratified according to center, age (61-70 vs 71-80 years), and type of AML (de novo AML vs sAML), using the minimization technique. OS was defined as the time interval from randomization until death, whatever the cause. DFS was defined as the time from CR until the first relapse or death, whatever the cause. EFS was defined as the time from the evaluation of the induction to the date of death or relapse, whichever occurred first. The duration of recovery was defined as the time from start of induction until PMN recovery or platelet recovery; patients without recovery were censored at day 90. Toxicity was evaluated according to the National Cancer Institute (NCI) Common Toxicity Criteria version 2.0. (National Cancer Institute, http://ctep.cancer.gov/reporting/CTC-3.html).
The sample size of the whole study was derived based on the primary end point of OS. According to the EORTC database for elderly AML, the median survival of patients treated with conventional chemotherapy is approximately 9 months and the 3-year survival rate is about 10%. In a 2-arm randomized study in order to detect an increase of 8% at 3 years, representing a reduction of the death rate of 26% (hazard ratio [HR]⫽ 0.74), a total of 500 patients are required to be randomized and 425 followed until death (log-rank 2-tailed test, alpha⫽ 0.05, beta ⫽ 0.15).26 This 2⫻ 2 factorial design, based on the assumption that no interaction exists between the impact of the 2 questions (yes or no G-CSF during MICE; yes or no G-CSF after MICE) on treatment outcome, did not require additional patients to be randomized. As the second randomized question (oral vs intravenous mini-ICE for consolidation) required a minimum of 330 patients, more than 720 patients were ultimately randomized in this study to determine the value of G-CSF during and/or after remission induction. This number of patients allowed the detection of differences in the CR rate (odds ratio [OR], 1.86) between the individual groups (A vs B, C vs D, A vs C, B vs D) with roughly 70% power (alpha⫽ 2.5%), and of the impact on CR rate (OR, 1.83) of G-CSF given during (group B⫹ D vs A ⫹ C) or after chemotherapy (group C⫹ D vs A ⫹ B) with a power of 90% (alpha ⫽ 5%). At the time of the final analysis, 613 deaths were reported, providing a power more than 90% for the detection of significant differences between the treatment groups (B⫹ D vs A ⫹ C and C ⫹ D vs A ⫹ B). For the time-to-events end points (OS, DFS, EFS), the actuarial curves were computed using the Kaplan-Meier technique and the standard errors (SEs)
Table 1. Patient characteristics by randomized treatment group
No. of patients (%) Group A, G-CSFⴚ/ⴚ Group B, G-CSFⴙ/ⴚ Group C, G-CSFⴚ/ⴙ Group D, G-CSFⴙ/ⴙ Total 182 180 180 180 Group EORTC 105 (57.7) 111 (61.7) 110 (61.1) 114 (63.3) GIMEMA 77 (42.3) 69 (38.3) 70 (38.9) 66 (36.7) Age, y 61 to 70 112 (61.5) 116 (64.4) 124 (68.9) 127 (70.6) 71 to 80 70 (38.5) 64 (35.6) 56 (31.1) 53 (29.4) Sex Male 97 (53.3) 91 (50.6) 86 (47.8) 111 (61.7) Female 82 (45.1) 86 (47.8) 89 (49.4) 67 (37.2) Missing 3 (1.6) 3 (1.7) 5 (2.8) 2 (1.1) Performance status* PS 0 59 (32.4) 52 (28.9) 51 (28.3) 54 (30.0) PS 1 81 (44.5) 91 (50.6) 87 (48.3) 83 (46.1) PS 2 38 (20.9) 34 (18.9) 38 (21.1) 37 (20.6) PS 3 to 4 1 (0.5) 0 (0.0) 0 (0.0) 3 (1.7) Missing/unknown 3 (1.6) 3 (1.7) 4 (2.3) 3 (1.7) Type of AML De novo 140 (76.9) 139 (77.2) 140 (77.8) 145 (80.6) Secondary 42 (23.1) 41 (22.8) 40 (22.2) 35 (19.4) FAB subtype M0 12 (6.6) 18 (10.0) 15 (8.3) 8 (4.4) M1 42 (23.1) 35 (19.4) 29 (16.1) 34 (18.9) M2 58 (31.9) 47 (26.1) 58 (32.2) 56 (31.1) M3 0 (0.0) 1 (0.6)† 0 (0.0) 0 (0.0) M4 29 (15.9) 25 (13.9) 29 (16.1) 40 (22.2) M5 22 (12.1) 32 (17.8) 29 (16.1) 32 (17.8) M6 6 (3.3) 10 (5.6) 4 (2.2) 4 (2.2) M7 1 (0.5) 2 (1.1) 2 (1.1) 1 (0.6) Missing/unknown 12 (6.5) 10 (5.6) 14 (7.8) 5 (2.8) WBC,ⴛ 109/L Less than 25 113 (62.1) 123 (68.3) 118 (65.6) 124 (68.9) 25 to 99.9 45 (24.7) 35 (19.4) 39 (21.7) 38 (21.1) ⱕ100 17 (9.3) 16 (8.9) 16 (8.9) 16 (8.9) Missing/unknown 7 (3.8) 6 (3.3) 7 (3.9) 2 (1.1) Cytogenetics Favorable 2 (1.1) 3 (1.7) 1 (0.6) 8 (4.4) Intermediate‡ 43 (23.6) 37 (20.6) 52 (28.9) 58 (32.2) Unfavorable§ 16 (8.8) 31 (17.2) 21 (11.7) 21 (11.7) Other 31 (17.0) 26 (14.4) 31 (17.2) 24 (13.3) Missing/unknown 90 (49.5) 83 (46.1) 75 (41.7) 69 (38.3) Results are presented as absolute numbers, with percentages shown in parentheses. ⫺/⫺ indicates not administered; ⫹/⫺, administered on days 1 to 7; ⫺/⫹, administered on days 8 to 28; and⫹/⫹, administered on days 1 to 28.
*WHO scale.
†This case was considered morphologically as FAB M3, but lacked both the t(15;17) translocation at conventional cytogenetics and the promyelocytic leukemia-retinoic acid receptor␣ (PML /RAR-␣) rearrangement at a molecular level.
‡NN,⫺Y.
§Presence of⫺5, ⫺7, 5q⫺, 7q⫺, complex abnormalities.
Table 2. Response to induction chemotherapy by treatment group
Group A, G-CSFⴚ/ⴚ Group B, G-CSFⴙ/ⴚ Group C, G-CSFⴚ/ⴙ Group D, G-CSFⴙ/ⴙ Total, Groups A-D Groups Aⴙ C, G-CSFⴚ/ⴚ Groups Bⴙ D, G-CSFⴙ/. Groups Aⴙ B, G-CSF./ⴚ Groups Cⴙ D, G-CSF./ⴙ No. patients 182 180 180 180 722 362 360 362 360
Overall complete response 89 (48.9) 94 (52.2) 87 (48.3) 116 (64.4) 386 (53.5) 176 (48.6) 210 (58.3) 183 (50.6) 203 (56.4) Partial response 1 (0.5) 9 (5.0) 6 (3.3) 7 (3.9) 23 (3.2) 7 (1.1) 16 (4.4) 10 (2.7) 13 (3.6) Resistant disease 64 (35.1) 49 (27.2) 46 (25.5) 33 (18.4) 192 (26.6) 110 (30.3) 82 (22.7) 113 (31.2) 79 (21.9)
Early death 4 (2.2) 2 (1.1) 5 (2.8) 6 (3.3) 17 (2.3) 9 (2.5) 8 (2.2) 6 (1.7) 11 (3.1)
Death in hypoplasia 21 (11.5) 18 (10.0) 27 (15.0) 15 (8.3) 81 (11.2) 48 (13.3) 33 (9.2) 39 (10.8) 42 (11.7) Unknown/missing data 3 (1.6) 8 (4.4) 9 (5.0) 3 (1.6) 23 (3.2) 12 (3.3) 11 (3.0) 11 (3.0) 12 (3.3)
Results are presented as absolute numbers, with the percentages in parentheses.⫺/⫺ indicates not administered; ⫹/⫺, administered on days 1 to 7; ⫺/⫹, administered on days 8 to 28;⫹/⫹, administered on days 1 to 28; ⫺/., not administered on days 1 to 7; ⫹/., administered on days 1 to 7; ./⫺, not administered on days 8 to 28; and ./⫹, administered on days 8 to 28.
of the estimates were obtained via the Greenwood formula.27The differ-ences between curves were tested for statistical significance using the stratified 2-tailed log-rank test.27The estimate of the cumulative incidence of relapse and of the incidence of death in CR and their corresponding SEs were obtained using competing risk methods.27The reflected method was used to determine the 95% confidence interval (CI) of the median survival time.28The Cox proportional hazards model has been used to obtain the estimate and the 95% CI of the HR of the instantaneous event rate in one treatment group versus the control group; this required the inclusion of 2 binary variables in the model, corresponding to the presence or absence of G-CSF during and after chemotherapy.27
For the treatment comparison in terms of CR rate, the Fisher exact test was used.29The usual logistic regression model has been used for the estimates of the OR of the CR rates between 2 treatment groups and the corresponding confidence interval (95% for each question, B⫹ D vs A ⫹ C and C⫹ D vs A ⫹ B; 97.5% for individual groups); this model was used to perform adjustments of the treatment comparisons for those factors that appeared to be of prognostic importance and/or in assessing the interaction between the 2 questions on the CR rates.29In the multivariate analysis, adjustments were made for cytogenetics (favorable, intermediate, unfavorable, other, not done/unknown), WBC (⬍ 5, 5-24.9, 25-99.9, ⱖ 100 ⫻ 109/L), age (61-65, 66-75,⬎ 75 years), and type of AML (de novo vs sAML).
All the efficacy analyses were performed according to the intent-to-treat principle. The durations of hospitalization, intravenous antibiotics, and intravenous antifungals were compared using the Wilcoxon test.29 The database was frozen on September 2003. SAS 8.2 software (SAS Institute, Cary, NC) has been used for the statistical analyses.
Results
Patient characteristics
Between December 1995 and February 2001, a total of 722 patients were randomized in the trial. Their median age was 68 years (range, 61-80 years); 53.3% were males. The median WBC count was 8.1⫻ 109/L (range, 0.2-360⫻ 109/L). The 4 treatment groups were
evenly matched with respect to various baseline characteristics, with the only exception of cytogenetics, which showed a slight preponderance of favorable and intermediate karyotypes in group D (Table 1). A total of 35 patients were considered ineligible: 5 in group A, 10 in group B, 10 in group C, and 10 in group D. Reasons for ineligibility included insufficient data in 13, concomitant malignant diseases in 11, prior chemotherapy in 4, inadequate performance status in 3, leukemia supervening after a myeloprolif-erative disorder in 2, and other causes in 2. Ineligible patients were also included in the intention-to-treat analysis.
Response to induction treatment
A complete response after 1 or 2 courses of induction chemo-therapy was achieved in 53.5% of patients (Table 2). In most cases
(95%), this response was obtained after the first induction cycle. As shown in Table 2, CR rates were as follows: 48.9% (group A), 52.2% (group B), 48.3% (group C), and 64.4% (group D). In Table 3, the estimated ORs for the pairwise comparisons (B vs A, D vs C, C vs A, and D vs B) along with the 97.5% CIs are given. Higher ORs were obtained for the comparison group D vs group C than for group B vs group A, and for group D vs group B than for group C vs group A, suggesting a possible interaction between the 2 questions (yes or no G-CSF during chemotherapy; yes or no G-CSF after chemotherapy). However, this interaction was found to be not significant (P⫽ .08). Multivariate analysis showed that the superi-ority of group D was in fact of lower magnitude for each comparison (group D vs group C: OR, 1.76 [P⫽ .01]; group D vs group B: OR, 1.44 [P⫽ .12]), and confirmed that the interaction between the 2 questions was not significant (P⫽ .23).
Analysis according to the 2⫻ 2 factorial design indicated that the CR rate was significantly higher in patients who received G-CSF during chemotherapy (58.3% for groups B⫹ D vs 48.6% for groups A⫹ C; Fisher exact test, P ⫽ .009; OR, 1.48; 95% CI, 1.10-1.99; Tables 2-3). This was related mostly to the lower percentage of resistant disease in patients receiving G-CSF with chemotherapy compared with controls (22.7% vs 30.3%, P⫽ .019, Table 2). Conversely, G-CSF administered after chemotherapy did not influence significantly the CR rate (56.4% for groups C⫹ D vs 50.6% for groups A⫹ B; Fisher exact test, P ⫽ .12; OR, 1.27; 95% CI, 0.94-1.70; Tables 2-3). Adjustment for factors that appeared to be of prognostic importance (secondary vs de novo AML, age, cytogenetics, WBC count) in a linear logistic model confirmed these findings (Table 3), although the adjusted estimates of the OR were slightly lower (1.43 and 1.15).
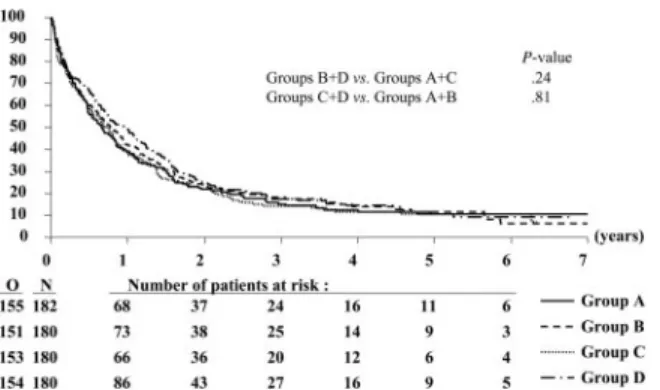
Figure 2. Duration of overall survival according to randomized treatment group. N indicates the number of patients in each group; O, the observed number of
deaths.
Table 3. Estimated ORs and the corresponding confidence intervals for CR rates
Analysis Group B vs group A (97.5% CI) Group D vs group C (97.5% CI) Groups Bⴙ D vs groups Aⴙ C (95% CI) Group C vs group A (97.5% CI) Group D vs group B (97.5% CI) Groups Cⴙ D vs groups Aⴙ B (95% CI) Uni/bivariate OR 1.14 (0.71-1.83) 1.94 (1.20-3.14) 1.48 (1.10-1.99) 0.98 (0.61-1.57) 1.66 (1.02-2.69) 1.27 (0.94-1.70) P .53 .003 .009 .92 .024 .12 Multivariate OR 1.11 (0.67-1.83) 1.76 (1.05-2.94) 1.43 (1.05-1.94) 0.98 (0.59-1.60) 1.44 (0.86-2.42) 1.15 (0.84-1.56) P .65 .01 .025 .90 .12 .38
Multivariate indicates adjustment for cytogenetics (unknown/not done, favorable, intermediate, unfavorable, other), WBC (⬍ 5, 5-24.9, 25-99.9, ⱖ 100 ⫻ 109/L), age (61-65, 66-75,⬎ 75 years), and disease (de novo AML, sAML).
30 AMADORI et al BLOOD, 1 JULY 2005
䡠
VOLUME 106, NUMBER 1For personal use only.
by on March 27, 2009.
www.bloodjournal.org
Consolidation treatment
A total of 346 patients were randomized to receive either the intravenous mini-ICE (n⫽ 172) or the oral mini-ICE (n ⫽ 174). Baseline character-istics were evenly matched between treatment groups (data not shown). Of the patients, 15 were not evaluable: 6 in the intravenous and 9 in the oral arm. Among 331 evaluable patients, 114 received one consolidation course only; 182, 2 consolidation courses; and 35, one consolidation course followed by myeloablative chemotherapy with autoPBSC sup-port. Withdrawals due to toxicity or treatment refusal were similar between the 2 groups. The instantaneous risk of death or relapse was 17% (95% CI, ⫺7%-48%) higher in the oral group than in the intravenous group. The corresponding HR in the intention-to-treat population was 1.18 (95% CI, 0.94-1.49).
Duration of survival
Patients have been followed for a median of 4.7 years after the first randomization. The median OS time for all patients was 9.1 months; in particular, the estimated median values (97.5% CI) were 7.9 months (5.8-10.4) in group A, 9.2 months (6.7-12.6) in group B, 8.4 months (6.1-10.9) in group C, and 11.5 months (8.3-14.9) in group D (Figure 2). The 3-year OS rates were similar in the different groups (Table 4), and the estimated HRs were close to 1 (Table 5).
A Cox model showed that the results remained practically unchanged after the adjustment for several presenting factors (disease, age, cytogenetics, WBC); for the comparison B⫹ D versus A⫹ C, the estimated HR was 0.91 (95% CI, 0.78-1.07;
P⫽ .26), and for the comparison C ⫹ D versus A ⫹ B, the
estimated HR was 1.03 (95% CI, 0.88-1.21; P⫽ .73). This is also true for the individual comparison D versus C (HR, 0.90; 97.5% CI,
0.69-1.17; P⫽ .37) and B versus A (HR, 0.91; 97.5% CI,
0.70-1.18; P⫽ .41).
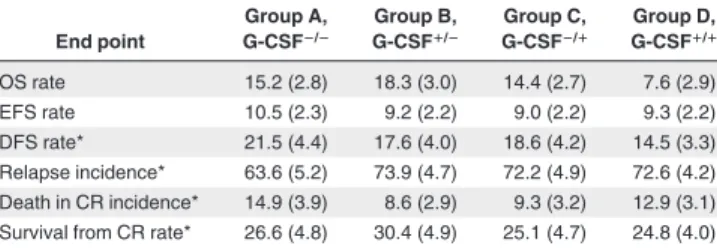
EFS and DFS
Likewise, the 3-year EFS and DFS rates were similar between the different treatment groups (Figures 3-4; Tables 4-5). Of the 386 complete responders, 44 died in first CR and 271 had recurrence of
leukemia at 3 years. The 3-year incidence of relapse was compa-rable among the treatment groups (Table 4).
G-CSF treatment, hematopoietic recovery, and hospitalization
G-CSF was administered for a median of 7 days (range, 2-18 days) in group B, 18 days (range, 1-36 days) in group C, and 24 days (range, 1-38 days) in group D. Treatment with G-CSF was interrupted or not administered in 174 (34.1%) of 510 patients. The primary reasons were granulocyte recovery (93 patients), and persistence or reappearance of circulating blast cells (19 patients). Other reasons, based on decisions by local physicians, were usually related to medical problems (eg, liver function abnormalities and allergy).
The median times to neutrophil recovery of 0.5⫻ 109/L in
groups C⫹ D versus groups A ⫹ B were 20 days (range, 1-83 days) and 25 days (range, 1-55 days), respectively (P⬍ .001). The median times of recovery to a platelet value of 20⫻ 109/L were 20
days (range, 1-67 days) in the C⫹ D groups and 21 days (range, 1-55 days) in the A⫹ B groups (P ⫽ .93). The mean (⫾ SD) number of days spent in the hospital during induction cycle 1 were 27.2 (⫾ 12.4) days in groups C ⫹ D and 29.7 (⫾ 14.2) days in groups A⫹ B (P ⬍ .001). Intravenous antibiotics were adminis-tered for significantly fewer days in patients who received G-CSF after chemotherapy: mean (⫾ SD) of 19.0 (⫾ 11.3) days in groups A⫹ B versus 16.2 (⫾ 10.2) days in groups C ⫹ D (P ⬍ .001). The duration of intravenous antifungal therapy in group C⫹ D was also significantly shorter than in groups A⫹ B: mean (⫾ SD) of 6.4 (⫾ 8.9) versus 8.5 (⫾ 10.5) days (P ⫽ .007).
Toxicity
The frequencies of various grade 3 or grade 4 adverse effects after induction cycles 1 and 2 were similar between the groups except for severe hypotension, which was more frequent in patients who received G-CSF after chemotherapy (4.3% for groups C⫹ D vs 1.2% for groups A⫹ B; Table 6).
The mean⫾ SD number of days of fever (axillary temperature, ⱖ 38.5°C) in association with induction chemotherapy was 8.8⫾ 6.7 days in groups A ⫹ B and 8.0 ⫾ 6.7 days in groups C⫹ D. The incidence of microbiologically documented infections (63.7% vs 60.4%) as well as of fatal infections (6.6% vs 6.7%) was also similar between groups A⫹ B and groups C ⫹ D. There were no differences regarding the frequency and types of both bacterial and fungal infections (data not shown).
Discussion
This randomized study considered the role of lenograstim as an adjunct to chemotherapy in older patients with AML. Based on in vitro data showing that exposure to myeloid growth factors increases the susceptibility of blast cells to cell cycle–specific Table 4. Estimates of the 3-year rates or incidences by treatment
group End point Group A, G-CSFⴚ/ⴚ Group B, G-CSFⴙ/ⴚ Group C, G-CSFⴚ/ⴙ Group D, G-CSFⴙ/ⴙ OS rate 15.2 (2.8) 18.3 (3.0) 14.4 (2.7) 7.6 (2.9) EFS rate 10.5 (2.3) 9.2 (2.2) 9.0 (2.2) 9.3 (2.2) DFS rate* 21.5 (4.4) 17.6 (4.0) 18.6 (4.2) 14.5 (3.3) Relapse incidence* 63.6 (5.2) 73.9 (4.7) 72.2 (4.9) 72.6 (4.2) Death in CR incidence* 14.9 (3.9) 8.6 (2.9) 9.3 (3.2) 12.9 (3.1) Survival from CR rate* 26.6 (4.8) 30.4 (4.9) 25.1 (4.7) 24.8 (4.0)
Numbers in parentheses are the standard errors.
*Only patients who achieved a complete remission were considered (the number of patients in each group is given in Table 2).
Table 5. Estimated HRs and the corresponding confidence intervals for the main end points
End point Group B vs group A (97.5% CI) Group D vs group C (97.5% CI) Groups Bⴙ D vs groups Aⴙ C (95% CI) Group C vs group A (97.5% CI) Group D vs group B (97.5% CI) Groups Cⴙ D vs groups Aⴙ B (95% CI) OS 0.95 (0.74-1.23) 0.87 (0.67-1.12) 0.91 (0.78-1.02) 1.03 (0.79-1.32) 0.94 (0.72-1.21) 0.98 (0.84-1.15) EFS 0.98 (0.76-1.25) 0.86 (0.67-1.10) 0.92 (0.79-1.07) 1.00 (0.78-1.28) 0.88 (0.69-1.13) 0.94 (0.81-1.09) DFS from CR 1.03 (0.72-1.48) 1.05 (0.75-1.48) 1.04 (0.84-1.30) 0.99 (0.68-1.44) 1.01 (0.72-1.41) 1.00 (0.81-1.24) Survival from CR 1.00 (0.68-1.46) 1.01 (0.71-1.44) 1.00 (0.80-1.26) 1.08 (0.73-1.58) 1.11 (0.78-1.57) 1.09 (0.87-1.37)
agents such as cytarabine,30-34 it was hypothesized that priming
with G-CSF might improve the outcome of chemotherapy for AML. It also was assumed that G-CSF might possibly reduce the duration of neutropenia after chemotherapy, thereby reducing morbidity and mortality from bacterial and fungal infections.
Our data indicate that G-CSF administered concomitantly with standard induction chemotherapy results in a higher CR rate than chemotherapy alone in patients with AML who are 61 years and older, but has no significant impact on OS. In particular, the CR rate was 52.2% in patients randomized to receive G-CSF during chemotherapy only (group B), while it reached 64.4% in those assigned to receive the cytokine both during and after chemo-therapy (group D), suggesting that the magnitude of the effect of G-CSF on the rate of response might be further enhanced by extending its administration after chemotherapy. This latter result, however, should be interpreted with caution for a number of reasons: (1) multivariate analysis showed no significant interaction between the use of concurrent and postchemotherapy G-CSF; (2) the higher, although not significantly, proportion of patients with favorable/intermediate cytogenetics may at least in part have contributed to the greater response rate in group D; and (3) even in this group of patients with the highest CR rate, there was no significant improvement of survival parameters. A plausible expla-nation for these findings is that the quality of induced complete responses in terms of minimal residual disease could be lower in patients treated with G-CSF, in whom the residual blast count may be confounded by granulocytic hyperplasia.35 Nevertheless, the
poor outcome may also result from inadequate postremission therapy. In fact, AML in older patients often presents with high-risk features (poor cytogenetics, expression of multidrug resistance
phenotype, etc) that would require very aggressive strategies generally not applicable to these individuals.
Previous controlled trials have failed to show a beneficial effect on the response rate of priming with either G-CSF or GM-CSF in patients with AML.13,14,16-18,20-22,36,37 However, a careful analysis
reveals a great variability in study conditions, with very few identical study designs (Table 7). When analyzing different clinical trials addressing similar questions, it is particularly important to compare patients’ age, disease state (whether de novo AML or sAML), and the induction regimen used. It is theoretically possible that the more intensive induction regimens, with a more profound suppression of the bone marrow, may have a greater potential for a beneficial effect from cytokine priming. In this regard, the 3-drug regimen (mitoxantrone, cytarabine, etoposide) that we used for induction treatment may have some bearing on the results, because other trials have predominantly used 2-drug regimens (an anthracy-cline or mitoxantrone plus cytarabine). Only a recent Swedish study used an induction chemotherapy with the same 3 agents used in our trial, although delivered with a different schedule.22In that
study, the administration of GM-CSF prior to and in combination with induction treatment did not improve either the response rate or OS. However, it should be underlined that the response rates in both arms were very high (64% in patients without GM-CSF, and 65% in patients who received GM-CSF), despite the fact that the median age was considerably higher (77 years) than the average of the other studies. Selection biases (exclusion of patients with leukocyte counts more than 50⫻ 109/L, and with sAML) can
account for these findings.
Timing of growth factor administration, used as priming, may represent another critical issue. However, the discrepant results of published studies do not help to clarify whether the priming cytokine should be administered prior to, or concomi-tantly with, the administration of chemotherapy. In fact, it has been suggested that some detrimental effect might occur following blast cell stimulation without simultaneous cytotoxic therapy.38 Another variable to be considered is the use of
different study products, since there may be pharmacologic differences even among different cellular preparations of the same cytokine. The statistical end points used in the design of many of these studies also need to be very carefully evaluated. Some of the studies were part of larger studies designed and sized to evaluate differences in hematopoietic recovery, for example, but not to detect differences in complete response rate,
Figure 3. Event-free survival according to randomized treatment group. N
indicates the number of patients in each group; O, the observed number of events (lack of CR after induction, relapse, or death in CR).
Figure 4. Disease-free survival according to randomized treatment group. N
indicates the number of patients in each group; O, the observed number of events (relapse or death in CR).
Table 6. Incidence of WHO grade-3 to grade-4 side effects during induction therapy
Group A, G-CSFⴚ/ⴚ Group B, G-CSFⴙ/ⴚ Group C, G-CSFⴚ/ⴙ Group D, G-CSFⴙ/ⴙ N 178 172 173 177 Hemorrhage 9 (5.0) 15 (8.8) 13 (7.5) 7 (4.0) Hepatic 14 (7.9) 13 (7.5) 21 (12.1) 22 (12.4) Cardiovascular* 23 (12.9) 11 (6.4) 15 (8.7) 20 (11.3) Hypotension 2 (1.1) 2 (1.2) 8 (4.6) 7 (4.0) Diarrhea 10 (5.6) 3 (1.8) 8 (4.6) 7 (4.0) Nausea 38 (21.4) 40 (23.3) 30 (17.4) 28 (15.8) Rigors/chills 0 (0) 0 (0) 2 (1.2) 1 (0.6) Bone pain 1 (0.6) 0 (0) 1 (0.6) 2 (1.1) Rash/itch 2 (1.1) 4 (2.3) 6 (3.5) 7 (4.0) Infection 48 (27.0) 57 (23.1) 54 (31.2) 45 (25.4) Results are presented as absolute numbers, with the percentages in parenthe-ses.
–/–, indicates not administered on days 1 to 7;⫹/–, administered on days 1 to 7; –/⫹, not administered on days 8 to 28; and ⫹/⫹, administered on days 8 to 28.
*Includes nonspecific cardiac events and dysrhythmias.
32 AMADORI et al BLOOD, 1 JULY 2005
䡠
VOLUME 106, NUMBER 1For personal use only.
by on March 27, 2009.
www.bloodjournal.org
DFS, or survival. In fact, a lack of the statistically significant improvement in response rate does not necessarily indicate a lack of efficacy, but rather the inability to make any substantive conclusions because of the intrinsic study design.
Contrary to the findings of Lo¨wenberg et al,20 showing that
G-CSF given concurrently with chemotherapy produced an improve-ment of DFS in AML patients 18 to 60 years of age who were considered to be in a “standard risk” prognostic category, the results of our study indicated that no particular subgroup identified by cytogenetics benefited from G-CSF priming. Nevertheless, we have to acknowledge that our study was underpowered in this respect, and, in addition, 44% of the patients from our series did not have evaluable cytogenetics. It is noteworthy that the glycosylated G-CSF used in the Hemato-Oncologie voor Voolwassenen Nederland (HO-VON) trial had the same cellular origin and was manufactured by the same company as in our study. Thus, the differences in the results are not attributable to different growth factor properties, but rather to differences in the patient population under study (older age in our series) and in the intensity of treatment.
Preliminary data of a German multicenter trial in AML patients 16 to 83 years of age are consistent with our results, showing no significant difference in OS or DFS between patients assigned to G-CSF and those assigned to no G-CSF, irrespective of the cytogenetic category.39
In our study, the use of G-CSF after chemotherapy resulted in a shorter duration of neutropenia by 5 days, but it did not prevent the infectious complications during the hypoplastic phase to any significant extent. As a result, morbidity or mortality was not reduced. These results are largely in line with other trials conducted to date.6-10,13,14,17,18,22The shortened period
of neutropenia was probably the reason for less antibiotic and antifungal use as well as shorter hospitalization in this group of patients. These positive clinical findings definitely encourage the use of G-CSF as an adjunct to standard supportive care in AML. We are aware that economic considerations are important when evaluating a supportive care treatment. In this regard, 2 major health-economic studies of myeloid growth factors as adjunct therapy in older patients with AML have been conducted, and both demonstrated no significant increment in costs of care associated with the use of G-CSF or GM-CSF.40,41Besides, it has been argued that
the short-term outcomes of these economic studies may inappropri-ately penalize the growth factors, when strict economic analyses are carried out.42For example, if G-CSF were to prevent delays
in therapy, health care costs might be less and clinical outcomes might ultimately be improved.
The use of priming with growth factors has aroused concern that the stimulation of residual normal precursors could increase their sensitivity to chemotherapy, with consequent delays in the return of blood counts to normal. This has not occurred in our trial, which opens the question of the nature of the protective mechanisms that allow normal stem cells to regenerate rapidly when the leukemia clone is suppressed.
In conclusion, the results of our trial suggest that neither G-CSF priming nor G-CSF administration after induction chemotherapy has any impact on the long-term outcome of AML in older patients. At the present time, G-CSF should be offered to these patients only as a supportive care measure.
Acknowledgments
We acknowledge St Jude Children’s Research Hospital for provid-ing an SAS macro allowprovid-ing the computation of the cumulative incidences of relapse and of death in CR. We thank the cytogeneti-cists of the different institutions, in particular A. Bernheim (Villejuif), M. Mancini (Rome), D. Olde-Weghuis (Nijmegen), and A. Hagemeijer (Leuven), for the review of karyotypes.
The contents of this paper are solely the responsibility of the authors and do not represent the official views of the National Cancer Institute (Bethesda, MD).
Appendix
The following members of the EORTC or GIMEMA Leukemia Groups participated in this study: Dr Sinnige (Den Bosch), Dr Vreugdenhil (Veldhoven), Dr Bron (Brussels), Dr De Bock (Antwerpen), Dr Berneman (Antwerpen), Dr Vermeulen (Verviers), Dr Feremans (Brussels), Dr Fillet (Lie`ge), Drs Schneider and Thyss (Nice), Dr Bourhis (Villejuif), Drs Archimbaud, Chelghoum, Fie`re, and Thomas (Lyon), Drs Vekhouff and Marie (Paris), Drs Delarue, Lefre`re, and Varet (Paris), Dr Dreyfus (Paris), Dr Baumelou (Suresnes), Drs de Witte and Muus (Nijmegen), Dr Willemze (Leiden), Dr Jehn (Munich), Dr Denzlinger (Tubingen), Dr Stauder (Innsbruck), Dr Labar (Zagreb), Dr Jaksic (Zagreb), Dr Indrak (Olomouc), Dr Ribeiro (Porto), Dr Nobile (Reggio Calabria), Drs Amadori, Stasi, and
Table 7. Randomized studies of growth factors as priming therapy for acute myeloid leukemia
Reference
No. of patients
Median
age, y AML state
Growth factor/control
Day of first administration*
Growth factor vs control group
% CR % overall survival
Ohno et al13 58 43-47 Relapsed/refractory Filgrastim/placebo ⫺2 50/37 Same
Estey et al14 197† 58-61 De novo/secondary Filgrastim/control ⫺1 63/54 Same
Heil et al15 80 55 De novo Molgrastim/placebo ⫺2 81/79 45/49 (at 43 mo)
Zittoun et al16 51 54 Previously untreated Molgrastim/control ⫺1 72/77 Same
Lo¨wenberg et al17 318 68 De novo/secondary Molgrastim/control ⫺1 56/55 22/22 (at 24 mo)
Witz et al18 240 66 De novo Molgrastim/placebo ⫹1 62/61 44/19 (at 24 mo)‡
Thomas et al19 192 46-47 Relapsed/refractory Molgrastim/placebo ⫺2 65/59 Same
Lo¨wenberg et al20 640 44 De novo/secondary Lenograstim/control ⫺1 79/83 40/35 (at 48 mo)§
Rowe et al21 245 67-69 Previously untreated Sargramostim/placebo ⫺2 38/40 Same
Lo¨fgren et al22 110 77 De novo Sargramostim/control ⫺1 65/64 8/10㛳 (at 72 mo)
Filgrastim indicates Escherichia coli–derived recombinant human granulocyte colony-stimulating factor; Lenograstim, Chinese hamster ovary–derived recombinant human G-CSF; Molgrastim, Escherichia coli–derived recombinant human GM-CSF; and Sargramostim, yeast-derived recombinant human granulocyte-macrophage colony-stimulating factor.
*Day of first administration of the growth factor in relation to the start of chemotherapy. †Including 74 patients with myelodysplastic syndrome.
‡P⫽ .003.
§P⫽ .16; DFS 45/33, P ⫽ .02. 㛳P ⫽ .07.
Venditti (Rome), Dr Citarella (Palermo), Dr Rizzoli (Parma), Dr Gabbas (Nuoro), Dr Leoni (Ancona), Drs Mandelli, Petti, and Vignetti (Rome), Drs Leone and Pagano (Rome), Dr Defazio (Lodi), Dr Greco (San Giovanni Rotondo), Dr Lucarelli (Pesaro), Dr Mirto (Palermo), Dr Rotoli (Napoli), Dr Broccia (Cagliari), Dr Fioritoni (Pescara), Dr Mariani (Palermo), Dr
Ricciuti (Potenza), Dr Ferrara (Napoli), Dr Torelli (Modena), Dr Longinotti (Sassari), Dr Morandi (Cremona), Dr Mazza (Taranto), Dr Levis (Alessan-dria), Drs Coser, Casini, and Cassibba (Bolzano), Dr Quarta (Brindisi), Dr Montanaro (Montefiascone), and Dr Boccadoro (Torino).
Dr Archimbaud is deceased.
References
1. Stone RM. The difficult problem of acute myeloid leukemia in the older adult. CA Cancer J Clin. 2002;52:363-371.
2. Stasi R, Venditti A, Del Poeta G, et al. Intensive treatment of patients age 60 years and older with de novo acute myeloid leukemia: analysis of prognostic factors. Cancer. 1996;77:2476-2488. 3. Leith CP, Kopecky KJ, Godwin J, et al. Acute
my-eloid leukemia in the elderly: assessment of multi-drug resistance (MDR1) and cytogenetics distin-guishes biologic subgroups with remarkably distinct responses to standard chemotherapy: A Southwest Oncology Group study. Blood. 1997; 89:3323-3329.
4. Grimwade D, Walker H, Harrison G, et al. The predictive value of hierarchical cytogenetic classi-fication in older adults with acute myeloid leuke-mia (AML): analysis of 1065 patients entered into the United Kingdom Medical Research Council AML11 trial. Blood. 2001;98:1312-1320. 5. Hiddemann W, Kern W, Schoch C, et al.
Manage-ment of acute myeloid leukemia in elderly pa-tients. J Clin Oncol. 1999;17:3569-3576. 6. Stone RM, Berg DT, George SL, et al.
Granulocyte-macrophage colony-stimulating factor after initial chemotherapy for elderly patients with primary acute myelogenous leukemia: Cancer and Leukemia Group B. N Engl J Med. 1995;332:1671-1677. 7. Dombret H, Chastang C, Fenaux P, et al. A
con-trolled study of recombinant human granulocyte colony-stimulating factor in elderly patients after treatment for acute myelogenous leukemia: AML Cooperative Study Group. N Engl J Med. 1995; 332:1678-1683.
8. Rowe JM, Andersen JW, Mazza JJ, et al. A ran-domized placebo-controlled phase III study of granulocyte-macrophage colony-stimulating fac-tor in adult patients (⬎ 55 to 70 years of age) with acute myelogenous leukemia: a study of the Eastern Cooperative Oncology Group (E1490). Blood. 1995;86:457-462.
9. Heil G, Hoelzer D, Sanz MA, et al. A randomized, double-blind, placebo-controlled, phase III study of filgrastim in remission induction and consolida-tion therapy for adults with de novo acute myeloid leukemia: The International Acute Myeloid Leuke-mia Study Group. Blood. 1997;90:4710-4718. 10. Godwin JE, Kopecky KJ, Head DR, et al. A
double-blind placebo-controlled trial of granulo-cyte colony-stimulating factor in elderly patients with previously untreated acute myeloid leuke-mia: a Southwest Oncology Group study (9031). Blood. 1998;91:3607-3615.
11. Goldstone AH, Burnett AK, Wheatley K, Smith AG, Hutchinson RM, Clark RE. Attempts to im-prove treatment outcomes in acute myeloid leu-kemia (AML) in older patients: the results of the United Kingdom Medical Research Council AML11 trial. Blood. 2001;98:1302-1311. 12. Schiffer CA. Hematopoietic growth factors and
the future of therapeutic research on acute my-eloid leukemia. N Engl J Med. 2003;349:727-729. 13. Ohno R, Naoe T, Kanamaru A, et al. A
double-blind controlled study of granulocyte colony-stimulating factor started two days before induc-tion chemotherapy in refractory acute myeloid leukemia: Kohseisho Leukemia Study Group. Blood. 1994;83:2086-2092.
14. Estey E, Thall P, Andreeff M, et al. Use of granu-locyte colony-stimulating factor before, during, and after fludarabine plus cytarabine induction therapy of newly diagnosed acute myelogenous leukemia or myelodysplastic syndromes:
com-parison with fludarabine plus cytarabine without granulocyte colony-stimulating factor. J Clin On-col. 1994;12:671-678.
15. Heil G, Chadid L, Hoelzer D, et al. GM-CSF in a double-blind randomized, placebo controlled trial in therapy of adult patients with de novo acute myeloid leukemia (AML). Leukemia. 1995;9:3-9. 16. Zittoun R, Suciu S, Mandelli F, et al.
Granulocyte-macrophage colony-stimulating factor associated with induction treatment of acute myelogenous leukemia: a randomized trial by the European Organization for Research and Treatment of Can-cer Leukemia Cooperative Group. J Clin Oncol. 1996;14:2150-2159.
17. Lowenberg B, Suciu S, Archimbaud E, et al. Use of recombinant GM-CSF during and after remission induction chemotherapy in patients aged 61 years and older with acute myeloid leukemia: final report of AML-11, a phase III randomized study of the Leuke-mia Cooperative Group of European Organisation for the Research and Treatment of Cancer and the Dutch Belgian Hemato-Oncology Cooperative Group. Blood. 1997;90:2952-2961.
18. Witz F, Sadoun A, Perrin MC, et al. A placebo-controlled study of recombinant human granulo-cyte-macrophage colony-stimulating factor ad-ministered during and after induction treatment for de novo acute myelogenous leukemia in el-derly patients: Groupe Ouest Est Leucemies Aigues Myeloblastiques (GOELAM). Blood. 1998; 91:2722-2730.
19. Thomas X, Fenaux P, Dombret H, et al. Granulo-cyte-macrophage colony-stimulating factor (GM-CSF) to increase efficacy of intensive sequential chemotherapy with etoposide, mitoxantrone and cytarabine (EMA) in previously treated acute my-eloid leukemia: a multicenter randomized pla-cebo-controlled trial (EMA91 Trial). Leukemia. 1999;13:1214-1220.
20. Lowenberg B, van Putten W, Theobald M, et al. Effect of priming with granulocyte colony-stimulating factor on the outcome of chemotherapy for acute myeloid leukemia. N Engl J Med. 2003;349:743-752. 21. Rowe JM, Neuberg D, Friedenberg W, et al. A
phase 3 study of three induction regimens and of priming with GM-CSF in older adults with acute myeloid leukemia: a trial by the Eastern Coopera-tive Oncology Group. Blood. 2004;103:479-485. 22. Lo¨fgren C, Paul C, Astrom M, et al.
Granulocyte-macrophage colony-stimulating factor to increase efficacy of mitoxantrone, etoposide and cytarabine in previously untreated elderly patients with acute my-eloid leukaemia: a Swedish multicentre randomized trial. Br J Haematol. 2004;124:474-480. 23. Yates J, Glidewell O, Wiernik P, et al. Cytosine
arabinoside with daunorubicin or adriamycin for therapy of acute myelocytic leukemia: a CALGB study. Blood. 1982;60:454-462.
24. Bennett JM, Catovsky D, Daniel MT, et al. Pro-posed revised criteria for the classification of acute myeloid leukemia: a report of the French-American-British Cooperative Group. Ann Intern Med. 1985;103:620-625.
25. Bennett JM, Catovsky D, Daniel MT, et al. Pro-posal for the recognition of minimally differenti-ated acute myeloid leukaemia (AML-MO). Br J Haematol. 1991;78:325-329.
26. Freedman LS. Tables of the number of patients required in clinical trials using the logrank test. Stat Med. 1982;1:121-129.
27. Kalbfleisch JD, Prentice RL. The statistical analy-sis of failure time data. 2nd ed. Hoboken, NJ: John Wiley & Sons; 2002.
28. Slud EV, Byar DP, Green SB. A comparison of reflected vs test-based confidence intervals for the median survival time, based on censored data. Biometrics. 1984;40:587-600.
29. Agresti A. An Introduction to Categorical Data Analy-sis. New York, NY: John Wiley & Sons; 1996. 30. Miyauchi J, Kelleher CA, Wang C, Minkin S,
Mc-Culloch EA. Growth factors influence the sensitiv-ity of leukemic stem cells to cytosine arabinoside in culture. Blood. 1989;73:1272-1278. 31. Bhalla K, Holladay C, Arlin Z, Grant S, Ibrado AM,
Jasiok M. Treatment with interleukin-3 plus granulocyte-macrophage colony-stimulating fac-tors improves the selectivity of Ara-C in vitro against acute myeloid leukemia blasts. Blood. 1991;78:2674-2679.
32. te Boekhorst PA, Lowenberg B, Vlastuin M, Son-neveld P. Enhanced chemosensitivity of clono-genic blasts from patients with acute myeloid leu-kemia by G-CSF, IL-3 or GM-CSF stimulation. Leukemia. 1993;7:1191-1198.
33. Reuter C, Auf der Landwehr U, Schleyer E, et al. Modulation of intracellular metabolism of cytosine arabinoside in acute myeloid leukemia by granu-locyte-macrophage colony-stimulating factor. Leukemia. 1994;8:217-225.
34. te Boekhorst PA, Lowenberg B, Sonneveld P. He-matopoietic growth factor stimulation and cytara-bine cytotoxicity in vitro: effects in untreated and relapsed or primary refractory acute myeloid leu-kemia cells. Leuleu-kemia. 1994;8:1480-1486. 35. Munck JN, Deacaudin D, Koscielny S.
Recombi-nant granulocyte colony-stimulating factor in acute myelogenous leukemia. N Engl J Med. 1995;333:1155-1156.
36. Estey E, Thall PF, Kantarjian H, et al. Treatment of newly diagnosed acute myelogenous leukemia with granulocyte-macrophage colony-stimulating factor (GM-CSF) before and during continuous-infusion high-dose ara-C⫹ daunorubicin: com-parison to patients treated without GM-CSF. Blood. 1992;79:2246-2255.
37. Peterson B, George K, Bhalla K, Schiffer C. A phase III trial with or without GM-CSF adminis-tered before and during high dose cytarabine in patients with relapsed or refractory acute myelog-enous leukemia (CALGB 9021) [abstract]. Proc Am Soc Clin Oncol. 1996;15:3.
38. Rowe JM. Concurrent use of growth factors and chemotherapy in acute leukemia. Curr Opin He-matol. 2000;7:197-202.
39. Buchner T, Berdel WE, Hiddemann W. Priming with granulocyte colony-stimulating factor— relation to high-dose cytarabine in acute myeloid leukemia. N Engl J Med. 2004;350:2215-2216. 40. Bennett CL, Stinson TJ, Tallman MS, et al.
Eco-nomic analysis of a randomized placebo-controlled phase III study of granulocyte macro-phage colony stimulating factor in adult patients (⬎ 55 to 70 years of age) with acute myelog-enous leukemia: Eastern Cooperative Oncology Group (E1490). Ann Oncol. 1999;10:177-182. 41. Bennett CL, Hynes D, Godwin J, Stinson TJ,
Golub RM, Appelbaum FR. Economic analysis of granulocyte colony stimulating factor as adjunct therapy for older patients with acute myelog-enous leukemia (AML): estimates from a South-west Oncology Group clinical trial. Cancer Invest. 2001;19:603-610.
42. Bennett CL, Schumock GT. Cost analyses of adjunct colony stimulating factors for older patients with acute myeloid leukaemia: can they improve clinical decision making? Drugs Aging. 2003;20:479-483.
34 AMADORI et al BLOOD, 1 JULY 2005
䡠
VOLUME 106, NUMBER 1For personal use only.
by on March 27, 2009.
www.bloodjournal.org