A VALIDATION PROCESS FOR CFD USE IN BUILDING PHYSICS – STUDY
OF THE DIFFERENT SCALES
Mathieu Barbason1, Sigrid Reiter1 1
University of Liège, Liège, Belgium.
Abstract
Due to growing environmental concerns, Computational Fluid Dynamics (CFD) is more and more used in building physics. Until today, the research community has validated separately several cases but there is no global validation process for this method. The aim of this paper is to provide a way for new users to develop and improve their CFD skills. This paper deals with the different geometry scales involved in building physics. Experimental results are available and will assess the ability of CFD to predict accurately the thermal behaviour of buildings. Thanks to this validation process, building engineers and architects can improve their simulations results and their understanding of the physical phenomena in building physics.
Keywords: Computational Fluid Dynamics, validation, building physics simulations
1 Introduction
As a large part of energy consumptions is due to buildings and because environmental concerns grow, scientists are urged to develop new tools for architects and building engineers. Thanks to growing computer capacities, new solutions are now available. Computational Fluid Dynamics (CFD) is getting mature for industrial purposes after decades of intensive research (Chen et al., 1992). As CFD permits to get a very precise description of airflows in buildings, it will permit to improve the thermal behaviour of buildings and to reduce the energy needs.
Until now, CFD has been validated separately on several cases. But, there is no holistic method to validate the use of CFD in building physics. However, lots of physical phenomena (natural or mechanical convection, radiation, etc.) are involved and different geometry scales (from a single room to a complete building) occur. For these reasons, a validation process was created to guide building engineers in their learning of this tool. This validation process is established in the frame of an EDRF project called SIMBA.
2 METHOD
This validation process is based on experimental results of some typical applications in building physics. This method will assess for new users the ability of CFD to predict correctly airflows in buildings. Two main axes were identified to create a complete validation process of CFD: 1) physical phenomena encountered are numerous and require different approaches and, 2) building physics applications involve various space scales.
In the first theme, four different cases were identified to cover most classical engineering cases. The first one is simply a mechanical ventilation case. The second one permits to get used to free float cases (thermal loads create and keep natural convection going) while the third one deals with radiant panel. Eventually, the fourth one approaches natural ventilation. In the second theme, once again, it has been separated in four steps. The first scale is a single-room. The second one is a group of partitioned rooms. The third one is a complete building with open floors and a central atrium. The fourth one is an atrium exposed to solar radiation.
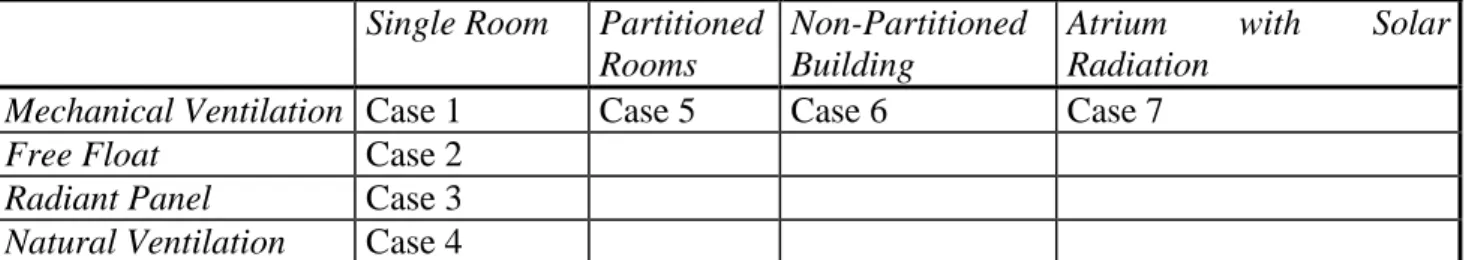
The two themes define sixteen different cases in a double entry array (Table 1). As a validation process based on 16 different cases would be too long, it is proposed to resolve one complete column and one complete line of this validation process diagram. After having completed this validation process on 7 cases, the operator will have a good knowledge of building physics simulations.
Table 1: Validation process diagram
Single Room Partitioned Rooms
Non-Partitioned Building
Atrium with Solar Radiation
Mechanical Ventilation Case 1 Case 5 Case 6 Case 7
Free Float Case 2
Radiant Panel Case 3 Natural Ventilation Case 4
In this paper, only the first line will be investigated. Indeed, the first column was the subject of a previous paper (Barbason et al., 2010). It has already been proven that CFD is able to describe the different identified physical phenomena.
This paper is intended to provide a holistic approach for non-expert users to validate their CFD results. However, Chen and Srebric (2001) have elaborated a procedure to compare experimental and numerical data to validate the use of a CFD code in a specific case. The results of this paper were collected in accordance with this procedure. To illustrate it, the whole process is described for one case (the “partitioned rooms” case – Case 5) but a brief description and CFD results of the three other cases (Case 1, Case 6 and Case 7) are also described. Note that the “single room” is fully described in Barbason et al. (2010) and the other cases are available in Barbason (2010).
Chen and Srebric (2001) described a three step validation (verification, validation and results reporting). The first step aims to verify that the code is able to model the physical phenomena involved in the studied case, the second step validate the code for mixed case and the ability of the user. The third step aims to report the results in accordance with a precise way. As the first step is mainly intended for code developers, this article only considers the two last steps.
3 CASES DESCRIPTION This section will provide a brief description of the four studied cases. 3.1 Single Room Case
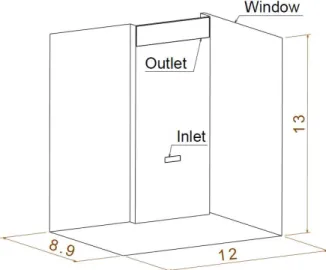
The first studied case comes from a study of Kuznik et al. (2007). The room is equipped with a mechanical ventilation device (see Figure 1). There is no obstacle in the room. Consequently, the convection cell is created exclusively by the mechanical ventilation and fills the entire room. This very simple case permits to the new user to get used to CFD modelling. The volume of the studied room is 24m³.
3.2 Partitioned Rooms Case
This case was first studied by Wang (2007). An experimental chamber is partitioned in four rooms. These are linked by small openings (see Figure 2). There are two rooms in parallel which define two pathways for the air between the inlets and the outlet. In one room, a heated box is placed to enhance the convection. This device increases the air mass rate in this pathway in comparison with the other one. Consequently, the ratio between airflow rates is a very interesting data to survey. Numerical results need to predict this value correctly. The original thesis gives also
access to the temperature measurements in the heated room. It should be noticed that the volume of the experimental chamber is 79 m³.
3.3 Non-Partitioned Building Case The original study was realized by Walker (2005). This case is very interesting because it is based on a real building. For experimental reasons, results were obtained with a 1/12 model. Indeed, it permits to overcome external conditions description and to control more precisely the experiment. A scaling factor (based on a dimensional study) is applied to take into account the scaling aspects.
The model is composed of a central atrium and four storeys (two on each sides of the atrium). Each storey is heated to simulate the normal occupancy of the building. Wind is simulated thanks to a mechanical device through the windows of the right part of the model (see Figure 3). Windows of the left part of the model play the role of the outlets. The volume of the real building is approximately 6500m³ which is already a big building.
3.4 Atrium with Solar Radiation Case
This case comes from the thesis of Basarir (2009). The geometry is basic: it is only an atrium. One side of it is exposed to solar radiation which is very difficult to predict accurately. The atrium is equipped with a mechanical ventilation (see Figure 4). This case is also based on a real building and measurements were done on-site. Simplifications were made for the development of the numerical model. It will be interesting to see the impact of these simplifications on the accuracy of the results. Precise data for the external conditions are available in the original thesis. The volume of the atrium is 1350m³.
With these four cases, the operator will be aware of CFD capacities and resources needs. Indeed, these four cases are various and implies different approaches in function of the size of the case.
Figure 2. Partitioned Rooms Case (Wang, 2007)
Figure 3. Non-Partitioned Building Case (Walker, 2005)
Figure 4. Atrium with Solar Radiation Case (Basarir, 2009)
4 RESULTS
In this section, Fluent (ANSYS Inc., 2009), widely used software in CFD, is submitted to our validation process.
4.1 Single Room Case
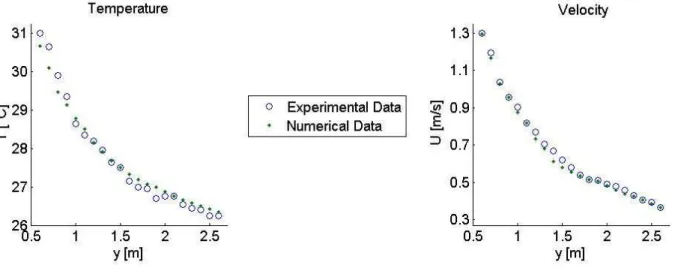
The first step to report CFD results is to take a global point of view1. In this case, the results for the air velocity just after the inlet will be studied. The quality of the whole simulation is highly dependent on the good prediction of the interaction between the jet and the surrounding air. As shown on Figure 5, CFD simulation is very close to the experimental data. The velocity decay and the rise of the jet are correctly predicted especially far away from the inlet. Indeed, near the inlet, the quality of the simulation depends strongly on the mesh refinement and the quality of the boundary conditions. Unfortunately, mesh
refinement implies more computing time and resources. But, for this room, even with a fine mesh, it is still possible to obtain good results within a few hours on a single computer (4h with a parallel license on 3 processors). This parameter will be more important for bigger studies as it will be shown.
The second step of the reporting phase consists in a numerical comparison between CFD and experimental results to assess the accuracy of the numerical approach. In this case, air temperatures and velocities were available.
Figure 6. Results for the Single Room Case (2)
As shown on Figure 6, a very good agreement exists between experimental data and numerical results. The mean absolute error on air temperature is 0.16°C and the mean absolute error on air velocity is 0.015m/s. Moreover, numerical results are always inside the uncertainty range of the sensors. It can easily be concluded from this that CFD is able to predict airflows in a single room very precisely within a work day on a single computer.
1
This interesting step implies to have such results which are rarely available in the literature. Unfortunately, for the other cases, we had to skip this step.
4.2 Partitioned Room Case
For this case, the complete process described by Chen and Srebric (2001) is reproduced. Geometrical description
As shown of Figure 2, this case is composed of four rooms. The volume of the first and the last room are 22m³ while the volumes of the two other rooms are 14.5m³. The detailed measurements are given in Wang (2007). The rooms are linked by small openings (≤0.12m²) which define two pathways for air.
Experiment description
The air temperature was measured in 63 locations (9 columns with 7 sensors). The results in the heated room will be studied in details. These results were obtained with omni-directional hot spheres anemometers.
Airflow rates are also important. Indeed, as there are two pathways, it is interesting to know precisely the distribution between them. Airflow rates were measured experimentally thanks to a tracer gas analysis. In this case, the contaminant was SF6. The precise way to determine the flow rate in function of the concentration is given in Wang (2007).
Turbulence model
For this study, a LES model was used. Indeed, this approach is the most precise one. There are different LES models and we have chosen to use a LES-WALE (Nicoud et al., 1999) approach because it is the most precise in the near wall regions. This aspect is very important for indoor air simulation and it needs a special attention.
Boundary conditions
The air velocity in the inlet was imposed by a uniform airspeed (0.8m/s). This is not physical but it is the easiest way and it does not have any kind of impact far away from the inlet (especially outside the first room). Concerning the air temperature, it is injected at 18.8°C. For the wall temperature, it was decided to take into account the stratification inside the four rooms. So, it varies linearly with the height (between 21°C and 23°C in the non-heated rooms – between 21°C and 27°C in the heated room). Concerning the outlet, a zero-pressure condition was imposed.
Numerical methods
Each variables were calculated with a second order numerical scheme and gradients were calculated with a Least-Square Cell-Based model.
Convergence was supposed when residuals were sufficiently small and that no more changes in the solution was noticed. An hybrid mesh was used (hexaedral in the heated room and tetraedral in the other one. The mesh was composed of 312 000 cells and a convergence study checked that results do not change with a finer grid.
Results
As shown on Figure 7, numerical results are close to the experimental measurements. This assesses the ability of CFD to predict correctly the air temperature inside a partitioned building. However, local differences can be observed and may be due to the unstationarity of the flow. Indeed, the convection inside the heated room is not stable. Despite this, the predicted temperature range is extremely precise and thermal gradients are well described. These parameters are very important for the occupant’s thermal comfort.
Concerning the mass flow rates, the
(the heated box amplifies the convection and so the airflow rate) while CFD predicted a value of 1.29. Consequently, the relative error is less than 3% which is very good. Such a prediction cannot be obtained with other approaches (multizonal, analytical, etc.).
Results were obtained in two hours (on the same computer as previously). It proves the ability of CFD to predict precisely and quickly thermal behaviour in small buildings. This computing time do not include the working out of the model which can take up to a couple hours in this case.
4.3 Non-Partitioned Building Case
This case is the first one based on a real building. Consequently, a good agreement between numerical and experimental data is very important to convince building engineers and architects of the interest to use CFD. The numerical results were obtained with a 1 200 000 hexaedral cells mesh. So it is a quite heavy calculation but it is still possible to do it within a few hours (6 hours in this case). Even if computing time and resources begin to increase, solutions exist. For example, in this case, the external environment was not studied (unlike in Walker, 2005). This permits to study in details the indoor airflow with a good accuracy without using enormous resources.
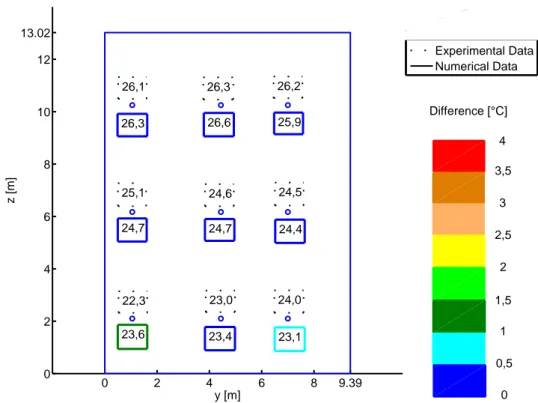
Concerning the results, Figure 8 illustrates that a good agreement exists between our results and the experimental data. However, as for the previous case, small differences exist, especially in the heated zone. These are due, on more time, to the unstationarities existing in the airflow.
Thermal gradients are very small but the prediction of the air temperature is very good (the mean absolute error on the air temperature is less than 0.35°C). So industrials can have, as soon as the design of a new building begins, a very good idea of the future thermal behavior and the occupant’s thermal comfort parameters.
Concerning air velocities, no precise measurements were done experimentally. So it impossible to assess the quality of the results but it would be surprising if results were erroneous.
Figure 8. Results of the Non-Partitioned Building Case
20 22 24 0 1 2 3 z [m] 20 22 24 0 1 2 3 z [m] T [°C] Ground Floor 20 22 24 0 1 2 3 20 22 24 0 1 2 3 T [°C] First Floor South
20 22 24 0 1 2 3 20 22 24 0 1 2 3 T [°C] First Floor North
20 22 24 0 1 2 3 20 22 24 0 1 2 3 T [°C] Second Floor Column Heated Zone Column Heated Zone
4.4 Atrium with Solar Radiation Case
The experimentation for this case was realized in a real building in Canada (Basarir, 2009). This case is interesting for different aspects including the impact of simplifications in the studied design and the treatment of the solar radiation. Indeed, to realize this study with CFD, it was necessary to simplify the geometry. For example, a staircase was omitted. Concerning radiation, a model has to be chosen. Models are numerous. The simplest one deals only with the solar input while the most complex one takes into account wall radiation, multiple reflections and a participative media. The aim of this case is to familiarize the new user to this aspect. For this presentation, the simplest model was used but a comparison between the different radiation models is available in Barbason (2010).
Results in the center of the atrium are shown on Figure 9. It can be seen that numerical results are one more time very close to the experimental data. The mean absolute error on air temperature is less than 0.5°C (in comparison, the range of temperature inside the atrium is greater than 5°C. These results prove that CFD is able to predict accurately the air stratification inside an atrium exposed to solar radiation. Concerning the computing time, it took 20 hours to obtain converged results. This time may become too long for industrials. It may be due to a wrong initial condition guess or to the large temperature range between exposed walls (up to 48°C) and non-exposed ones (down to 25°C).
5 DISCUSSION
Results for each case prove clearly that CFD represents a new reliable solution. Thanks to numerical simulations, it is now possible to predict correctly airflows in buildings. The good agreement between experimental and numerical data validates the use of Fluent for the four cases. With this methodology, architects and building engineers will be able to compare and calibrate their own results with experimental and numerical results described above.
The interest of CFD is not to replace older tools (as multizone simulations) but to help industrials to get a better prediction in the design stage for some important parameters like temperature stratification or air velocity in rooms.
0 2 4 6 8 9.39 0 2 4 6 8 10 12 13.02 y [m] z [m] data1 data2 Experimental Data Numerical Data Difference [°C] 4 3,5 3 2,5 2 1,5 1 0,5 0 26,1 26,3 26,2 25,1 24,6 24,5 24,0 23,0 22,3 26,6 25,9 26,3 24,4 24,7 24,7 23,1 23,4 23,6
6 CONCLUSION
This paper was made to fill in a void. It aims to create a tool that will help architects and building engineers to become confident in CFD simulations. We proposed a validation process for CFD in building physics dealing with four physical phenomena and four geometry scales. Indeed, it is important for new users to know how to optimize their simulations choices for these two aspects.
Compared with other tools, CFD simulations provide precise gradients of temperature, airflows and air velocities in buildings whatever its configuration. Consequently, occupant’s comfort is predictable. The use of CFD will thus permit to improve projects realization and to prevent classical errors in buildings (lack of ventilation, overheating, etc.). Eventually, one should not forget that numerical simulations can greatly improve building energy performance, one of the main challenges of this century, but also IAQ and occupant’s comfort.
7 ACKNOWLEDGEMENT
This research is a part of the SIMBA project. It is supported by the European Regional Development Fund (ERDF) and the Walloon Region.
8 REFERENCES
Chen, Q. and Jiang, Z. (1992) Significant questions in predicting room air motion, ASHRAE Transactions, Volume 98, p. 929-939.
Barbason, M., van Moeseke, G. and Reiter, S. (2010) A validation process for CFD use in building physics, Proceedings of the 7th International Confenrence on Indoor Air Quality, Ventilation and Energy Conservation in Buildings, August 2010, Syracuse, NY, USA, p. 1-8.
Chen, Q. and Srebric J. (2001) How to verify, validate, and report indoor environment modeling CFD analysis, ASHRAE RP-1133, p. 1-58.
Barbason, M. (2010) Validation de la CFD en physique des bâtiments, Report of the LEMA, Université de Liège, p. 1-80.
Kuznik, F., Rusaouën, G. and Brau, J. (2007) Experimental and numerical study of a full scale ventilated enclosure: Comparison of four two equations closure turbulence models, Building and Environment, Vol. 42, p. 1043-1053.
Wang, L. (2007) Coupling of multizone and CFD programs for building airflow and contaminant transport simulations, PhD Thesis, Purdue University, p. 1-169.
Walker, C. (2005) Methodology for the evaluation of natural ventilation in buildings using a reduced-scale air model, PhD Thesis, Massachusetts Institute of Technology, p. 1-172.
Basarir, M.N. (2009) Numerical study of the airflow and temperature distributions in an atrium, PhD Thesis, Queen’s University, p. 1-111.
ANSYS Inc. (2009) ANSYS Fluent 12.0 Documentation (Version 12.0.16).
Nicoud F. and Ducros F. (1999) Subgrid-Scale Stress Modelling Based on the Square of the Velocity Gradient Tensor. Flow, Turbulence, and Combustion, Vol. 62, p.183-200.
![Figure 8. Results of the Non-Partitioned Building Case 2022240123z [m]2022240123z [m]T [°C]Ground Floor20222401232022240123T [°C]](https://thumb-eu.123doks.com/thumbv2/123doknet/5596868.134576/6.892.111.804.430.944/figure-results-non-partitioned-building-case-ground-floor.webp)