thixoformability of a Cr steel. It focuses on the liquid fraction curves of different Cr steels with modifications of composition. The effect of composition modifications was observed. The solid fraction versus temperature has been obtained by a thermodynamics software (MTData) and by Differential Scanning Calorimetry (DSC), limited to low heating rates. MTData permits to obtain information on the influence of alloying elements, with the advantage of the possibility to change the chemical composition very easily. The DSC tests determine the influence of the heating rate on these curves.
Introduction
Thixoforming is the shaping of metal components in semi-solid state. To achieve this, the material has to be characterized and to be adapted so that it fulfills the criteria regarding liquid curve parameters (a weak slope, a low solidus temperature, a large melting interval…), the microstructural criteria (solid metal particles as globular as possible, fixed rate of liquid matrix…) and the mechanical or physical criteria (thermal and electrical conductivity as high as possible, optimal tensile strength…). All these properties must be optimized to achieve a thixotropic material and to achieve the mechanical properties needed for industrial applications. The thixotropic state leads to a decrease of the viscosity when the material is submitted to shear stresses.
This paper concerns the study of the liquid fraction curve which has been performed along two directions. First, the influence of Cr on the liquid fraction curve has been analyzed for low heating rate (10°C/min) with Differential Scanning Calorimetry (DSC). Then, the liquid fraction versus temperature has been obtained at equilibrium for several alloys theoretically by a thermodynamics software. These curves show the influence of five alloying elements (Mo, Ti, V, Ni + Cr), common in the industry, on the liquid fraction curve parameters. The comparison of the results especially for Cr has finally been made between liquid fraction curves obtained thermodynamically and with a low heating rate.
Characterizing parameters for liquid fraction curves
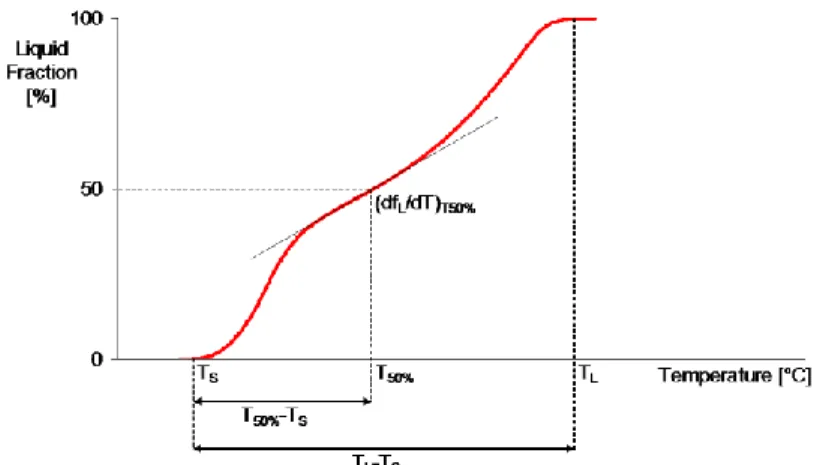
Some parameters have already been given by Kazakov [1] for the liquid fraction versus temperature curve. However, they have been adapted for the present case. These parameters are shown on Figure 1 and are:
The solidus and liquidus temperatures, TS and TL, which must be as low as possible; The temperature at 50% liquid, T50%, which must be as low as possible;
The melting interval, TL-TS, which must be as large as possible;
The semi-melting interval, T50%-TS, of interest as it approximates the thixoforming window; The slope at 10 and 50% liquid, (df/dT)10% and (df/dT)50%, which must be as low as possible to
ensure a small sensitivity of liquid fraction to temperature.
All rights reserved. No part of contents of this paper may be reproduced or transmitted in any form or by any means without the written permission of the publisher: Trans Tech Publications Ltd, Switzerland, www.ttp.net. (ID: 139.165.121.136-17/08/09,14:34:23)
Fig. 1. Liquid fraction curve parameters
DSC results
Influence of Chromium. DSC signals can be integrated between the solidus and liquidus
temperatures to obtain the liquid fraction versus temperature curves. The experiments in the present study were limited to a heating rate of 10°C/min. Five Cr contents have been experimented with this method [2]. It allows, first, an analysis of the influence of Cr, and then, a comparison with equilibrium results obtained later.
The results obtained are summarized in Table 3.
Table. 3. Liquid fraction curve parameters obtained by DSC for 5 different Cr steels
TS T50% TL (df/dT)50% TL-TS 12%Cr 1227 1326 1402 0.48 175 18%Cr 1233 1272 1370 3.15 137 20%Cr 1244 1274 1346 3.92 102 27%Cr 1268 1293 1316 4.39 48 30%Cr 1273 1300 1335 4.89 63
It can be observed that Cr leads to an increase in the solidus temperature and in the liquid fraction curve slope at 50% liquid and to a decrease in liquidus temperature and in the melting interval. Classical DSC apparatus has shown that the addition of more than 12 to 18% Cr on high Carbon alloyed steels is not favourable in terms of thixotropic behaviour. The equilibrium study, for the analysis of the influence of the other alloying elements was performed with a 12% Cr steel.
Equilibrium study
Thermodynamical studies. A thermodynamics software that allows to obtain equilibrium
diagrams, phase compositions or phase fractions for all chemical compositions has been used (MTData). It allows to theoretical values with experimental results with time and material savings.
Liquid fraction curves and results. First of all, to analyze the behavior of the liquid fraction
curve as a function of the alloying elements, a base alloy has been chosen based on DTA results. Its chemical composition is given in Table 1.
Table. 1. Chemical composition of the base alloy
Fe C Mn Cr Ni Mo Si V Nb Ti
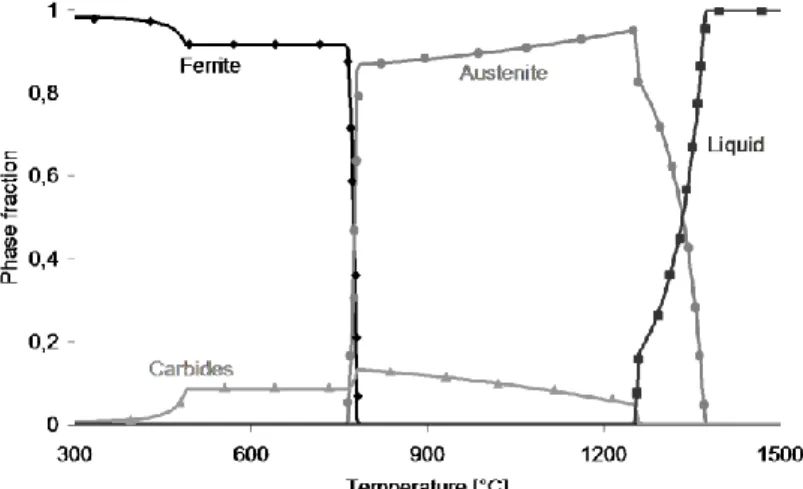
Fig. 2. Evolution of the phases at equilibrium, as obtained with MTData
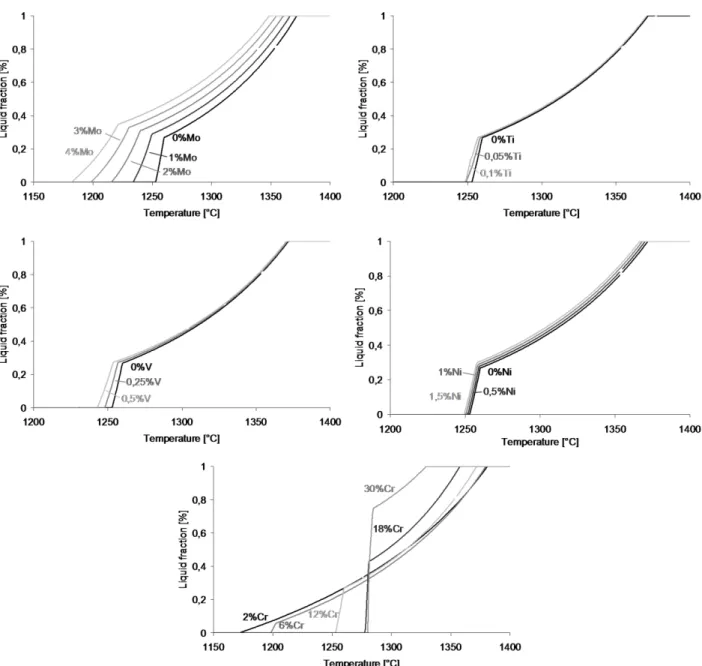
The most interesting parameter for thixoforming is nevertheless the melting interval. The influences of Mo, Ti, V, Ni and Cr have been observed more precisely in this interval of temperature. The range of these alloying elements corresponds to existing alloying level for high Cr high C steel. Table 2 gives a summary of the influence of different alloying elements on the liquid fraction curve parameters. The corresponding curves obtained thermodynamically are seen in Figure 3.
Table. 2. Influence of Mo, Ti, V, Ni and Cr on the liquid fraction curve parameters Range [w%] TS T50% TL (df/dT)10% (df/dT)50% TL-TS Mo (0-4) Ti (0-0.1) V (0-0.5) Ni (0-1.5) Cr (2-30)
It has been pointed out that Mo, Ti, V and Ni lead to a decrease in solidus, 50% liquid and liquidus temperatures and in 10% and 50% liquid slopes. An increase of the melting interval is also observed, except for Ni. The influence of Mo, Ti and V seems so to be very positive in the study range on the liquid fraction curve: increase of melting interval with decrease of characteristic temperatures. The same results as obtained with DSC were observed for Cr. Effectively, increasing Cr contents (>12%) lead to an increase in the solidus temperature, a decrease in the liquidus temperature, and thus, a decrease in the melting interval. It also causes an increase of the slope, which corresponds to the sensitivity of the liquid fraction with temperature. Lower content of Cr (<12%) leads to an improvement in terms of thixotropic behavior but also to a decrease of mechanical properties (decrease of hardness due to lower M7C3 content).
Fig. 3. Influence of Mo, Ti, V, Ni and Cr on liquid fraction curves obtained at equilibrium
Comparison of DSC and equilibrium results
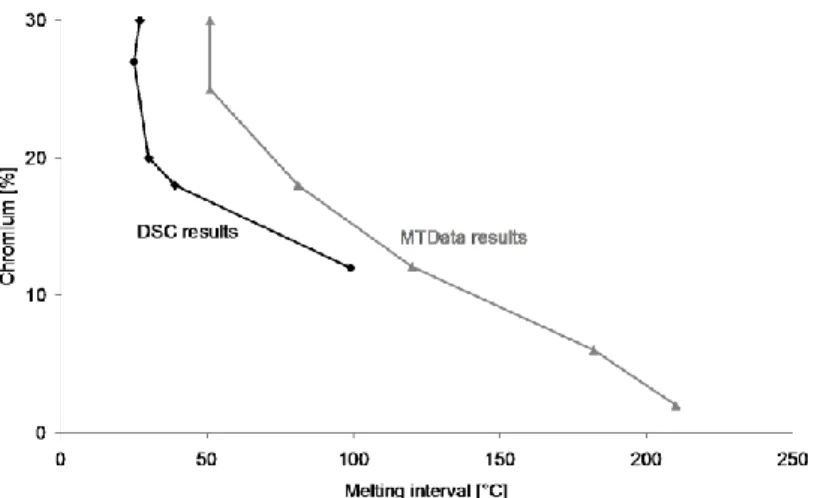
The results obtained for the influence of Cr at equilibrium or at low heating rate are very similar. For example, the melting interval values at different Cr contents, obtained thermodynamically and at heating of 10°C/min are illustrated in Figure 4.
It can be observed that the DSC results present a melting interval smaller than equilibrium results. The difference is certainly due to a number of factors: small differences in the chemical composition between theoretical calculation and experimental alloys, influence of the heating rate, precision in temperature measurement.
Fig. 4. Comparison of equilibrium and DSC results for melting interval
Conclusions
The comparison between different high Cr alloys shows that the addition of more than 12% to 18% Cr in high Carbon alloyed steels is not favorable in terms of thixotropic behavior. The best compromise between thixotropy and mechanical properties seems to be the 12% Chromium steel. Mo, Ti and V additions to this base alloy (12%Cr) are favorable for thixoforming in the studied range. Ni has to be certainly limited to improve the liquid fraction curve parameters. The results reported in this paper are limited to equilibrium and low heating rate, and industrial heating rate has to be employed to confirm the observation.
It is nevertheless important not to forget that alloying elements also impact the mechanical properties and that thixoforming must not decrease the properties of the final piece. The identification of the alloying elements favorable for thixoforming is then not the only parameter to take into account. The use and the properties needed for the material after forming need to be consider as well.
References
[1] A.A. Kazakov, Alloy Compositions for Semisolid Forming, Advanced Material and Processes (2000), p.31-34.
[2] J. Lecomte-Beckers, A. Rassili, M. Robelet, C. Poncin, R. Koeune, Determination of solidification parameters used for the prediction of the thixoformability of several steel alloys,
Alloy Characterization to Adapt Steels to Thixoforming: Study of a High Chromium High Carbon Steel