Viability of equine articular chondrocytes in alginate beads exposed to
different oxygen tensions
N. Schneider a,b,c, J.-P. Lejeune a,c, C. Deby b, G.P. Deby-Dupont b, D. Serteyn a,b,c a
Service d'Anesthésiologie Générale et Pathologie Chirurgicale des Grands Animaux, Faculté de Médecine Vétérinaire (B 41), Université
de Liège, Sart Tilman, 4000 Liège, Belgium
b Centre of Oxygen Research & Development (CORD), Institut de Chimie, B6a, Sart Tilman, 4000 Liège, Belgium c Centre Européen du Cheval de Mont-le-Soie 6698 Grand-Halleux, Belgium
Abstract
Ischaemia and reperfusion are suspected to alter chondrocyte metabolism. Here, we studied the effects of three oxygen (O2) tensions on the viability of equine articular chondrocytes isolated from the cartilage of the distal interphalangeal joint of horses. Chondrocytes were cultured in alginate beads under 1%, 5% or 21% gas phase O2 concentration for 14 days, cellular growth kinetics were measured (n = 6), and the cells were observed by light microscopy after staining for necrotic and apoptotic cell detection. For information about the metabolic status, the intracellular adenosine triphosphate (ATP) content was measured.
The number of chondrocytes remained stable for the first eight days, then decreased especially at 1% and 21% O2. At 21% O2, normal cells decreased and necrotic cells increased at the end of the 14 day-period. No
significant variations were found at 5% O2 except for a decrease in necrotic cells at day 14. Most apoptotic cells were found at 1% O2 from days 5 to 11, and normal cells decreased during the same period. But an unexpected increase in normal cells and decrease in apoptotic cells were observed at day 14. The intracellular ATP content remained stable. It was concluded that, in a three-dimensional culture model of equine articular chondrocytes, O2 tension affected the viability of the cells after an 11-day period, with the most important effects observed at 21% and 1% O2 conditions.
Keywords : Horse ; Articular chondrocytes ; Alginate beads ; Hypoxia ; Hyperoxia
1. Introduction
Changes in oxygen (O2) partial pressure are suspected to influence the metabolism and survival of articular chondrocytes (Ysart and Mason, 1994; Grimshaw and Mason, 2000) and O2 adjusted to 5% seems to best approach the concentration surrounding chondrocytes in vivo (Grimshaw and Mason, 2000). A value of 1% O2 would represent hypoxia that may exist in a traumatised joint (Henrotin et al., 1993; Lotz et al., 1999). Normal aerobic conditions (21% O2) are currently used for chondrocyte culture and metabolism assays, although hyperoxia may disturb the oxidation-reduction (redox) status of the cell (Lotz et al., 1999).
Morphology and stability of cartilage cells also depend on interactions between chondrocytes and their matrix (Shakibaei et al., 1997). Three-dimensional cultures in alginate beads offer a model that allows the building of a cell matrix and the stability of the chondrocyte phenotype for long culture periods (Hauselmann et al., 1994; Platt, 1996; Grimshaw and Mason, 2000). Oxygen tensions are probably also implicated in extracellular matrix building and the phenotype of articular chondrocytes (Domm et al., 2002).
The aim of the present study was to investigate the cell number and the viability of equine articular chondrocytes when cultured in a three-dimensional matrix (alginate beads) model over 14 days under different O2 tensions: 1%, 5% or 21% O2. As differences in the composition of articulations cannot be excluded, we decided to investigate only one type of articular cartilage, namely that of the distal interphalangeal (DIP), or coffin, joint.
2. Materials and methods
2.1. Reagents
Dulbecco's modified Eagle's medium (DMEM), 2-[4-(2-hydroxyethyl)-1-piperazine]ethanesulphonic acid (Hepes) and antibiotics were obtained from Biowhittaker. Alginate, calcium chloride and sodium salts, ascorbic acid, Tris, collagenase and hyaluronidase were from Sigma-Aldrich; fungizone, proline and glutamine were obtained from Invitrogen; trichloracetic acid and pronase were from Merck, and trypan blue from ICN
Biomaterials. The Vybrant Apoptosis Detection kit was obtained from Molecular Probes and the ATP Assay kit from ThermoLifeSciences.
2.2. Cartilage sampling and chondrocyte isolation
Cartilage was harvested from the DIP joints of fore-and hind-limbs of horses euthanased for welfare reasons or slaughtered at a local slaughterhouse. There was no selection for breed, sex or age. An area of about 10 cm above the coronary band of the hoof was clipped, the skin and subjacent tissue were removed without
preliminary opening of the joint. The joint capsule, the collateral sesamoidean ligaments, the collateral ligaments of the DIP joint and the dorsal extensor tendon of the digit were dissected.
The isolation of equine articular chondrocytes and preparation of the alginate beads were performed aseptically as previously described (Sanchez et al., 2002). Briefly, the cartilage, cut in small pieces, was subjected to a triple enzymatic digestion (sequentially: hyaluronidase, pronase, collagenase) in DMEM without glutamine, added to 10 mM Hepes, 4.5 g/L of glucose and a mixture of antibiotics and fungizone. After digestion, the chondrocytes were filtered (filter porosity 0.70 µm), centrifuged, and washed three times in culture medium. Finally the cells were counted and their viability was quantified by 0.4% trypan blue in buffered saline solution.
2.3. Alginate beads formation and culture conditions
The cell suspension was adjusted to 4 × 10⁶ chondrocytes/mL of sterile 1.2% alginate solution in 0.9% sodium chloride, buffered by 1% Hepes. Beads were formed by addition of 0.1 M calcium chloride solution (5 mL/mL of cell-alginate suspension). About 1 × 10⁶ chondrocytes were incorporated in 18 alginate beads.
The beads prepared with the cells isolated from one cartilage sample were divided into three batches and cultured (37 °C) at three different gas phase O2 concentrations, 21%, 5%o or 1%, in the presence of 5% carbon dioxide (CO2) and, respectively, 74%, 90% or 94% nitrogen (N2) (premixed gas composition in a humidity-saturated atmosphere).
Cell handling for the cultures at 5% or 1% O2 was performed in a sterile glove box (glove box C45201; Fisher Bioblock), gas-controlled (N2, O2 and CO2) by micro-flow controllers. The O2 content of the box was measured using an oxymeter (IS02, OXEL-1; World Precision Instruments). The media and solutions needed for the culture were balanced to the desired O2 tensions for 1 h before use. For the culture at 21% O2, cell manipulations were done at ambient air under a laminar flow hood. Alginate beads (18 beads/well; 24 wells-plate Nunclon; Invitrogen) were cultured for 14 days. The first step was a wash out for two days in DMEM without glutamine, supplemented with 4.5 g/L glucose, 10 mM Hepes, 1% penicillin/streptomycin solution and 1% ITS+ (Sanchez et al., 2002). The beads were further cultured during 12 days in the same medium added with 50 µg/mL of ascorbic acid, 2 mM proline and 200 µg/mL glutamine, with culture medium changes every three days. An alginate bead sampling of four beads was performed after the wash out and at each medium change and used for viability kinetic studies.
2.4. Cell morphology study
After sampling, the beads were washed two times with saline, and depolymerised in 1 mL of 0.1 M sodium citrate (prepared in saline equilibrated to the required O2 tension). The cells were then centrifuged for 15 min at 160g and washed three times. A cell aliquot (corresponding to one well) was used for counting and viability studies. For counting and general microscopic observations, chondrocytes were stained by 0.4% trypan blue dye and observed under light microscopy (Axioskop 20, Zeiss). For the detection of apoptosis and necrosis, they were stained by two fluorescent dyes, the Alexa fluor 488 stain, binding to human annexin V to indicate early apoptosis (Vermes et al., 1995) and a Sytox green dye, which intensively stained the DNA of necrotic cells.
Cells were observed by fluorescent microscopy (Axioskop 20 Zeiss, with excitation filter 09 FITC).
Observations by contrast phase microscopy were made on the same cell preparations. Photographic pictures were taken under fluorescence and phase contrast observation (400 ASA film for fluorescing images and 100 ASA for the phase contrasted images, Fujichrom or Kodak). The camera (Nikon F) worked with a magnification factor of 15, and the final enlargement was 15 × 40 for fluorescence, and 15 × 40 or 15 × 100 for contrast phase studies. The photographic pictures taken under fluorescence microscopy were scanned and analysed individually to distinguish normal, apoptotic and necrotic cells.
2.5. Adenosine triphosphate (ATP) measurement
ATP was extracted from cells with 1% trichloroacetic acid solution. Before the ATP assay (ATP Assay Kit BO1243-107), trichloroacetic acid was diluted to 0.1% with 0.1 mM Tris-Na acetate buffer. The test was based on the reaction of luciferin with ATP in the presence of firefly luciferase and O2, producing oxyluciferin, with light emission (luminescence measurement; Multiscan Ascent). The ATP values were given for 1 × 10⁶ cells. 2.6. Statistical analyses
Statistical analysis was performed using an Instat program (Instat for Macintosh). Means were compared by Student's t test for unpaired values or by the non-parametric Mann-Whitney test. Significance was set at p < 0.05.
3. Results
3.1. Cartilage samples
Articular cartilage samples were obtained from the DIP joints of six horses, three mares and three geldings, aged from three to 18 years, of the following breeds: three Warmbloods, one Andalusian horse, one Iceland horse and one Ardenner draught horse. The cartilage was collected from the forelimbs of six horses and the hind-limbs of five horses. Wet weight was generally higher in forelimb samples (range 7.9-32 g forelimbs; 4.53-30 g hind-limbs). The total cell number was higher in the forelimbs as well as the ratio of chondrocytes per gram of cartilage, but the differences were not statistically significant. Viability (trypan blue exclusion test) of the isolated chondrocytes after enzymatic digestion was always higher than 96%.
3.2. Kinetic evolution of total cell number and global microscopic observations
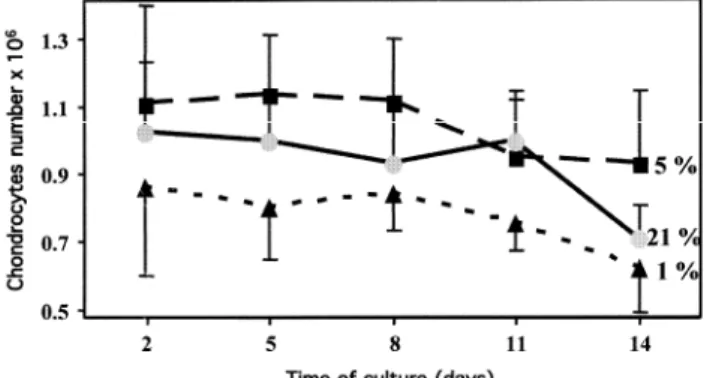
The evolution of the number of chondrocytes is shown in Fig. 1 for the different O2 tensions and days of culture. No statistical difference was observed in the number of cells at the different time points nor between the different O2 concentrations. However, from day 11, we observed a reduction of the cell numbers under all culture
conditions, and on day 14, at 21% and 1% O2, the number of chondrocytes clearly decreased, at the limit of statistical significance (Mann-Whitney test, p = 0.0519 for day 14 versus day 2).
Fig. 1. Evolution of the number of chondrocytes counted at days 2, 5, 8 11 and 14, at three different oxygen
Global light microscopy after trypan blue staining revealed a blue coloured material surrounding the cells: the density and colour intensity increased in relation with the O2 tension applied during the culture. The cells developed different patterns of cluster formation until day 14. At 21% O2, the chondrocytes formed large accumulations of about 50 cells; the blue material was stained intensely and dense (corresponding to the
observations of Domm et al., 2002). At 5% O2, the chondrocytes built clusters of about 20 cells, with intense and dense blue material (but less than at 21% O2), surrounding most of the chondrocytes. The cells cultured at 1% O2 produced less of this material, were less intense and less dense, with smaller cell clusters and frequently isolated cells. From day 8 of culture, cellular fragments were visible, especially at 1% O2, and, at 21 and 5% of O2, intracellular vesicles were observed by contrast phase microscopy.
3.3. Analysis of cell status: normal, apoptotic or necrotic cells
For each time and culture condition, an average of 100 cells were analysed using photographic pictures taken under fluorescence microscopy to sort the cells in normal, apoptotic or necrotic cells. Normal cells showed no or little fluorescence, attributable to neighbouring effects of surrounding fluorescent cells (Fig. 2B). Apoptotic cells showed an orange halo in the early apoptotic phase and a mild green fluorescence in a later phase of apoptosis (Fig. 2A). Necrotic cells showed an intense green fluorescence turning yellow (Fig. 2D). Fig. 2C indicates that the alginate beads were transparent and that the cells and their configuration were visible without staining with a magnification of 100× or 200×. The evolution of the percentages of normal, apoptotic and necrotic cells found for the different time points at the three different O2 tension are summarised in Fig. 3 (Fig. 3, days 2-14). At 21% O2, after two days of culture (end of washout), we observed a significant increase in necrotic cells compared to 5% O2 and 1% O2. The percentage of apoptotic cells increased in the last period of culture, reaching a statistically significant value when compared to the 5% and 1% O2 on day 14 groups. We also observed a decrease in the number of normal cells, which was statistically significant at day 14 compared to 5% O2 and 1% O2.
At 5% O2, the number of normal, apoptotic and necrotic cells stayed nearly constant until day 8 of culture. In the last period of culture, an important increase of normal cells (89% on day 14 versus 64% on day 11) and a decrease of apoptotic cells (8% on day 14 versus 31% on day 11) were observed, but these differences did not reach statistical significance. The necrotic cells decreased at day 14.
At 1% O2, the number of normal cells decreased continuously until day 11 : this decrease was statistically significant on day 5 and day 8 compared to 21% and 5% O2. At day 14, an unexpected increase of normal cells was observed (72% on day 14 versus 52% on day 11). The apoptotic cells increased at days 5 and 8, remained stable until day 11, and decreased surprisingly thereafter. Necrotic cells continuously increased until day 14. 3.4. Analysis of intracellular ATP
The intracellular content of ATP ranged from 3 × 10⁻⁹ to 8 × 10⁻⁸ moles for 1 × 10⁶ cells at the end of the wash out period (two days). We did not observe significant modifications to the ATP concentrations until the 11th day of culture. After 14 days, a tendency towards decreased ATP concentrations was observed, but the difference did not reach statistical significance.
Fig. 2. Examples of fluorescent pictures of chondrocytes after staining for apoptosis and necrosis (see Section
2). Normal living cells are marked "Liv", apoptotic cells "A", and necrotic cells "N". Picture A: Equine articular chondrocytes at the end of the washout (2nd day), cultured at 1% O2. Four cells are visible, three with a
fluorescent core. One cell (N) is necrotic (high intensity of fluorescence). Picture B: Equine articular
chondrocytes cultured at 1% O2: the culture was stopped on day 5 (1st change of medium). Some giant cells are
detectable. Picture C: Equine articular chondrocytes cultured at 21% O2: the culture was stopped on the 8th day
(2nd change of medium). The cells are normal (Liv), apoptotic (A) or necrotic (N). An interesting aspect of this picture is the conformation of the chondrocytes, corresponding to that of chondrocytes included in the alginate beads. Picture D: Equine articular chondrocytes cultured at 21% O2: the culture was stopped on the 11th day
(3rd change of medium). A small cluster of chondrocytes is observable. Two cells show preliminary apoptosis (A) and one has undergone necrosis (N).
Fig. 3. Analysis of the chondrocyte status during the 14-day culture in alginate beads. Cellular evolution is
expressed as the percentage of normal, apoptotic and necrotic cells, at the three O2 tensions. * p < 0.005 versus
5% O2 and <0.05 versus 1% O2; ** p < 0.0001 versus 5% O2 and <0.05 versus 1% O2; *** p < 0.0001 versus
5% O2 and <0.0005 versus 1% O2. # p< 0.05 versus 21% and 5% O2; ## p < 0.001 versus 21% and 5% O2 § p
< 0.005 versus 21% O2; §§ p < 0.001 versus 21% and <0.0005 versus 5% O2; §§§ p < 0.05 versus 21% O2;
4. Discussion
In this study, cartilage samples were obtained from the DIP joint of six horses. The weight of articular cartilage and the number of isolated cells were increased in the forelimbs, as would be expected since the thoracic limbs carry around 60% of the body weight. However, investigations on a greater number of horses would be needed to establish significant differences related to breed, age or gender.
For culturing isolated chondrocytes for 14 days under 21%, 5% or 1% O2, we chose the alginate bead culture model, because the other culture models raised several difficulties (Hering, 1999). Chondrocytes are cells that depend on each other by an intercellular communication based on adhesion. These communications have a direct effect on their metabolism. For this reason, chondrocytes need to be cultured in a system which allows them to constitute their three-dimensional matrix, permitting the exchange of chondrocytes products and diffusion of essential factors for cellular metabolism (Hauselmann et al., 1994 ; Gregory et al., 1999; Gugala and Gogolewski, 2000). In our model, the chondrocyte concentration in alginate beads was about 1 × 10⁶
chondrocytes for 18 alginate beads. This cell density was higher than that observed in histological preparations of articular cartilage, but corresponded to the cell density used by other authors in similar models (Guo et al., 1989; Sanchez et al., 2002).
Our results confirm that equine articular chondrocytes in vitro maintained their phenotype and metabolic pathways at 5% O2 tension. As it has been reported that articular chondrocytes (human and bovine) are sensitive towards hyperoxia (Henrotin et al., 1993) and hypoxia (Grimshaw and Mason, 2000), we cultured equine chondrocytes in hyperoxic conditions at 21% O2 and in hypoxic conditions at 1% O2. Our main observation was that at the three different O2 tensions, the total number of cultured chondrocytes stayed roughly stable during 8 days of culture. A decrease in cell numbers only started on day 11 at 5% and 1% O2 and was present on day 14 at the three O2 tensions. These results are in agreement with the observations of Grimshaw and Mason (2000), who maintained bovine articular chondrocytes for seven days in alginate beads at 0.1%, 5%, 10%, and 20% O2. They noted that chondrocytes exposed to near-anoxic conditions (0.1% O2) were metabolically less active, and concluded that chondrocytes could be cultured without problems at 5% and 10% O2. For these authors, 10% O2 would be present at the surface of the cartilage, with variations of O2 tension depending on the depth of cartilage (<1% in the deep layers). This estimation has to be re-evaluated on basis of the results of Gonsalves et al. (2000), who proved different diffusion gradients depending on the density of the network-like collagen fibres.
For better respective analysis of the percentages of normal, necrotic and apoptic cells, we combined staining for detection of early apoptosis with staining for detection of necrotic cells. Such kinetic analysis of cell status until 14 days of culture in alginate beads, had never been performed prior to our study. We observed that the
percentages of normal cells changed with the assay conditions and time of culture, and found the most important changes at 1% and 21% O2, with a decrease of normal cells and an increase of apoptotic cells, especially at day 11 for 1% O2 and at day 14 for 21% O2. The percentages of normal cells that we found were always less than those given by Grimshaw and Mason (2000), who reported that cells liberated from the alginate beads had a viability of 90-100%, independent from the O2 tension of the culture medium. However, these authors cultured cells for seven not for 14 days, and used trypan blue staining, which might be difficult to use for the model of chondrocytes in alginate beads as the dye also stains pericellular material. It must be taken into consideration that impaired chondrocytes at an early state of apoptosis, could still possess a membrane impermeable to trypan blue, despite the fact that apoptosis was an irreversible process and that cells which exhibited apoptosis were certain to die. Our results confirmed those of Blanco et al. (1995), who showed that variations of O2 tension would
introduce apoptosis of equine articular chondrocytes, and may play a role in the development of osteoarthritis. Microscopically, cells liberated from the beads stayed attached to their pericellular matrix. We found that, especially after the wash out when the cells did not have the time to constitute a pericellular matrix, necrotic cells attacked surrounding cells, which then became apoptotic. The last samples at the end of each culture condition revealed flattened cells, full of bubbles and numerous cellular fragments and bursting chondrocytes were visible. The remaining chondrocytes presented an intact morphology, characteristic of sound chondrocytes.
The intracellular ATP results demonstrated no significant differences for the three different O2 tensions for the duration of the culture period. But, there was a tendency for intracellular ATP to decrease during the last period of culture (11th and 14th days). This parameter did not therefore appear to be a sensitive marker of chondrocyte changes under hypoxic or anoxic conditions, suggesting that mitochondrial respiration is not the major pathway of energetic metabolism in chondrocytes. Other papers have reported the metabolic effects of hyperoxia (20% O2) or anoxia (1% O2) on chondrocytes. A decrease or increase of extracellular matrix component in explant cultures and in confluent surface cultures were observed (Ysart and Mason, 1994; Murphy and Sambanis,
2001a). A role of physiological O2 tension (5% O2) on the restoration of chondrocytes differentiation in alginate beads and on the stimulation of synthetic activity was also reported (Murphy and Sambanis, 2001b; Domm et al., 2002).
In conclusion, it appeared that, in a three dimensional culture model, variations of O2 tension did not affect the total number of equine chondrocytes during 14 days of culture, but that differences in the repartition of the cells between normal, necrotic or apoptotic were present, depending on the O2 concentration. This 14 day culture model appears valuable for further study on the influence of environmental conditions on equine chondrocytes.
Acknowledgements
This study was supported by a grant from the "Ministère de l'Agriculture et de la Ruralité de la Région Wallonne - projet Centre Européen du Cheval, Mont le Soie". We also acknowledge the Bone and Cartilage Metabolism Research Unit from the University of Liège for free disposal to specific culture material.
References
Blanco, F.J., Ochs, R.L., Schwarz, H., Lotz, M., 1995. Chondrocyte apoptosis induced by nitric oxide. American Journal of Pathology 146, 75-85.
Domm, C., Schünke, M., Christesen, K., Kurz, B., 2002. Redifferentiation of dedifferentiated bovine articular chondrocytes in alginate culture under low oxygen tension. Osteoarthritis and Cartilage 10, 13-22.
Gonsalves, M., Barker, A.L., Macpherson, J.V., Unwin, P.R., O'Hare, D., Winlove, Z.P., 2000. Scanning electrochemical microscopy as a local probe of oxygen permeability in cartilage. Biophysical Journal 78, 1578-1588.
Gregory, K.E., Marsden, M.E., Anderson-Mackenzie, J., Bard, J.B., Bruckner, P., Farjanel, J., Robins, S.P., Hulmes, D.J., 1999. Abnormal collagen assembly, though normal phenotype, in alginate bead cultures of chick embryo chondrocytes. Experimental Cell Research 10, 98-107.
Grimshaw, M.J., Mason, R.M., 2000. Bovine articular chondrocyte function in vitro depends upon oxygen tension. Osteoarthritis and Cartilage 8, 386-392.
Gugala, Z., Gogolewski, S., 2000. In vitro growth and activity of primary chondrocytes on a resorbable polyactide three-dimensional scaffold, growth period of 3, 6 and 9 weeks. Journal of Biomedical Materials Research 49, 183-191.
Guo, J.F., Jourdian, G.W., Maccallum, D.K., 1989. Culture and growth characteristics of chondrocytes encapsulated in alginate beads. Connective Tissue Research 19, 277-297.
Hauselmann, H.J., Fernandes, R.J., Mok, S.S., Schmid, T.M., Block, J.A., Aydelotte, M.B., Kuettner, K.E., Thonar, E.J., 1994. Phenotypic stability of bovine articular chondrocytes after long-term culture in alginate beads. Journal of Cell Science PT 1, 17-27.
Henrotin, Y., Deby-Dupont, G., Deby, C., De Bruyn, M., Lamy, M., Franchimont, P., 1993. Production of active oxygen species by isolated human chondrocytes. British Journal of Rheumatology 32, 562-567.
Hering, T.M., 1999. Regulation of chondrocyte gene expression. Frontiers in Bioscience 15, D743-D761.
Lotz, M., Hashimoto, S., Kühn, K., 1999. Mechanisms of chondrocyte apoptosis. Osteoarthitis and Cartilage 7, 389-391.
Murphy, C.L., Sambanis, A., 2001a. Effect of oxygen tension and alginate encapsulation on restoration of the differentiated phenotype of passaged chondrocytes. Tissue Engineering 7, 791-803.
Murphy, C.L., Sambanis, A., 2001b. Effect of oxygen tension on chondrocyte extracellular matrix accumulation. Connective Tissue Research 42, 87-96.
Platt, D., 1996. Articular cartilage homeostasis and the role of growth factors and cytokines in regulating matrix composition. In: MacIlwraith, C.W., Wayne, G.W. (Eds.), Joint Disease in the Horse. W.B. Saunders Company, Philadelphia, pp. 29-40. Sanchez, C, Mateus, M.M., Defresne, M.P., Crielaard, J.M., Reginster, J.Y., Henrotin, Y.E., 2002. Metabolism of human articular chondrocytes cultured in alginate beads. Longterm effects of interleukin 1beta and nonsteroidal antiinflammatory drugs. Rheumatology 29, 772-782.
Shakibaei, M., De Souza, P., Merker, H.-J., 1997. Integrin expression and collagen type II implicated in maintenance of chondrocyte shape in monolayer culture: an immunological study. Cell Biology International 21, 115-125.
phosphatidylserine expression on early apoptotic cells using fluorescein labelled Annexin V. Journal of Immunological Methods 184, 39-51. Ysart, G.E., Mason, R.E., 1994. Responses of articular explant cultures to different oxygen tensions. Biochimica et Biophysica. Acta 1221, 15-20.