Impact of Demographic Changes on Inflation
and the Macroeconomy
Office of the Executive Director
Impact of Demographic Changes on Inflation and the Macroeconomy
Prepared by Jong-Won Yoon, Jinill Kim, and Jungjin Lee1
November 2014
Abstract
The ongoing demographic changes will bring about a substantial shift in the size and the age composition of the population, which will have significant impact on the global economy. Despite potentially grave consequences, demographic changes usually do not take center stage in many macroeconomic policy discussions or debates. This paper illustrates how demographic variables move over time and analyzes how they influence macroeconomic variables such as economic growth, inflation, savings and investment, and fiscal balances, from an empirical perspective. Based on empirical findings—particularly regarding inflation—we discuss their implications on macroeconomic policies, including monetary policy. We also highlight the need to consider the interactions between
population dynamics and macroeconomic variables in macroeconomic policy decisions.
JEL Classification Numbers: J11, E31, E21
Keywords: Demographic Changes, Population Aging, Inflation, Macroeconomic Impact, Savings and Investment, Monetary Policy, Fiscal Policy.
Authors’ E-Mail Addresses: [email protected]; [email protected]; [email protected].
1 Executive Director, International Monetary Fund (November 2012 – October 2014); Professor, Korea University,
and Visiting Scholar at the IMF during the summer of 2014; and Senior Research Officer, Research Department, IMF, respectively. Comments from various IMF Departments and Offices of Executive Directors are gratefully acknowledged.
This Working Paper should not be reported as representing the views of the IMF.
The views expressed in this Working Paper are those of the author(s) and do not necessarily represent those of the IMF or IMF policy. Working Papers describe research in progress by the author(s) and are published to elicit comments and to further debate.
Contents Pages
I. Introduction ...4
II. Description of Demographic Changes ...5
III. Literature Review...10
IV. Empirical Findings...13
IV.1. Data and Methodology ...13
IV.2. Macroeconomic Impact ...14
IV.3. Inflation Impact ...19
V. Conclusion: Policy Implications ...21
Tables 1. Demographic Impact on Growth of Real GDP per capita (PPP-based) ...15
2. Demographic Impact on Current Account, Savings, and Investment ...17
3. Demographic Impact on Budget Balance, Revenue, and Expenditure per GDP ...18
4. Demographic Impact on Inflation ...20
Figures 1. Total Fertility Rate (children per woman) ...5
2. Total Fertility by Major Economies (children per woman) ...6
3. Life Expectancy (years at birth) ...7
4. Total Population Growth (in percent) ...8
5. Working-Age Population Share of Total Population (in percent) ...8
6. Dependency Ratios for Major Economies ...9
Appendixes 1. Summary of Key Variables and List of Sample OECD Countries ...24
2. Variable Definitions and Sources ...25
3. Demographic Trends and Projections of China ...26
4. Relationship between Macro Variables and Elderly Share ...27
5. Relationship between Macro Variables and Working-age Share ...28
6. Relationship between Macro Variables and Population Growth ...29
I. Introduction
Demographic change is one of the most important determinants of the future
economic and social landscape. Many researchers have looked into how changes in the size and the composition of an economy’s population influence macroeconomic outcomes. The channels through which demographic changes affect an economy typically include savings and investment behaviors, labor market decisions, and aggregate demand and supply responses. In the medium to long run, both changes in the labor supply and changes in productivity—either viewed as exogenous or caused by demographic changes—could significantly alter an economy’s aggregate supply and thereby economic growth, since demographic changes affect the amount and combination by which its factor inputs are utilized. In the short run, demographic transitions are likely to affect aggregate demand, since the amount of consumption and investment would depend critically on structural changes in the population’s age-earnings profiles.
This paper intends to analyze the macroeconomic effects of demographic changes from an empirical perspective and to discuss their policy implications—particularly regarding inflation. Effects of demographic changes would depend on the extent of anticipation for the demographic changes, nominal and real frictions, institutional aspects, and behavioral responses. For example, aggregate supply or demand responses might be more flexible when demographic changes are fully anticipated in advance. Macroeconomic dynamics would also be based on the specific frictions assumed to that are built in to a model. In an economy with significant bottlenecks to deter real or nominal adjustments, aggregate supply responses are more likely to lag behind aggregate demand responses, leading to slower output and price adjustments from the supply side.
We attempt to identify the impact of demographic changes on inflation and the macroeconomy by using two kinds of proxies to capture demographic changes. Changes in the total size of population are captured by its growth rate. As for the composition of
population, multiple measures have been proposed to reflect the degree of population aging, such as the shares of working-age and elderly population, dependency ratios, and life
expectancy. We follow earlier empirical work, based on these proxies, and identify empirical evidence on the impact of demographic changes on economic growth, savings and
investment, external current account balance, and fiscal balance. Monetary aspects of
economic outcomes have received less attention in the analysis of demographic changes; we pay particular attention to how inflation behavior is affected by demographic changes.
This paper proceeds as follows. Section 2 describes some stylized facts about the driving forces of demographic changes and their projections into the near future, including fertility and mortality ratios, population growth, and shares of working-age and elderly population. Section 3 provides a brief review of the related literature, covering both theoretical and empirical discussions of the impact of demographic changes on macroeconomic variables including inflation. In Section 4, we elaborate on the data, methodology, and empirical findings on the inflation and macroeconomic impact of demographic changes. The final section concludes and offers some discussion on policy implications.
II. Description of Demographic Changes
The world is about to experience a drastic shift in the size and the composition of the population. Such demographic changes have already begun in some countries, including Japan, and will become conspicuous for many other countries in the coming decades. Two fundamental driving forces that underlie such demographic changes are related to birth and death, i.e. fertility and mortality.2 According to the UN’s World Population Prospects (2013),
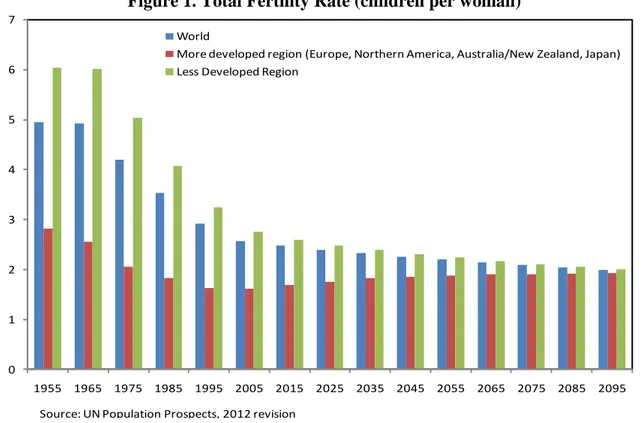
the total fertility rate was around 5 on average around the world in the 1960s. This number has decreased consistently over the last fifty years and is currently around 2.5. It is projected to settle just above 2 by the end of the 21st century.3
There is, however, a significant difference between more developed areas and less developed regions, as illustrated in Figure 1. The fertility rate was as high as about 6 around 1960 in less developed regions, and this region’s fertility rate is currently higher than its world average. Even in the 50s, the fertility rate in the more developed areas was below 3; it has been below 2 for about thirty years starting around 1985. In the long run, the United Nations projects this to move back up to around 2.
Figure 1. Total Fertility Rate (children per woman)
2 While past variations in birth/death rates or immigration factors may also trigger demographic change, they
were not included in the description given their relatively weaker significance.
3 Our assessments are based solely on the baseline projections of the UN’s World Population Prospects (2013).
Demographic trends could change depending on various policy efforts, such as on immigration. 0 1 2 3 4 5 6 7 1955 1965 1975 1985 1995 2005 2015 2025 2035 2045 2055 2065 2075 2085 2095 World
More developed region (Europe, Northern America, Australia/New Zealand, Japan) Less Developed Region
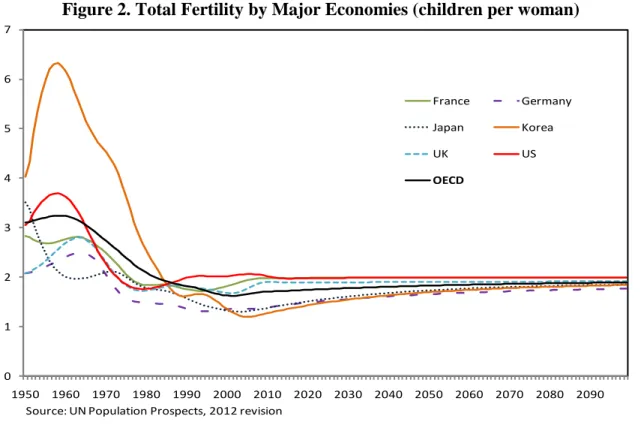
Figure 2 provides information about country-wide total fertility rates for several countries. The fertility rate for five industrialized countries (US, UK, France, Germany, and Japan) stayed between 2 and 4 in the 1950s and 60s and has fluctuated around 2 from the 1970s onward. However, in Korea 1950 and 1980, the fertility rate was above 4 before taking a rapid downward trajectory since then.4 It dropped below 2 around the 1990s before
stabilizing toward the level of 2 since then. In particular, Korea’s fertility rate has remained significantly below 1.5 in the last couple of decades and declined recently to about 1.2, which is one of the lowest levels in the world.
Figure 2. Total Fertility by Major Economies (children per woman)
Besides a decrease in the fertility rate, mortality has been another factor of recent demographic changes. Figure 3 captures a change in mortality by life expectancy that is averaged over a cohort born in each year. The world-average life expectancy of someone who was born in 1955 is close to 50 years, while life expectancy for more developed regions is significantly above 60 years. The life expectancy increases as we move to later cohorts, as anyone would expect. An increase in life expectancy, together with a decrease in the fertility rate as shown in Figures 1 and 2, caused both a change in the size of world population and an aging phenomenon in the composition of the population.
4 Japan and Korea were given emphasis based on their rapid population aging and their lowest fertility levels.
China, the country with the largest population in the world, has also been experiencing significant demographic changes, similar to those of Korea, during the last few decades, which is summarized in Appendix 3.
0 1 2 3 4 5 6 7 1950 1960 1970 1980 1990 2000 2010 2020 2030 2040 2050 2060 2070 2080 2090 France Germany Japan Korea UK US OECD
Figure 3. Life Expectancy (years at birth)
Demographic consequences brought about by the above drivers include changes in the size and the composition of the population. Elevated fertility rates in the 1950s and 60s— combined with an increase in life expectancy—caused population to grow, and the growth rate picked up as well in the more developed countries. Figure 4 shows that the growth rate of total population has been following a decreasing trend since then. Though the population growth rate will remain in the positive range for the world as a whole according to the United Nations projection, total population growth for the OECD in total is expected to enter
negative territory around 2050. In particular, Figure 4 depicts that the total population began to decline in Japan from 2009 and in Germany from mid 2000s with Korea being expected to follow the suit from the mid-2030s. Such declines in the population size could have greater-than-proportional ramifications on the macroeconomy.
Having as much influence on macroeconomic dynamics as the size of population is the composition of population. Figure 5 displays changes in the share of working-age population relative to total population. High fertility rates in the 1950s and 60s were in the background of an increasing trend in working-age share of total population in OECD countries until shortly after 2000. Since then, a decrease in fertility and an increase in
longevity have caused the working-age population share to decline steadily. We can observe the turnaround in the trend of working age population share in recent decade, which divides the rising trend until 1990s and the declining trend from about 2010s. The declines in working-age population share are particularly rapid in Japan and Korea where the total fertility rates have declined very fast.
0 20 40 60 80 100 120 1955 1965 1975 1985 1995 2005 2015 2025 2035 2045 2055 2065 2075 2085 2095 World
More developed region (Europe, Northern America, Australia/New Zealand, Japan) Less Developed Region
Figure 4. Total Population Growth (percent)
Figure 5. Working-Age Population Share of Total Population (percent)
-1.0 -0.5 0.0 0.5 1.0 1.5 2.0 2.5 3.0 3.5 1960 1970 1980 1990 2000 2010 2020 2030 2040 2050 2060 2070 2080 2090 2100 US UK France Germany Japan Korea OECD WORLD
Source: UN Population Prospects, 2012 revision
45 50 55 60 65 70 75 80 1960 1980 2000 2020 2040 2060 2080 2100 US UK France Germany Japan Korea OECD
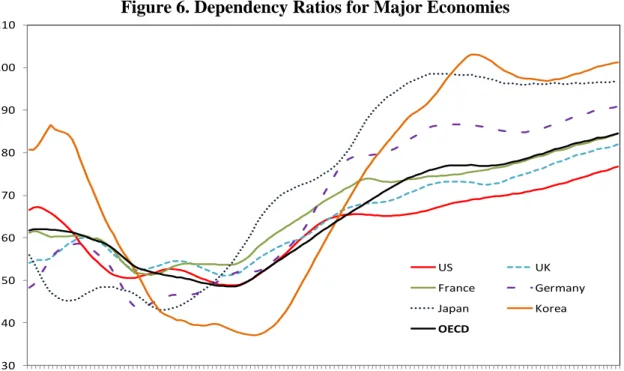
Along with the working-age population share, the dependency ratio has received much attention in macroeconomics—especially in the public finance literature involving pension systems. As shown in Figure 6, dependency ratio is almost a mirror image of the share of working-age population. Around the turn of the century, the dependency ratio was around 50 percent; this number for Korea was as low as 40 percent. The dependency ratio is projected to increase steadily over time—reaching about 100 percent for the case of Japan and Korea. The share of working age population or the elderly dependency ratio tells that a significant change in the population structure has been occurring since 2000s which could have important economic implication on the macroeconomy.5
Figure 6. Dependency Ratios for Major Economies
As a starting point for understanding the effects of demographic changes on macroeconomic outcomes, we can plot the relationship between demographic variables (elderly share, working-age share, and population growth) and macro variables (per capita real GDP growth, saving/GDP, investment/GDP, current account/GDP, budget balance/GDP, and inflation). If we draw scatter plots for pooled data (both cross-section and time-series)— as shown in figures in Appendix 4-6—the relationship is not significant, except for
government revenue and expenditure. This is not unexpected, since pooled data averages out over countries and over time. It is therefore imperative to do a panel analysis based on some country- or time-specific structures on the macroeconomic effects of demographic changes.
5 The EU Aging Report is another source that covers demographic projections —up to the year 2060—where,
for example, the dependency ratio in Germany converges to around 85 percent by then. The UN projections suggest a further increase to around 90 percent for 2100
30 40 50 60 70 80 90 100 110 1960 1970 1980 1990 2000 2010 2020 2030 2040 2050 2060 2070 2080 2090 2100 US UK France Germany Japan Korea OECD
III. Literature Review
To rightly analyze the macroeconomic effects of demographic changes is crucial in exploring appropriate policy responses to minimize adverse effects or unwanted distortions. Reflecting their grave consequences, there have been extensive studies analyzing various aspects of demographic changes to affect an economy, covering its real, external, fiscal, and financial ramifications. There have been broadly two approaches to analyzing the
macroeconomic impact of demographic changes. The standard approach assumes a constant age-specific behavior with respect to employment, earnings, consumption and savings and assesses implications of demographic changes. While this approach is useful for capturing the so-called accounting effects of demographic transitions, the outcomes could be
misleading, as economic behaviors can be altered and institutional aspects can be adjusted. The other approach takes into account the behavioral, institutional, and global responses as well. This approach adds complexities in order to track various channels and their
interactions. However, it allows a richer flavor in its analysis by including reactions to aging-induced price changes, international diversification, and policy changes.
On the macroeconomics side, demographic issues have been most widely dealt with in the context of economic growth. In the textbook treatment of growth theories, the growth rate of population is taken as exogenous and serves as a starting point for growth in real activities. This paper deals with not only real activities and but also inflation. Both
population growth and population aging would matter in the determination of the real interest rate and inflation. In particular, the dependency of the (equilibrium) real interest rate on population dynamics is contingent on how population dynamics are incorporated to the utility specification. In an infinite-horizon model with growing household size, the real interest rate may or may not depend on the growth rate of population.6 This ambiguity will be a source of
difficulty in determining a desirable response of monetary policy in a world of changes in population growth in the medium to short run.
Empirical evidence of the growth effect has been studied extensively. This includes such channels as lower labor inputs, potential negative impact due to increasing tax and contribution burdens, savings and investment, and productivity. The demographic impact on
aggregate real GDP is somewhat straightforward when the population is growing, declining
or aging given the direct implication on the size of labor inputs, while its impact on per
capita real GDP is less so, attracting attention for analysis. For example, Chapter 3 of the
2004 World Economic Outlook by Callen et al. (2004), found that per capita GDP growth is positively correlated with changes in the working age population share, but is negatively correlated with changes in the elderly share. Based on the decomposition of real GDP growth into productivity and changes in labor input due to both population growth and aging, Choi et
6 In the standard case when agents from different generations are treated equally regardless of the size of each
generation that one belongs to, the real interest rate is independent of the population growth rate and increases in the rate of technology change and the rate of time preference; under the alternative assumption that the utility of each generation is weighted equally irrespective of its size (i.e., agents from different generations are treated differently), population growth will bring about a one-to-one increase the real interest rate. See the textbook treatment in Romer (2012) for more discussion on this point.
al. (2014) also shows that the impending demographic change in Korea has a negative impact on real GDP growth.7
However, Bloom, Cunning, and Fink (2010) finds that population ageing will tend to lower labor force participation and savings rates, raising concerns about a slowing of economic growth, but behavioral responses (including greater female labor-force participation) and policy reforms (including an increase in the legal age of retirement) can mitigate the adverse economic consequences of an older population. 8
Population growth affects other real variables as well. The influence of demographic variables has been investigated in the context of the following key economic variables, in addition to growth in real GDP per capita: savings- and investment-to-GDP ratios, the current account-to-GDP ratio, and the budget balance-to-GDP ratio. If the life-cycle hypothesis of savings is valid, consumption smoothing through the lifetime would indicate that people move from net borrowers in their youth to net savers in their working years and finally to dis-savers in their elderly years. Demographic impact on investment seems to be less clear, but has potential impact through savings and labor supply channels. Given the evolution of savings and investment patterns in tandem with demographic changes, current account balances would improve with a larger working age population but worsen with the increase in the elderly share. On the fiscal side, a higher share of working-age population will induce greater revenues, while aging population will result in greater spending in such areas as pensions and health and long-term care spending, aggravating fiscal balance. Existing studies, including Callen et al. (2004) and External Balance Assessment (EBA) methodology by Phillips et al (2013) at the IMF broadly confirmed these hypotheses though there are variations in their effects across studies.
There has been very limited research on inflation in the context of population
dynamics. A declining and aging population could put deflationary pressures on the economy through lower aggregate demand, a negative wealth effect from falling asset prices, and changes in relative prices reflecting different consumption preferences.9 Bullard et al. (2012),
focusing on the interaction among demographics and the desire for redistribution of resources in the economy, asserts that a baby boom can generate temporarily higher inflation and ageing population dynamics will put downward pressure on inflation or even lead to deflation.10
7
They decomposed the real GDP growth into four components (labor productivity, employment rate, changes in the population age structure, and population growth) and found that, from the 2010s, the contribution of population to Korea’s GDP growth has fallen to 0.4 percent and the change in age structure has become a negative component.
8 Borsch-Supan, Hartl and Ludwig (2014)—based on an overlapping generations model with behavioral
reactions—also shows that, while the negative growth effect from population aging in Europe can be compensated by reforms and economic adaptation mechanisms, they may be offset by behavioral reactions.
9 Katagiri (2012) investigated the effects of changes in demand structure caused by population aging on the
Japanese economy and found that population aging—modeled as unexpected shocks to its demand structure— caused about 0.3 percentage point deflationary pressure using a multi-sector new Keynesian model.
10 Bullard et al (2012) argues that the economy has lower inflation with population aging when the old,
However, empirical evidence on inflation has been scant and inconclusive and there are intrinsic difficulties of identifying the empirical impact on asset prices as well. A full-blown DSGE model that is used in the IMF for policy purposes has been modified to incorporate demographic changes—albeit in an hoc way—by Anderson, Botman, and Hunt (2014) and used to understand whether Japan’s population aging is deflationary or not. They found that substantial deflationary pressures arise from population aging—mainly through declining growth and falling land prices—and their findings are based on simulations of a calibrated model rather than being empirically motivated and validated.
Japan is one of the countries that have been studied quite extensively in the context of demographic changes. Not only has the country gone through drastic economic changes in terms of growth, but its transition from aging society to aged society is the fastest in world history. Three European countries—France, Germany, and England—underwent the transformation from an aging society to an aged society in 115, 45, and 45 years, respectively; it took 65 years for the United States to go through this transformation. In contrast, the change took only 24 years in Japan. Muto et al. (2012) investigates how
demographic changes affect GNP per capita and other real variables—mainly via changes on the supply side. In contrast, Katagiri (2012) captures the effects via the demand channels by calibrating preference shocks that correspond to the Japanese experience of changes in demand structures. The effect of demographic changes on the real interest rate has been studied in an infinite-horizon setting by Ikeda and Saito (2012).
Considerable difficulty lies in choosing appropriate variables for capturing demographic changes. In a representative-agent model of growth, population growth is a clean exogenous component that is to be used for empirical analysis. However, in a model with heterogeneous agents—typically in the setting of overlapping generations—there are compositional changes in demographics. Callen et al. (2004) uses the share of working-age population and the share of elderly population as two independent variables; other papers, including Muto, Oda, and Sudo (2012), capture the growth and the composition of population via the fertility rate and the longevity rate. While changes in fertility or mortality are key drivers of demographic changes, they might not be an adequate indicator for analyzing the macroeconomic impact of demographic changes, considering the long lag with which their changes affect the population structure and therefore the economy. For this reason,
demographic indicators reflecting the age structure, such as the share of working-age population or dependency ratios, have often been employed to examine their impact on the macroeconomy. In this paper, we follow this approach and use the shares of working-age population and elderly population as appropriate variables capturing population dynamics, while utilizing the dependency ratios in the regressions that involve savings, investment, and current account balance.
IV. Empirical Findings
IV.1. Data and Methodology
A panel dataset covering 30 OECD economies for periods of 1960–2013 is
constructed to examine the relationship between demographic variables and macroeconomic variables. Specifically, the analysis focuses on the impact of demographic changes on each of the following measures of macroeconomic performance: growth of real GDP per capita; current account balance/GDP; savings/GDP; investment/GDP; government budget balance/GDP; and inflation rate. Building on the bivariate relationships as illustrated in Appendix 4-6, we proceed to a multivariate analysis controlling for other explanatory factors.
In order to examine the impact of demography as a determinant of economic performance, we begin with following specification:
it i it it it
Y Demo ,
where Y is one macroeconomic variable of interest and Demo are relevant measures of demographic structures of individual countries. Z is a set of control variables and the subscripts i and t denote the country and the time period, respectively. Our base estimation scheme is the fixed-effects estimation in the case of cross-country panel data and OLS in the case of a single-country analysis using annual data.
All demography variables including population growth, shares of specific age groups, life expectancy, and other derivative measures like dependency ratios are taken from or calculated based on the population database of the United Nations. An additional benefit of the UN database is that it provides demographic structure projections for most individual countries in the world. In this paper, World Population Prospects: The 2012 Revision, published in 2013, is used to gain information on the future paths of demographic measures.
Control variables for the growth regression include secondary school enrollment ratio, investment/GDP, budget balance/GDP, inflation rate, and openness. For the three regressions of current account, savings, and investment, the controls are budget
balance/GDP, net foreign assets/GDP, growth in the terms of trade, real GDP growth, and openness. Budget balance regression has terms-of-trade growth and openness as control variables. Finally, controls for inflation regression are terms of trade growth, real GDP growth, M2 growth, and change in budget balance/GDP.
Most macro variables of interests, as well as control variables, are constructed using World Economic Outlook and International Financial Statistics databases of IMF or World Development Indicator database of the World Bank. Additionally, the PPP-based real GDP per capita variable is from Penn World Table (PWT) version 7.1 by Heston et al. (2012), and net foreign asset variable is from the updated version of the Lane and Milesi-Ferretti (2007) dataset. Appendix 1 provides summary statistics for the key variables used in the analysis and the list of sample countries. Appendix 2 presents further details on the variables used to analyze the impact of demographic variables, including their respective sources.
IV.2. Macroeconomic Impact
Growth Impact
We now turn to the effects of the demographic changes on the macroeconomic variables. Since the next subsection will focus on the effects on inflation, the three tables in this subsection focus on the real side of macroeconomic variables. The first table displays the demographic impact on real GDP growth per capita and Table 2 will turn to the impact on the current account, savings, and investment. Table 3 will then focus on fiscal policy variables such as budget balance, revenue, and expenditure.
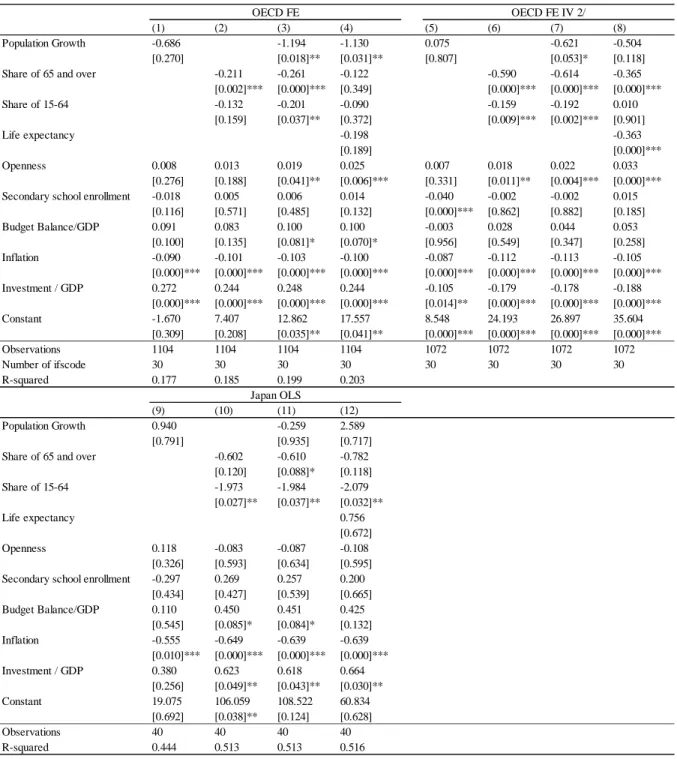
Table 1 shows the results of how demographic variables—together with some other key explanatory variables—affect the growth of real GDP per capita (PPP-based) in the OECD countries. The first column includes only the growth rate of population as a demographic variable. Population growth affects the real growth negatively, though
insignificantly. Among other variables, the coefficient of inflation is negative and significant at the 1 percent level and the impact of the investment to GDP ratio on real GDP growth per capita is significantly positive. The next column is based on a regression that uses the share of elderly (65 and above) and the share of 15-64, instead of population growth. Between the two variables, the share of elderly affects output growth negatively and significantly, while the influence of the share of 15-64 is insignificantly negative. Inflation and the investment-to-GDP ratio affect the GDP growth in the ways similar to Column (1). Column (3) includes the three population variables together; it is interesting that all three variables—population growth, the share of elderly, and the share of 15-64—turn out to be significant and openness becomes significant at the 5 percent confidence level. The fourth column has life expectancy as well as the three population variables, since life expectancy affects the population
dynamics differently; in this case, only the impact of population growth is significant at the 5 percent level. The message of the four specifications is that the size of population affects the real GDP per capita growth negatively and that ageing, as captured by the share of 65 and above, influences real GDP growth in the negative way. The next four columns—Columns (5) to (8)—are based on the instrumental variables method to address a potential endogeneity problem and the message is similar. Life expectancy affects real GDP growth significantly negatively in this case.
Table 1 also includes results in the case of Japan. Though it is generally regarded that changes in population dynamics have been most dramatic in this country, the results on demographic impact on growth are not as strong.11 For example, the share of 15-64 affects
the GDP growth per capita negatively, which is probably due to endogeneity that is not fully captured in this specification. It is interesting that the coefficient on inflation is significantly negative in all four specifications.
11 The impact on aggregate real GDP growth could be sizable, considering the effect of the declining and aging
population on labor inputs. The demographic impact on per capita growth would be less so, as it will depend on how demographic changes affect the combination of factor inputs and the level of productivity.
Table 1. Demographic Impact on Growth of Real GDP per capita (PPP-based)
(1) (2) (3) (4) (5) (6) (7) (8)
Population Growth -0.686 -1.194 -1.130 0.075 -0.621 -0.504
[0.270] [0.018]** [0.031]** [0.807] [0.053]* [0.118]
Share of 65 and over -0.211 -0.261 -0.122 -0.590 -0.614 -0.365
[0.002]*** [0.000]*** [0.349] [0.000]*** [0.000]*** [0.000]*** Share of 15-64 -0.132 -0.201 -0.090 -0.159 -0.192 0.010 [0.159] [0.037]** [0.372] [0.009]*** [0.002]*** [0.901] Life expectancy -0.198 -0.363 [0.189] [0.000]*** Openness 0.008 0.013 0.019 0.025 0.007 0.018 0.022 0.033 [0.276] [0.188] [0.041]** [0.006]*** [0.331] [0.011]** [0.004]*** [0.000]***
Secondary school enrollment -0.018 0.005 0.006 0.014 -0.040 -0.002 -0.002 0.015
[0.116] [0.571] [0.485] [0.132] [0.000]*** [0.862] [0.882] [0.185] Budget Balance/GDP 0.091 0.083 0.100 0.100 -0.003 0.028 0.044 0.053 [0.100] [0.135] [0.081]* [0.070]* [0.956] [0.549] [0.347] [0.258] Inflation -0.090 -0.101 -0.103 -0.100 -0.087 -0.112 -0.113 -0.105 [0.000]*** [0.000]*** [0.000]*** [0.000]*** [0.000]*** [0.000]*** [0.000]*** [0.000]*** Investment / GDP 0.272 0.244 0.248 0.244 -0.105 -0.179 -0.178 -0.188 [0.000]*** [0.000]*** [0.000]*** [0.000]*** [0.014]** [0.000]*** [0.000]*** [0.000]*** Constant -1.670 7.407 12.862 17.557 8.548 24.193 26.897 35.604 [0.309] [0.208] [0.035]** [0.041]** [0.000]*** [0.000]*** [0.000]*** [0.000]*** Observations 1104 1104 1104 1104 1072 1072 1072 1072 Number of ifscode 30 30 30 30 30 30 30 30 R-squared 0.177 0.185 0.199 0.203 (9) (10) (11) (12) Population Growth 0.940 -0.259 2.589 [0.791] [0.935] [0.717]
Share of 65 and over -0.602 -0.610 -0.782
[0.120] [0.088]* [0.118] Share of 15-64 -1.973 -1.984 -2.079 [0.027]** [0.037]** [0.032]** Life expectancy 0.756 [0.672] Openness 0.118 -0.083 -0.087 -0.108 [0.326] [0.593] [0.634] [0.595] Secondary school enrollment -0.297 0.269 0.257 0.200
[0.434] [0.427] [0.539] [0.665] Budget Balance/GDP 0.110 0.450 0.451 0.425 [0.545] [0.085]* [0.084]* [0.132] Inflation -0.555 -0.649 -0.639 -0.639 [0.010]*** [0.000]*** [0.000]*** [0.000]*** Investment / GDP 0.380 0.623 0.618 0.664 [0.256] [0.049]** [0.043]** [0.030]** Constant 19.075 106.059 108.522 60.834 [0.692] [0.038]** [0.124] [0.628] Observations 40 40 40 40 R-squared 0.444 0.513 0.513 0.516
1/ Fixed-effect estimation for OECD and OLS for individual country regressions using annual data.
2/ Secondary school enrollment, Budget balance/GDP, Inflation, and Investment/GDP are instrumented using their lagged values. 3/ P-values based on robust t-statistics in brackets. * significant at 10%; ** significant at 5%; *** significant at 1%.
OECD FE OECD FE IV 2/
Impact on Current Account, Savings, and Investment
We now turn to the demographic impact on three key macroeconomic variables: current account, savings, and investment—all relative to GDP. It is interesting to note their bivariate relationships, as presented in Appendices 4 and 5, that a rising elderly share improves the current account mainly through a reduction in investment, while a greater working-age share improves the current account, but due to a greater increase in savings than in investment. Turning to the results of the multivariate analysis, the top part of Table 2 is based on the population variables that were used in Table 1, while the bottom part is based on two newly-defined variables regarding the composition of the population. The results based on the regressions for the OECD countries using the share of 65 and above and the share of 15-64, as well as population growth and life expectancy, are displayed in Columns (1) to (3). Population growth influences current account, savings, and investment negatively, though insignificantly. The negative impact of the elderly share is significant for savings and investment. Life expectancy affects savings positively and significantly, which reflects the growing need for the elderly to spread their consumption over their longer living years.12
The columns on the right are based on the data on Japan. Columns (5) and (6) show that population growth and life expectancy influence savings and investment negatively and the negative impacts are significant at the 1 percent confidence level.
The lower half of Table 2 is based on the old dependency and young dependency ratios that are a transformation of population shares, as noted below the table. As in the other case displayed in the upper half, the old dependency ratio influences savings and investment negatively for the OECD countries, as in Columns (8) and (9); population growth and life expectancy affect savings and investment negatively for Japan, as in Columns (11) and (12).
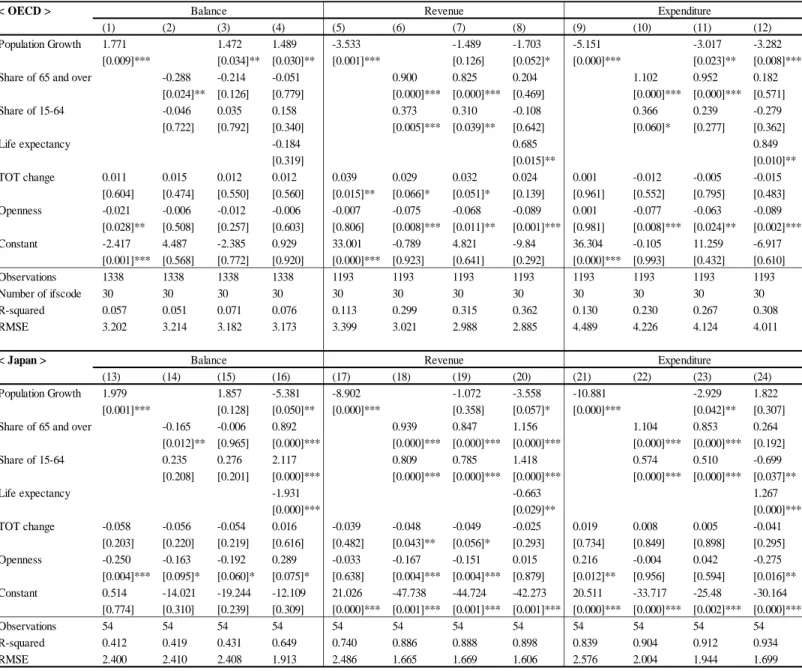
Fiscal Impact
Table 3 focuses on the variables that are closely related to fiscal policy: budget balance, government revenue, and government expenditure—all relative to GDP. For the OECD countries, population growth affects budget balance positively. The elderly share is shown to affect budget balance negatively, as its effect on expenditure seems to be greater than that on revenue. Other variables do not affect budget balance significantly. Revenue is negatively affected by population growth, while the impact from population shares, on the other hand, is positive. Expenditure variables are affected similarly, with openness affecting them negatively.
In the case of Japan—the bottom panel—the influence of population growth on budget balance is mixed. The share variables are quite significant in their impact on these fiscal policy variables, particularly including the positive and significant coefficient of the elderly share on expenditure.
12 This demographic impact on the current account needs to be considered in assessing the desirable level of
Table 2. Demographic Impact on Current Account, Savings, and Investment
CA/GDP S/GDP I/GDP CA/GDP S/GDP I/GDP
(1) (2) (3) (4) (5) (6)
Population Growth -0.397 -0.776 -0.185 2.050 -7.740 -10.113
[0.603] [0.277] [0.836] [0.305] [0.000]*** [0.002]***
Share of 65 and over -0.372 -0.942 -0.486 -0.464 0.270 0.604
[0.141] [0.001]*** [0.043]** [0.199] [0.217] [0.239] Share of 15-64 -0.246 0.012 0.249 0.358 0.582 0.122 [0.163] [0.951] [0.219] [0.339] [0.085]* [0.836] Life expectancy 0.379 0.428 -0.210 0.826 -2.222 -2.942 [0.180] [0.019]** [0.327] [0.085]* [0.000]*** [0.000]*** Budget Balance/GDP 0.109 0.399 0.313 0.089 0.516 0.445 [0.215] [0.000]*** [0.000]*** [0.311] [0.000]*** [0.013]** NFA / GDP 0.026 0.028 0.002 0.111 0.018 -0.088 [0.009]*** [0.000]*** [0.652] [0.059]* [0.681] [0.296] TOT change 0.110 0.063 -0.049 0.079 0.010 -0.072 [0.001]*** [0.001]*** [0.043]** [0.000]*** [0.564] [0.017]** GDP growth -0.106 0.180 0.255 0.109 0.066 -0.047 [0.195] [0.027]** [0.000]*** [0.043]** [0.294] [0.564] Openness 0.033 0.005 -0.024 0.078 0.004 -0.084 [0.105] [0.754] [0.209] [0.317] [0.948] [0.462] Constant -9.447 2.229 31.270 -85.597 167.525 254.051 [0.484] [0.824] [0.006]*** [0.022]** [0.000]*** [0.000]*** Observations 1163 1121 1163 43 43 43 Number of ifscode 30 29 30 R-squared 0.184 0.439 0.383 0.770 0.973 0.953 RMSE 3.157 2.889 2.834 0.763 0.741 1.170
CA/GDP S/GDP I/GDP CA/GDP S/GDP I/GDP
(7) (8) (9) (10) (11) (12) Population Growth -0.654 -0.876 -0.021 1.681 -8.125 -10.213 [0.380] [0.258] [0.981] [0.376] [0.000]*** [0.001]*** Old Dependency -0.162 -0.560 -0.332 -0.423 -0.036 0.372 [0.215] [0.000]*** [0.006]*** [0.026]** [0.813] [0.172] Young Dependency 0.143 0.019 -0.121 -0.110 -0.291 -0.117 [0.080]* [0.829] [0.173] [0.547] [0.064]* [0.680] Life expectancy 0.448 0.368 -0.339 0.755 -2.341 -3.013 [0.133] [0.038]** [0.148] [0.087]* [0.000]*** [0.000]*** Budget Balance/GDP 0.115 0.398 0.306 0.088 0.525 0.459 [0.184] [0.000]*** [0.000]*** [0.302] [0.000]*** [0.008]*** NFA / GDP 0.026 0.029 0.002 0.117 -0.002 -0.117 [0.009]*** [0.000]*** [0.566] [0.032]** [0.967] [0.141] TOT change 0.108 0.063 -0.048 0.079 0.012 -0.070 [0.001]*** [0.001]*** [0.044]** [0.000]*** [0.466] [0.015]** GDP growth -0.109 0.180 0.259 0.112 0.068 -0.048 [0.185] [0.025]** [0.000]*** [0.037]** [0.274] [0.544] Openness 0.033 0.004 -0.025 0.079 0.000 -0.090 [0.109] [0.811] [0.208] [0.302] [0.993] [0.417] Constant -36.980 5.890 61.560 -50.522 229.472 272.624 [0.097]* [0.672] [0.002]*** [0.170] [0.000]*** [0.000]*** Observations 1163 1121 1163 43 43 43 Number of ifscode 30 29 30 R-squared 0.188 0.431 0.379 0.780 0.973 0.955 RMSE 3.149 2.909 2.844 0.745 0.739 1.141
1/ Fixed-effect estimation for OECD and OLS for individual country regressions using annual data.
2/ Young Dependency = (Ages 0-14) / (Ages 15-64); Old Dependency = (Ages 65 and over) / (Ages 15-64). 3/ P-values based on robust t-statistics in brackets. * significant at 10%; ** significant at 5%; *** significant at 1%.
OECD Japan
Table 3. Demographic Impact on Budget Balance, Revenue, and Expenditure per GDP
< OECD >
(1) (2) (3) (4) (5) (6) (7) (8) (9) (10) (11) (12)
Population Growth 1.771 1.472 1.489 -3.533 -1.489 -1.703 -5.151 -3.017 -3.282
[0.009]*** [0.034]** [0.030]** [0.001]*** [0.126] [0.052]* [0.000]*** [0.023]** [0.008]***
Share of 65 and over -0.288 -0.214 -0.051 0.900 0.825 0.204 1.102 0.952 0.182
[0.024]** [0.126] [0.779] [0.000]*** [0.000]*** [0.469] [0.000]*** [0.000]*** [0.571] Share of 15-64 -0.046 0.035 0.158 0.373 0.310 -0.108 0.366 0.239 -0.279 [0.722] [0.792] [0.340] [0.005]*** [0.039]** [0.642] [0.060]* [0.277] [0.362] Life expectancy -0.184 0.685 0.849 [0.319] [0.015]** [0.010]** TOT change 0.011 0.015 0.012 0.012 0.039 0.029 0.032 0.024 0.001 -0.012 -0.005 -0.015 [0.604] [0.474] [0.550] [0.560] [0.015]** [0.066]* [0.051]* [0.139] [0.961] [0.552] [0.795] [0.483] Openness -0.021 -0.006 -0.012 -0.006 -0.007 -0.075 -0.068 -0.089 0.001 -0.077 -0.063 -0.089 [0.028]** [0.508] [0.257] [0.603] [0.806] [0.008]*** [0.011]** [0.001]*** [0.981] [0.008]*** [0.024]** [0.002]*** Constant -2.417 4.487 -2.385 0.929 33.001 -0.789 4.821 -9.84 36.304 -0.105 11.259 -6.917 [0.001]*** [0.568] [0.772] [0.920] [0.000]*** [0.923] [0.641] [0.292] [0.000]*** [0.993] [0.432] [0.610] Observations 1338 1338 1338 1338 1193 1193 1193 1193 1193 1193 1193 1193 Number of ifscode 30 30 30 30 30 30 30 30 30 30 30 30 R-squared 0.057 0.051 0.071 0.076 0.113 0.299 0.315 0.362 0.130 0.230 0.267 0.308 RMSE 3.202 3.214 3.182 3.173 3.399 3.021 2.988 2.885 4.489 4.226 4.124 4.011 < Japan > (13) (14) (15) (16) (17) (18) (19) (20) (21) (22) (23) (24) Population Growth 1.979 1.857 -5.381 -8.902 -1.072 -3.558 -10.881 -2.929 1.822 [0.001]*** [0.128] [0.050]** [0.000]*** [0.358] [0.057]* [0.000]*** [0.042]** [0.307]
Share of 65 and over -0.165 -0.006 0.892 0.939 0.847 1.156 1.104 0.853 0.264
[0.012]** [0.965] [0.000]*** [0.000]*** [0.000]*** [0.000]*** [0.000]*** [0.000]*** [0.192] Share of 15-64 0.235 0.276 2.117 0.809 0.785 1.418 0.574 0.510 -0.699 [0.208] [0.201] [0.000]*** [0.000]*** [0.000]*** [0.000]*** [0.000]*** [0.000]*** [0.037]** Life expectancy -1.931 -0.663 1.267 [0.000]*** [0.029]** [0.000]*** TOT change -0.058 -0.056 -0.054 0.016 -0.039 -0.048 -0.049 -0.025 0.019 0.008 0.005 -0.041 [0.203] [0.220] [0.219] [0.616] [0.482] [0.043]** [0.056]* [0.293] [0.734] [0.849] [0.898] [0.295] Openness -0.250 -0.163 -0.192 0.289 -0.033 -0.167 -0.151 0.015 0.216 -0.004 0.042 -0.275 [0.004]*** [0.095]* [0.060]* [0.075]* [0.638] [0.004]*** [0.004]*** [0.879] [0.012]** [0.956] [0.594] [0.016]** Constant 0.514 -14.021 -19.244 -12.109 21.026 -47.738 -44.724 -42.273 20.511 -33.717 -25.48 -30.164 [0.774] [0.310] [0.239] [0.309] [0.000]*** [0.001]*** [0.001]*** [0.001]*** [0.000]*** [0.000]*** [0.002]*** [0.000]*** Observations 54 54 54 54 54 54 54 54 54 54 54 54 R-squared 0.412 0.419 0.431 0.649 0.740 0.886 0.888 0.898 0.839 0.904 0.912 0.934 RMSE 2.400 2.410 2.408 1.913 2.486 1.665 1.669 1.606 2.576 2.004 1.944 1.699
1/ Fixed-effect estimation for OECD and OLS for individual country regressions using annual data.
2/ P-values based on robust t-statistics in brackets. * significant at 10%; ** significant at 5%; *** significant at 1%.
Balance Revenue Expenditure
IV.3. Inflation Impact
As mentioned above, the demographic impact on real variables—summarized in Tables 1 to 3—has also been analyzed by previous studies. What has received much less attention is the demographic impact on inflation, which is ambiguous in theory given various conflicting channels. For example, population aging or declining will have multifarious demand-side effects due to changing consumption preferences, possibly leading to a reduction in aggregate demand in the economy and lower inflation. On the other hand, it would reduce the effective supply of labor in the economy, adding inflation pressures. As noted earlier, the demographic impact would depend on how changes in population size and structure affect aggregate demand and supply, agents’ inflation expectations, and asset prices, —which in turn depend on the extent of nominal and real frictions, institutional aspects, and behavioral responses.
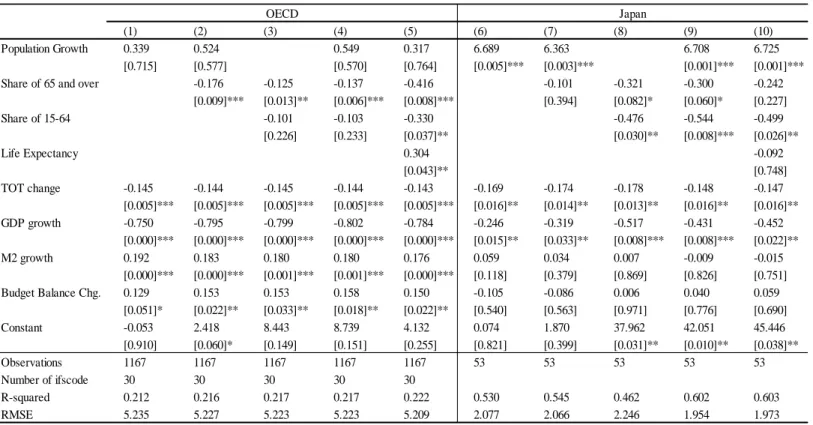
Hence, it is hard to tell from the theoretical perspective how various changes in demographics affects inflation and it would ultimately be an empirical issue, to which Table 4 is devoted.13 The table is based on regressing inflation on demographic variables, as well as other relevant conditioning variables; the columns on the left display results for the OECD data and those on the right correspond to the Japanese case. To capture the deviation from the anticipated change in inflation and population change, the two variables are detrended using a quadratic trend, given that there is a slow-moving component in these series.14
As displayed in Column (1), population growth affects inflation positively, since a greater population implies more aggregate demand. This might be due to the fact that aggregate supply adjustment could be slower than aggregate demand adjustment in
responding to demographic shocks in the short or medium run.15 When the share of elderly is
added as an independent variable (Column 2), population growth continues to affect inflation positively and the influence of the elderly share is significantly negative. Conditional on a given population growth, the aging process will suppress inflation significantly. This is true when the share of 15-64 is coupled with the elderly share (Columns 3 and 4) and when life expectancy is added as well (Column 5). Other conditioning variables used are the change in terms of trade, GDP growth, M2 growth, and the change in budget balance, all of which show very significant coefficients with the expected signs.
13
We attempted to estimate the impact of population growth and aging on housing prices, but were not able to draw meaningful empirical evidence. This might be partly due to the intrinsic difficulties in estimating asset prices. See Terrones (2004), however, for an empirical analysis regarding this issue.
14 Detrending would also avoid the possibility of a spurious regression due to non-stationary trend elements.
The detrended time series can be interpreted as an unanticipated shock from the trend.
15 If supply responses are as flexible as demand responses, there could be little impact on inflation. However,
there might be other channels through which demographic shocks could impart deflationary pressures on the economy, including its impact through wealth effect, due to changing asset prices and/or real exchange rate appreciation arising from changes in asset allocations.
The columns on the right hand side of Table 4 are generated from the data on Japan. Population growth influences the inflation rate significantly positively in all regressions. The effect from population shares is not as strong as in the OECD data.16 Terms of trade and GDP
growth are significant in the Japanese data as well, while the insignificant result on the money growth variable is puzzling.17
These results suggest that the ongoing demographic changes could have a significant deflationary impact in the years ahead, particularly on an economy experiencing a rapid declining and a significant aging of its population. In such circumstances, the
macroeconomic policy framework—including monetary and fiscal policies—needs to be revisited, which will be discussed in the concluding section.
Table 4. Demographic Impact on Inflation
16
The significance of population growth in the inflation regression on Japan, which is in stark contrast to the other OECD countries, might be due to a rapidly declining population. In addition to reducing aggregate demand, the declining population might have led to falling housing prices, which lowers aggregate demand even further.
17 Money growth with a lag could be included in the regression to alleviate the endogeneity problem. However,
the inclusion of lagged variables did not change the result significantly. It is possible to use the short-term nominal interest rates instead of money growth but is also well-known that the short-term rates respond to various macroeconomic variables, notably inflation and the output gap.
(1) (2) (3) (4) (5) (6) (7) (8) (9) (10)
Population Growth 0.339 0.524 0.549 0.317 6.689 6.363 6.708 6.725
[0.715] [0.577] [0.570] [0.764] [0.005]*** [0.003]*** [0.001]*** [0.001]***
Share of 65 and over -0.176 -0.125 -0.137 -0.416 -0.101 -0.321 -0.300 -0.242
[0.009]*** [0.013]** [0.006]*** [0.008]*** [0.394] [0.082]* [0.060]* [0.227] Share of 15-64 -0.101 -0.103 -0.330 -0.476 -0.544 -0.499 [0.226] [0.233] [0.037]** [0.030]** [0.008]*** [0.026]** Life Expectancy 0.304 -0.092 [0.043]** [0.748] TOT change -0.145 -0.144 -0.145 -0.144 -0.143 -0.169 -0.174 -0.178 -0.148 -0.147 [0.005]*** [0.005]*** [0.005]*** [0.005]*** [0.005]*** [0.016]** [0.014]** [0.013]** [0.016]** [0.016]** GDP growth -0.750 -0.795 -0.799 -0.802 -0.784 -0.246 -0.319 -0.517 -0.431 -0.452 [0.000]*** [0.000]*** [0.000]*** [0.000]*** [0.000]*** [0.015]** [0.033]** [0.008]*** [0.008]*** [0.022]** M2 growth 0.192 0.183 0.180 0.180 0.176 0.059 0.034 0.007 -0.009 -0.015 [0.000]*** [0.000]*** [0.001]*** [0.001]*** [0.000]*** [0.118] [0.379] [0.869] [0.826] [0.751] Budget Balance Chg. 0.129 0.153 0.153 0.158 0.150 -0.105 -0.086 0.006 0.040 0.059 [0.051]* [0.022]** [0.033]** [0.018]** [0.022]** [0.540] [0.563] [0.971] [0.776] [0.690] Constant -0.053 2.418 8.443 8.739 4.132 0.074 1.870 37.962 42.051 45.446 [0.910] [0.060]* [0.149] [0.151] [0.255] [0.821] [0.399] [0.031]** [0.010]** [0.038]** Observations 1167 1167 1167 1167 1167 53 53 53 53 53 Number of ifscode 30 30 30 30 30 R-squared 0.212 0.216 0.217 0.217 0.222 0.530 0.545 0.462 0.602 0.603 RMSE 5.235 5.227 5.223 5.223 5.209 2.077 2.066 2.246 1.954 1.973
1/ Inflation and population growth are detrended using quadratic filter.
2/ Fixed-effect estimation for OECD and OLS for individual country regressions using annual data.
3/ P-values based on robust t-statistics in brackets. * significant at 10%; ** significant at 5%; *** significant at 1%.
V. Conclusion: Policy Implications
Demographic changes are one of the most crucial long-term challenges that will have a grave influence on the economy. Given the fertility and mortality trends, the recent and coming decades will represent a watershed in demographic structures, in that we will observe a significant drop in population growth and the working-age population share and a rapid rise in the dependency ratio. Such demographic shifts have already accelerated in some countries, including Japan and Korea, and their impact on the economy might already be widespread, traversing economic growth, inflation, savings and investment, asset prices, and fiscal positions.
Despite the expected grave consequences on the economy, in many macroeconomic policy discussions or debates, demographic changes usually do not take center stage. For example, most growth models assume that population grows at a constant rate—sometimes zero for simplicity—and many business cycle models fix the size of population in analyzing aggregate demand. We have analyzed how demographic variables move over time and how these variables influence inflation as well as real macroeconomic variables.
By using a regression analysis, this paper found that population growth affects real economic variables on the negative side, though insignificant in many instances. The influence of population dynamics on fiscal policy variables is rather mixed. On the inflation side, population growth affects the inflation rate positively, probably through their influence on lower aggregate demand and slow supply responses of which specific channels are yet to be examined. In this vein, the ongoing demographic changes—both shrinking and aging— could have a sizable deflationary impact in the coming years. These dynamics involving demographic changes would change the framework of macroeconomic policies.
Taking the discussion on monetary policy as an example, one of the most popular ways to conduct and/or analyze monetary policy is via a reaction function that relates the policy short-term rate to a few variables that capture the state of the economy. The most well-known is the rule set forth by John Taylor, under which the setting of short-term interest rates responds to inflation and the output gap as well as the equilibrium real interest rate. Population dynamics could affect the independent variables in this reaction function.
First, the equilibrium real interest rate can depend on both the growth rate of the population and the age composition of the population. It is, furthermore, hard to nail down this relationship. The dependence on population growth is related to how the society treats different generations when there is population growth. Regarding population composition, different assumptions on the demand structure in an aging society would yield different implications on the real interest rate.
Second, the concept of the output gap depends on how to measure the potential output, which clearly depends on population dynamics. Especially when the age structure changes over time, the potential output will critically depend on the assumptions regarding
labor participation rate and retirement age.18 Any disagreement on the potential output would
cause different policy prescriptions as far as the short-term policy rate is concerned.
Last but not least, the direction of the policy rate depends on whether the actual inflation rate is above or below its target rate. In principle, the target rate can be set
independently of any other variables in the economy, if we follow the monetarist doctrine.19
However, when population dynamics affect other target variables—such as the equilibrium real rate and the level of potential output—any misspecification in other parts of the economy would amount to unwanted inflation dynamics and the inflation rate may not converge to its target, as policymakers wanted it to. If the demographic change brings significant
deflationary pressures, an original inflation target will become unrealistic and sticking to the target will require the central bank to continue inflating its balance sheet, which will soon turn out to be unsustainable. For this reason, the potential demographic impact on inflation needs to be properly taken into account in monetary policy decisions.20
We have just taken monetary policy as an example on how understanding the impact of population dynamics could inform policymakers, but there are many other examples as well. The issue of how to implement fiscal policy is especially important for investigating the interaction with population dynamics. Fiscal policy tools are sometimes geared to specific groups and population dynamics would affect fiscal policy directly, while monetary policy more or less affects economic agents without particular regard to individual population groups.21
In this paper, we have examined how population dynamics influence various
macroeconomic variables—including the inflation rate—from an empirical perspective. Our empirical results would help researchers form their ideas on how demographic changes could affect inflation or deflation and the macroeconomy. However, population dynamics and their interactions with macroeconomic variables are multifarious, with the macroeconomic impact being different depending on the particular stage in the demographic transition. For this reason, underlying theories about the relations between demographics and macroeconomic variables and their link with the empirical results, including specific channels through which demographic changes affect inflation and the macroeconomy, were not suggested in this paper.
18
Measuring the potential output could become complicated since—-as implied by the term 'demographic dividend'—-productivity might depend on demographic changes, instead of moving exogenously.
19 That is, whether or not aging exerts downward pressure on prices might be irrelevant as a central bank
committed to do whatever it takes should remain capable of anchoring inflation expectations at the target. Anderson, Botman, and Hunt (2014) attributed this monetarist doctrine to the lack of theoretical and empirical research on the relation between demographics and inflation.
20 A possible way is to consider the impact of demographic variables indirectly in a Taylor rule through other
variables, such as the real interest rate, output gap or inflation expectations.
To recap, it would be desirable, therefore, for further research, if the relationship could be analyzed from a theoretical perspective using a macroeconomic model. As hinted in the preceding paragraphs, the interaction between population dynamics and variables
involving macroeconomic policy need be incorporated into such a model, based on some microeconomic foundations. Additional empirical study would also help us better understand channels through which demographic changes affect inflation and the macroeconomy and the resulting macroeconomic consequences. From policy perspectives, it remains crucial to implement appropriate policies without delay through a combination of sound monetary policy, fiscal consolidation, and bold structural reforms to mitigate the perverse effects of the ongoing drastic demographic changes. In addition to advanced countries which are already in the of the demographic watershed, developing countries facing the opposite demographic challenges with high fertility and younger populations should consider the potential impact when the demographic trends ultimately reverse and make intertemporally consistent policy choices.
< Appendix 1 > Summary of Key Variables and List of Sample OECD Countries
Summary of Key Variables
List of Sample OECD countries
Variable Obs Mean Std. Dev. Min Max Population Growth 1354 0.735 0.631 -0.482 3.172 Population Growth (detrended) 1354 -0.017 0.300 -1.194 1.103 Share of 15-64 1354 65.299 3.589 49.549 72.942 Share of 65 and over 1354 12.672 3.769 3.316 25.078 Life Expectancy 1354 74.992 4.804 47.575 83.580 Old dependency ratio 1354 19.285 5.511 5.956 40.532 Young dependency ration 1354 34.368 12.756 19.904 94.425
Per Capita Growth 1255 2.343 3.425 -14.613 12.748 CA/GDP 1329 -0.532 5.004 -28.383 21.266 Savings/GDP 1295 21.990 5.855 -4.245 40.445 Investment/GDP 1335 23.561 4.817 10.864 41.170 Budget Balance/GDP 1354 -2.485 4.222 -25.130 16.652 Revenue/GDP 1209 30.166 9.534 9.461 55.731 Expenditure/GDP 1209 32.835 10.112 9.714 58.459 Inflation 1342 7.323 11.369 -4.480 188.005 Inflation (detrended) 1342 0.179 7.569 -23.281 150.243
United States Norway Spain
United Kingdom Sweden Turkey
Austria Switzerland Australia
Belgium Canada New Zealand
Denmark Japan Mexico
France Finland Korea
Germany Greece Czech Republic
Italy Iceland Slovak Republic
Luxembourg Ireland Hungary
< Appendix 2 > Variable Definitions and Sources
A. Demography variables from UN population prospects (future projections based on 2012 revision)
Population Growth, detrended: Population growth after quadratic detrending, where inflation is subtracted by fitted value from regressing inflation on constant, trend, and trend squared. Share of working age population: Share of age between 15 and 64 years over total population. Share of Elderly Population: Share of age over 64 over total population.
Total Dependency ratio: Number of persons in the population that are not of working age as a percentage of the working age population.
Old Dependency ratio: Number of persons in the population above the age of 64 as a percentage of the working age population.
Young Dependency: Number of persons in the population below the age of 15 as a percentage of the working age population.
Fertility Rate: Average number of child births per woman.
Life expectancy at birth: Average number of years a person born can expect to live given the prevailing mortality rates in that area and period.
B. Variables from World Economic Outlook(WEO) and/or World Development Indicator (WDI) databases
Current Account/GDP, Savings/GDP, and Investment/GDP are from WEO and extended by WDI. Inflation rate is CPI based and constructed from WDI and supplemented by WEO.
Openness: Sum of exports and imports of goods and services divided by nominal GDP. It is based on WDI and extended using WEO.
Budget Balance/GDP: central government budget balance divided by nominal GDP. Government Revenue, Expenditure, and Balance divided by GDP are based on WDI database and extended using WEO.
Budget Balance change: change in budget balance per GDP over previous period.
Secondary school enrollment: Total is the total enrollment in secondary education, regardless of age, expressed as a percentage of the population of official secondary education age. This variable is from WDI database.
TOT change: Log difference of goods and services terms of trade index from previous period’s. Data are based on WEO values.
GDP growth: Growth rate of real GDP from WDI database.
C. Variables from Other Sources
Per capita GDP growth: Growth of real GDP per capita in PPP terms. Underlying PPP GDP variable is from Penn World Table version 7.1.
NFA/GDP: Net foreign assets divided by GDP is from updated and extended version of External Wealth of Nations dataset constructed by Lane and Milesi-Ferretti (2007).
M2 growth: Growth rate of Money and quasi money. M2 data are from WDI and extended using values from International Financial Statistics (IFS) database.
< Appendix 3 > Demographic Trends and Projections of China
Source: U.N. Population Prospects, 2012 Revision
45 50 55 60 65 70 75 80 1960 1980 2000 2020 2040 2060 2080 2100 Share of Working Age Population
0 5 10 15 20 25 30 35 1960 1980 2000 2020 2040 2060 2080 2100
Share of Elderly Population
-1.0 -0.5 0.0 0.5 1.0 1.5 2.0 2.5 3.0 3.5 1960 1980 2000 2020 2040 2060 2080 2100 Population Growth 40 50 60 70 80 90 100 1950 1970 1990 2010 2030 2050 2070 2090 Life Expectancy (years at birth)
0 1 2 3 4 5 6 7 8 1950 1970 1990 2010 2030 2050 2070 2090 Fertility Rate 30 40 50 60 70 80 90 100 110 1960 1980 2000 2020 2040 2060 2080 2100 Dependency Ratio
< Appendix 4 > Relationship between Macro Variables and Elderly Share y = -0.1934x + 4.9145 R² = 0.0391 -20 -15 -10 -5 0 5 10 15 20 25 0 5 10 15 20 25 30 C h a n g e in r e a l G D P p e r ca p it a ( p e rce n t)
Share of elderly population (percentage) Per Capita Growth
y = 0.2808x - 4.1785 R² = 0.0443 -30 -20 -10 0 10 20 30 0 5 10 15 20 25 30 C u rr e n t A cc o u n t / G D P (p e rce n t)
Share of elderly population (percentage) Current Account / GDP y = -0.0564x + 23.025 R² = 0.0012 -5 0 5 10 15 20 25 30 35 40 45 0 5 10 15 20 25 30 S a v in g s / G D P (p e rce n t)
Share of elderly population (percentage) Savings / GDP y = -0.3169x + 27.7 R² = 0.056 5 10 15 20 25 30 35 40 45 0 5 10 15 20 25 30 In v e st m e n ts / G D P (p e rce n t)
Share of elderly population (percentage) Investment / GDP y = -0.0954x - 1.3025 R² = 0.0071 -25 -20 -15 -10 -5 0 5 10 15 20 0 5 10 15 20 25 30 B u d g et B a la n ce / G D P (p er cent )
Share of elderly population (percentage) Budget Balance / GDP y = -0.0094x + 0.1171 R² = 2E-05 -30 -20 -10 0 10 20 30 40 50 0 5 10 15 20 25 30 D e tr e n d e d In fl a ti on ( p e rce n t)
Share of elderly population (percentage) Detrended Inflation
< Appendix 5 > Relationship between Macro Variables and Working-age Share y = -0.053x + 6.0138 R² = 0.0033 -20 -15 -10 -5 0 5 10 15 20 25 45 50 55 60 65 70 75 C h a n g e in r ea l G D P p er ca p it a ( p er cent )
Change in share of working-age population (percentage point change) Per Capita Growth
y = 0.2101x - 14.343 R² = 0.0235 -40 -30 -20 -10 0 10 20 30 45 50 55 60 65 70 75 C u rr e n t A cc ou n t / G D P (p e rce n t)
Share of working-age population (percentage) Current Account / GDP y = 0.4313x - 5.6695 R² = 0.0678 -15 -5 5 15 25 35 45 55 45 50 55 60 65 70 75 S a v in g s / G D P (p e rce n t)
Share of working-age population (percentage) Savings / GDP y = 0.1343x + 15.056 R² = 0.0102 -5 5 15 25 35 45 55 45 50 55 60 65 70 75 In v e st m e n ts / G D P (p e rce n t)
Share of working-age population (percentage) Investments / GDP y = -0.0506x + 0.7998 R² = 0.0019 -30 -25 -20 -15 -10 -5 0 5 10 15 20 45 50 55 60 65 70 75 B u d g e t B a la n ce / G D P (p e rce n t)
Share of working-age population (percentage) Budget Balance / GDP y = -0.062x + 4.0286 R² = 0.001 -30 -20 -10 0 10 20 30 40 50 45 50 55 60 65 70 75 D e tr e n d e d In fl a ti on ( p e rce n t)
Share of working-age population (percentage) Detrended Inflation
< Appendix 6 > Relationship between Macro Variables and Population Growth y = 0.2026x + 2.4193 R² = 0.0014 -20 -15 -10 -5 0 5 10 15 20 25 -1 -0.5 0 0.5 1 1.5 2 2.5 3 3.5 C h a n g e in r e a l G D P p e r ca p it a ( p e rce n t)
Population Growth (percentage) Per Capita Growth
y = -0.6345x - 0.1778 R² = 0.0065 -30 -20 -10 0 10 20 30 -1 -0.5 0 0.5 1 1.5 2 2.5 3 3.5 C u rr e n t A cc ou n t / G D P (p e rce n t)
Population Growth (percentage) Current Account / GDP y = -1.3519x + 23.365 R² = 0.0199 -10 0 10 20 30 40 50 -1 -0.5 0 0.5 1 1.5 2 2.5 3 3.5 S a v in g s / G D P (p e rce n t)
Population Growth (percentage) Savings /GDP y = 0.0121x + 23.771 R² = 3E-06 5 10 15 20 25 30 35 40 45 -1 -0.5 0 0.5 1 1.5 2 2.5 3 3.5 In v e st m e n ts / G D P (p e rce n t)
Population Growth (percentage) Investments / GDP y = 1.0722x - 3.2941 R² = 0.0263 -30 -25 -20 -15 -10 -5 0 5 10 15 20 -1 -0.5 0 0.5 1 1.5 2 2.5 3 3.5 B u d g e t B a la n ce / G D P (p e rce n t)
Population Growth (percentage) Budget Balance / GDP y = -0.0909x - 0.0002 R² = 1E-05 -30 -20 -10 0 10 20 30 40 50 -1.5 -1 -0.5 0 0.5 1 1.5 D e tr e n d e d In fl a ti o n ( p e rce n t)
Detrended Population Growth (percentage) Detrended Inflation
REFERENCES
An, C. and Jeon, S. (2006), “Demographic change and economic growth: An inverted-U shape relationship” Economic Letters, Volume 92, Issue 3, 447-454.
Anderson, D., Botman, D., and Hunt, B. (2014), “Is Japan’s Population Aging Deflationary?” IMF
Working paper, 14/139.
Batini, Nicoletta Tim Callen, and Warwick McKibbin (2006), “The Global Impact of Demographic Change” IMF Working Paper, 06/09.
Besanger, S., Guest, R., and McDonald, I. (2000), “Demographic Change in Asia - The Impact on Optimal National Saving, Investment, and the Current Account” IMF Working Paper, 00/115.
Blanchard, Olivier, Giovanni Dell’Ariccia, and Paolo Mauro (2010), “Rethinking Macroeconomic Policy” IMF Staff Position Note, 10/03.
Blanchard, Olivier, Giovanni Dell’Ariccia, and Paolo Mauro (2013), “Rethinking Macro Policy II: Getting Granular” IMF Staff Discussion Note, 13/03.
Bloom, D., Canning, D., and Fink, G. (2010), “Implications of population ageing for economic growth” Oxford Review of Economic Policy, 26(4): 583-612.
Bullard, James, Carlos Garriga, and Christopher J. Waller (2012), “Demographics, Redistribution, and Optimal Inflation” Federal Reserve Bank of St. Louis Review, 419-439.
Börsch-Supan, Axel, Klaus Härtl, and Alexander Ludwig (2014), "Aging in Europe: Reforms,
International Diversification, and Behavioral Reactions" American Economic Review, 104(5): 224-29.
Callen, Tim, Nicoletta Batini, and Nicola Spatafora (2004), “How will demographic change affect the global economy?” World Economic Outlook, Chapter 3.
Choi, W. et al. (2014), “Demographic waves, growth potential, and policy options” presented at 2014
Bank of Korea International Conference, June 2014.
Faruqee, Hamid (2002), “Population Aging and Its Macroeconomic Implications - A Framework for Analysis” IMF Working Paper, 02/16.
Heston, Alan, Robert Summers, and Bettina Aten (2012), Penn World Table Version 7.1, Center for International Comparisons of Production, Income and Prices at the University of
Pennsylvania.
Ikeda, D. and M. Saito (2012), “The Effects of Demographic Changes on the Real Interest Rate in Japan” Bank of Japan Working Paper Series, No. 12-E-3.
Imam, Patrick (2013), “Shock from Graying: Is the Demographic Shift Weakening Monetary Policy Effectiveness” IMF Working Paper, 13/191.