O
pen
A
rchive
T
OULOUSE
A
rchive
O
uverte (
OATAO
)
OATAO is an open access repository that collects the work of Toulouse researchers and
makes it freely available over the web where possible.
This is an author-deposited version published in :
http://oatao.univ-toulouse.fr/
Eprints ID : 11261
To link to this article :
URL :
http://www.ise2012.boku.ac.at/papers/17570_2.pdf
To cite this version :
Calluaud, Damien and Cornu, Vincent and
Bourtal, Badreddine and Dupuis, Laurent and Refin, Christian and
Courret, Dominique and David, Laurent Scale effects of turbulence
in vertical slot fishways : field ans laboratory measurement
investigation. (2012) In: 9th International Symposium on
Ecohydraulics, 17 September 2012 - 21 September 2012 (Vienne,
Austria).
Any correspondance concerning this service should be sent to the repository
administrator:
[email protected]
9th ISE 2012, Vienna
SCALE EFFECTS OF TURBULENCE FLOWS IN VERTICAL SLOT FISHWAYS:
FIELD AND LABORATORY MEASUREMENT INVESTIGATION
DAMIEN CALLUAUD
INSTITUT PPRIME ; cnrs - Université de Poitiers - isae ensma ; 11 Boulevard Marie et Pierre Curie, BP 30179 Futuroscope Chasseneuil, 86962, France
VINCENT CORNU
INSTITUT PPRIME ; cnrs - Université de Poitiers - isae ensma ; 11 Boulevard Marie et Pierre Curie, BP 30179 Futuroscope Chasseneuil, 86962, France
ONEMA - Pôle Ecohydraulique ; IMFT ; Allée du Professeur Camille Soula Toulouse, 31000, France
BADREDDINE BOURTAL
INSTITUT PPRIME ; cnrs - Université de Poitiers - isae ensma ; 11 Boulevard Marie et Pierre Curie, BP 30179 Futuroscope Chasseneuil, 86962, France
LAURENT DUPUIS
INSTITUT PPRIME ; cnrs - Université de Poitiers - isae ensma ; 11 Boulevard Marie et Pierre Curie, BP 30179 Futuroscope Chasseneuil, 86962, France
CHRISTIAN REFIN
INSTITUT PPRIME ; cnrs - Université de Poitiers - isae ensma ; 11 Boulevard Marie et Pierre Curie, BP 30179 Futuroscope Chasseneuil, 86962, France
DOMINIQUE COURRET
ONEMA - Pôle Ecohydraulique ; IMFT ; Allée du Professeur Camille Soula Toulouse, 31000, France
LAURENT DAVID
INSTITUT PPRIME ; cnrs - Université de Poitiers - isae ensma ; 11 Boulevard Marie et Pierre Curie, BP 30179 Futuroscope Chasseneuil, 86962, France
Scale effects arise due to force ratios which are not identical between a model and its full-scale prototype and result in deviations between the scaled model and prototype observations. This paper describes scales effects in vertical slot fishway flow by comparisons of turbulence behaviours measured in 1:4 scale laboratory model and full-scale fishway. Full-scale measurements are exposed. Flow topology, mean flow and unsteady velocity components features, turbulence kinetic energy profiles are evaluated and compared to measurements model.
1 INTRODUCTION
With the European Water Directive (2000/60/CE), the restoration of ecological continuity in the rivers, and more especially the longitudinal connectivity, become a major stake for the “regulated rivers” to restore their good
ecological status. The most effective solution from an ecological point of view, i.e. the total or partial pulling down of the obstacles, can seldom be used. Thus it remains the solution of the installation of crossing devices like vertical slot fishways. Those facilities were commonly designed for large target-species with good swimming capacities, in particular diadromous ones, and small species were rarely considered. Consequently, their performance for small species still leaves unknown. In order to restore the connectivity for a maximum of species, it is necessary to improve the way to design vertical slot fishways. This imposes a detailed knowledge of flows within these hydraulic structures because the interactions between fishes and turbulence parameters are vital for successful passage through a fishway ([4], [6], [10]).
Flows in vertical slot fishways are turbulent and present unsteady vortex dynamics in relation to the geometric parameters of the pools (slope and pool geometry) ([1], [8], [9], [12]). Improvements of fishway design depend not only on better understanding of the mean flow features, but also of its unsteady behaviour and turbulence characteristics. Within laboratory physical models using Froude number scaling, Particle Image Velocimetry (PIV) and Acoustic Doppler Velocimeter (ADV) measurements allow researchers to determine the characteristics of turbulence with evaluations of the turbulence kinetic energy, energy dissipation ([2], [5], [8]) and unsteady flow behaviours ([11]) in fishway scale models. The main critical point of the physical modelling measurements is that most physical results, including the rate of energy dissipation, or unsteady phenomena, cannot be extrapolated to prototype flow conditions without significant scale effects. In this work, the validity of the Froude similitude on vertical slot fishway flow is tested by comparisons of ¼ scale laboratory experiments and full-scale measurements.
2 DATA ACQUISITIONS
2.1 In-situ measurements and vertical slot fishway prototype
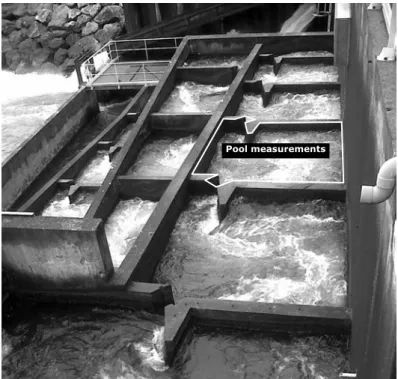
Field measurements were carried out in March 2011 in the vertical slot fishway of the hydroelectric power station of Pardies on Gave de Pau River, in the southwest of France (department of the Pyrénées-Atlantiques). This vertical slot fishways is composed by 16 pools, figure 1. The measurements have been performed in the second pool of the fishpass. The main dimensions are the slot width (b= 30 cm), the pool length (L=300 cm), the pool width (B=246 cm), the fishway slope (s=9.75%), the water level drop between two successive pools. (∆h=30 cm) and the water level on middle of the pool (h=190 cm). During the measurements the discharge has been estimated between 770 and 940 L.s-1.
Figure 1. Vertical slot fishway of the hydroelectric power station of Pardies on Gave de Pau River.
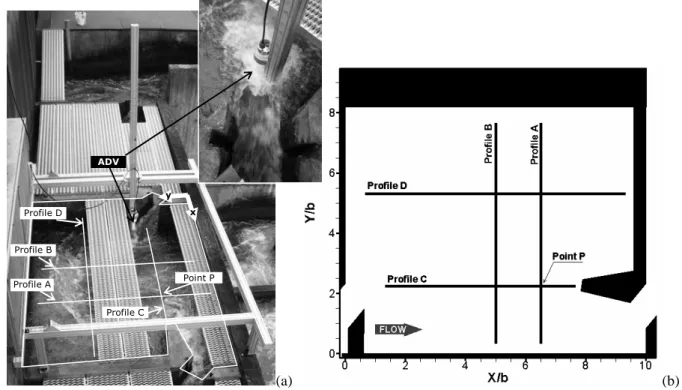
One SonTek/YSI 16 MHz ADV were used to measure the three components of the velocity at 40Hz in 4 profiles in the middle water level on pool, figure 2. The acquisition time for each measurement point is fixed to 5 minutes. The ADV raw datasets were post-treated to eliminate spikes and determine reliable quantitative information of turbulence (mean velocity, turbulence kinetic energy, etc…) and temporal and spatial evolution of the flow in the prototype.
(a) (b)
Figure 2. (a) Measurement pool device and (b) ADV profiles representation.
2.2 Scaling laws and vertical slot fishway model
Comparisons of the full-scale collected data have been achieved with measurements in 1:4 scale laboratory model of the Institut Pprime of the University of Poitiers, France. The model is described in details by Tarrade et al. [11]. Laboratory investigations are performed with geometrically similar fishway based upon a dimensional analysis and dynamic similitude. In the study of fishways, the Froude similitude is commonly used because of relations between inertia and gravity forces. Maintaining Froude number in model and prototype, the following expression for time (t), mean or fluctuating velocity (U) and turbulence kinetic energy (k) can be derived:
( )
2 prototype 1 l el modn
.
t
t
=
(1)
( )
2 prototype 1 l el modn
.
U
U
=
(2)
prototype l el modn
.
k
k
=
(3)
where nl is the geometrical scale (here, nl=1/4)
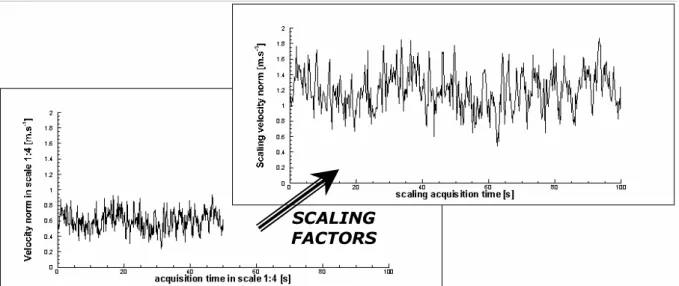
Consequently, it is possible to scaling measurements which have been performed in scale 1:4 vertical slot fishway to 1:1 scale, figure 3. All the exposed quantities plotted figures 6, 7, 8 are scaling to 1:1 scale.
Profile A Profile B Profile D Profile C Point P ADV x y
Figure 3. Scaling factor representation from model acquisition to prototype acquisition.
In the Institut Pprime vertical slot fishway model, flow visualizations, Particle Image Velocimetry measurements (2C-2D PIV) and ADV measurements in several points were performed to obtain the flow topology and to quantify the unsteady characteristics of the fluid motions for several geometric vertical slot fishway configurations and flow features, [11], [12].
The flow in the pools took the form of three distinct zones that varied in position and volume depending on the pass slope and the pool width: a jet from the slot that traverses the pool with decreasing velocity and two separate recirculation zones generated on each side of the jet. Two typical flow patterns can be observed, depending on the slope and the width of the pools. In the first flow pattern, figure 4 (a), the principal flow leaving the slot enters the pools as a curved jet which opens out before converging again towards the next slot. In the second flow pattern, figure 4 (b), the jet has a very curved form and hits the opposite side wall. The two types of flow pattern, noted “1” and “2” figure 4 (c), are dependent of ratio fishway width/ slot width (B/b) and fishway slope (s).
(a)
(b)
(c) Figure 4. Model measurements and observations: (a) first flow pattern - B/b=9, s=10%, (b) second flow pattern- B/b=6.67, s=10%, (c) flow topology for various slopes, pool widths, for L/b=10, from [11].
SCALING
FACTORS
3 SCALE EFFECTS ESTIMATION 3.1 Global flow topology
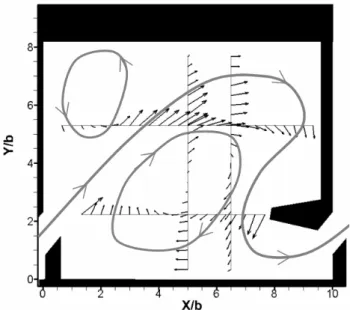
Figure 5 presents the mean velocity profiles obtained in vertical slot fishway prototype The flow in the pool is composed of three main areas: a main curved jet produced by the slot, passing through the pool with decreasing velocity and two fully turbulent recirculation zones generated on each side of the jet. The jet pattern is a very curved and directly impacts the opposite side wall of the vertical slot fishway which defined clearly in a type 2 mean flow topology pattern, figure 4 (b).
The flow topology obtained is different of the predicted topology estimated in model figure 4 (c). Indeed, for a vertical slot fishway defined by a ratio fishway width/slot width (B/b) of 8.2 and a slope of 9.75 %, a type 1 flow pattern is awaited in laboratory experiments, figure 4 (a). The flow topology difference between prototype and model is affected to the smaller baffles dimensions and slot sill on prototype, which could be imposed a more curve jet and a flow pattern 2.
Figure 5. Global flow topology in prototype - B/b=8.2, s=9.75%
3.2 Model and prototype velocity comparisons
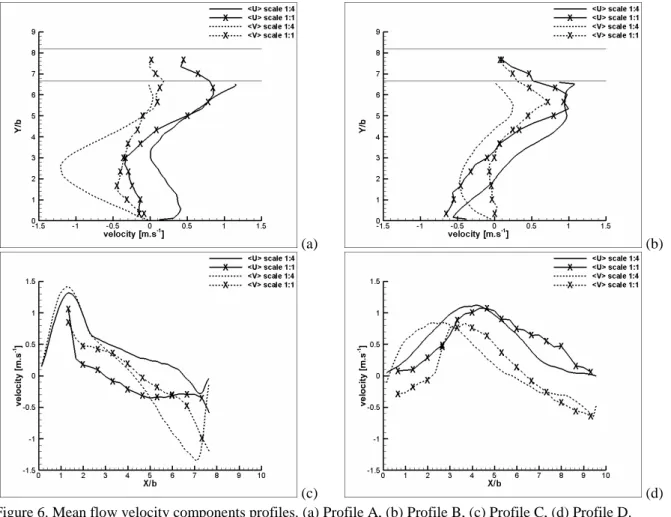
In spite of the differences in topology, it is possible to compare scale 1:1 and scale 1:4 mean velocities for the same flow pattern 2. Full-scale results are compared by measurements performed in vertical slot fishway model with a ratio B/b=6.67, on which the flow features corresponds to the “classical” flow pattern 2 observed in model scale; figure 4. The figures 6 show the mean velocity profiles model and prototype showed figure4 (b). We note that the shapes of profiles for all the plots are in adequacies. Moreover, velocity components have the same magnitude underlining no scaling effects on the mean velocities.
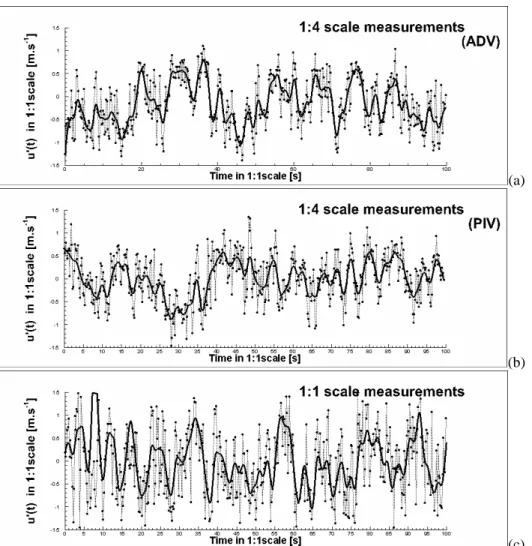
Concerning the turbulence kinetic energy profiles, the figures 7 highlight differences due to baffle influence, mainly for profiles A and D. Nevertheless, the turbulence kinetic energy due to the beating of the jet is clearly underlined. For model or prototype acquisition, turbulence kinetic energy values are different. “TKE in scale 1:1” corresponds to the turbulence kinetic energy values obtained in prototype measurements. “TKE in scale 1:4” corresponds to the turbulence kinetic energy values obtained in model measurements corrected in prototype scale by eq. (3). The scale effects are important as regard of fluctuations. In the prototype vertical slot fishway the turbulence kinetic energy is higher than the model scale. Effectively, based on Froude similitude, model and prototype could not maintaining same Reynolds number. Here, the Reynolds number, based on slot width, in prototype is eight time higher than prototype Reynolds number. The inertia forces are eight time higher than the viscous forces in the prototype fishway. Consequently, in prototype fishway, the velocities fluctuations are characterized by large amplitudes, figure 8. In prototype fishway, low resistance, caused by viscous forces, are opposed to the inertia forces. Nevertheless, the periodic fluctuations are completely reproduced in prototype experiments. The same fluctuation period of 4.5 seconds are emphasizes both in model and prototype fishways.
(a) (b)
(c) (d)
Figure 6. Mean flow velocity components profiles. (a) Profile A, (b) Profile B, (c) Profile C, (d) Profile D.
(a) (b)
(c) (d)
Figure 7. Turbulence kinetic energy profiles. (a) Profile A, (b) Profile B, (c) Profile C, (d) Profile D
Large baffle influence Jet fluctuations Jet fluctuations Jet fluctuations Large baffle influence Large baffle influence
(a)
(b)
(c)
Figure 8. Time evolution of the u’ velocity fluctuation component at point P: (a) in model from ADV measurements, (b) in model from PIV measurements (b) in prototype from ADV measurements
4 DISCUSSION
The design of vertical slot fishways has progressed thanks to the reduced model studies, and to empirical feedback on the constructed facilities. Design optimization of vertical slot fishway is based on main fluid mechanics and hydrodynamics quantities criteria and is focused on average values, balance of upstream/downstream fishway mean flow features (average velocity in the slot, discharge curve, power dissipation per mass unit, etc …). The recent and ongoing studies continue to use physical hydraulic models, representing real-world prototypes using Froude similitude, as a practical tool for finding technically and economically optimal solutions. Particle Image Velocimetry (PIV) and Acoustic Doppler Velocimetor (ADV) measurements allow researchers to better understand the unsteady flow behaviour and turbulence features of the flow which are key parameters influencing the ability of fishes to move in pools, and to cross devices. However, improve the design of full scale facilities requires the knowledge of scale effects.
This paper describes and illustrates scale effects on mean flow and turbulence kinetic energy in vertical slot fishway flow, by measurements comparisons between a 1:4 model and a full scale acquisitions. Presented results emphasize significant differences on fluctuating velocity and turbulence kinetic energy values between full scale and model flow behaviours. Consequently, extrapolate optimization design based on flow average to fishes ascent efficiency could be performed if scale effects are corrected as regard of fluctuating velocities and if fish swimming limits against turbulent flows are known.
Future research is therefore needed to define relationships in order to avoid, to compensate or to correct significant scale effects in vertical slot fishway flow. The question of this future work is: how can we estimate fluid mechanics results on full scale vertical slot fishway from laboratory study? The answer can help us to performed design optimization of facilities in term of fish crossing efficiency, with knowledge of turbulence and unsteady flow parameters [11] and biological efficiency [3] carried out in laboratory model.
Acknowledgments
This work was supported by the “Office National de l'Eau et des Milieux Aquatiques” (ONEMA), “Voies
Navigables de France” (VNF) and the “European Regional Development Fund / Fonds européen de développement régional” (ERDF / FEDER). The authors would like to acknowledge the help of Mr Lestrade, “Société hydroélectrique et Immobilier du Sud” for the use of his power station.
REFERENCES
[1] Bermúdez M., Puertas J., Cea L., Pena L. and Balairón L. “Influence of pool geometry on the biological efficiency of vertical slot fishways”, Ecological Engineering,. Vol. 36, No. 10, (2010), pp1355 – 1364 [2] Calluaud D., David L., Pineau G., Texier A. and Larinier M. “Turbulence kinetic energy dissipation rate
estimation from PIV velocity fields: Application to the study of the flow in vertical slot fishways.” 34rd
IAHR Biennial Congress, Brisbane, Australia, (2011), N° 1631, pp 2768-2775
[3] Cornu V., Baran P., Calluaud D. and David L. “Effects of various configurations of vertical sot fishways on fish behaviour in an experimental flume.” 9th International Symposium on Ecohydraulics, Vienna, Austria, (2012)
[4] Hotchkiss R. “Turbulence investigation and reproduction for assisting downstream migrating juvenile
salmonids”, Part I; BPA Report DOE/BP-00004633-I, Bonneville Power administration, Portland, Oregon,
(2002)
[5] Liu M., Rajaratnam N. and Zhu D.Z. “Mean flow and turbulence structure in vertical slot fishways”,
Journal of Hydraulic Engineering, Vol. 132, No 8, (2006), pp. 765-777
[6] Odeh M., Noreika J.F., Haro A., Maynard A., Castro-Santos T. and Cada G.F. “Evaluation of the effects of
turbulence on the behavior of migratory fish”, Final Report 2002 to Bonneville Power Administration,
Portland, Oregon, USA, (2002)
[7] Pavlov D.S., Lupandin A.I. and Skorobogatov M.A. “The effects of flow turbulence on the behavior and distribution of fish”, Journal of Ichthyology, Vol. 40, No 2, (2000), pp. S232-S261.
[8] Puertas J., Pena L. and Teijeiro T. “An experimental approach to the hydraulics of vertical slot fishways”,
Journal of Hydraulic Engineering, Vol. 130, No 1, (2004), pp. 10-23.
[9] Rajaratnam, N., Katopodis, C., and Solanki, S. “New designs for vertical slot fishways”, Journal of
Hydraulic Engineering, Vol 19, No 3, (1992), pp. 402-414.
[10] Silva A.T., Santos J.M., Ferreira M.T., Pinheiro A.N. and Katopodis C. “Effects of water velocity and turbulence on the behaviour of Iberian barbel (Luciobarbus bocagei, Steindachner 1864) in an experimental pool-type fishway”, River Research and Applications,Vol. 27, No. 3, (2011), pp 360–373
[11] Tarrade L., Pineau G., Calluaud D., Texier A., David L. and Larinier M. “Detailed experimental study of hydrodynamic turbulent flows generated in vertical slot fishways”, Environmental Fluid Mechanics, Vol. 11, (2011), pp. 1-21.
[12] Wang R.W., David L. and Larinier M. “Contribution of experimental fluid mechanics to the design of vertical slot fish passes”, Knowledge and Management of Aquatic Ecosystems, Vol. 396, No 02, (2010), pp 1-21