O
pen
A
rchive
T
OULOUSE
A
rchive
O
uverte (
OATAO
)
OATAO is an open access repository that collects the work of Toulouse researchers and
makes it freely available over the web where possible.
This is an author-deposited version published in :
http://oatao.univ-toulouse.fr/
Eprints ID : 13905
To link to this article : DOI:10.1021/jp311896q
URL : http://dx.doi.org/10.1021/jp311896q
To cite this version :
Fukano, Masafumi and Fujimori, Toshihiko and Segalini, Julie and
Iwama, Etsuro and Taberna, Pierre-Louis and Iiyama, Taku and
Ohba, Tomonori and Kanoh, Hirofumi and Gogotsi, Yury and
Simon, Patrice and Kaneko, Katsumi Vertically Oriented Propylene
Carbonate Molecules and Tetraethyl Ammonium Ions in Carbon Slit
Pores. (2013) Journal of Physical Chemistry C, vol. 117 (n° 11). pp.
5752-5757. ISSN 1932-7447
Any correspondance concerning this service should be sent to the repository
administrator:
[email protected]
Vertically Oriented Propylene Carbonate Molecules and Tetraethyl
Ammonium Ions in Carbon Slit Pores
Masafumi Fukano,
†Toshihiko Fujimori,
‡Julie Ségalini,
§,∥Etsuro Iwama,
§,∥Pierre-Louis Taberna,
§,∥Taku Iiyama,
⊥Tomonori Ohba,
†Hirofumi Kanoh,
†Yury Gogotsi,
¶Patrice Simon,
§,∥and Katsumi Kaneko*
,‡†Graduate School of Science, Chiba University, 1-33 Yayoi-cho, Inage-ku, Chiba 263-8522, Japan
‡Research Center for Exotic Nanocarbons (JST), Shinshu University, 4-17-1 Wakasato, Nagano City 380-8553, Japan
§Centre Inter-universitaire de Recherche et d’Ingénierie des Matériaux, UMR CNRS 5085, Paul Sabatier University, 31062 Toulouse Cedex 4, France
∥Réseau National sur le Stockage Electrochimique de l’Energie (RS2E), FR CNRS 3459, France ⊥Faculty of Science, Shinshu University, 3-1-1 Asahi, Matsumoto, Nagano 390-8621, Japan
¶Department of Materials Science and Engineering, Drexel University, 3141 Chestnut Street, Philadelphia, Pennsylvania 19104, United States
ABSTRACT: We report the vertical alignment of propylene carbonate (PC) molecules interacting with Et4N+ and BF4−which are confined in extremely
narrow slit pores (w ∼ 0.7 nm) of carbide-derived carbon and pitch-based activated carbonfiber. On the basis of X-ray diffraction (XRD), electron radial distribution function analysis reveals that the nearest PC−PC distance is 0.05− 0.06 nm shorter than that in the bulk solution, indicating dense packing of PC molecules in the pores. This confinement effect results from the vertically aligned PC molecules, which are indicated by the reverse Monte Carlo analysis. The ensemble structure of PC molecules in the subnanometer carbon pores will provide better understanding the supercapacitor function.
INTRODUCTION
The global trend directed toward the decreasing the use of fossil fuels and nuclear energy has made the issue of safe storage of electric energy even more important than ever. There are nowadays two solutions for electrochemical energy storage: Batteries and supercapacitors that are complementary regarding their power/energy performance. In the case of supercapacitors, a marked increase in the capacitance has been achieved in the past few years.1−5Supercapacitor electrodes contain ions in the micropores of carbon, with the size slightly larger than the ion size. Therefore, “the ionic solution” in narrow carbon spaces should be different from the bulk solution. It has been recently shown that molecules and ions in carbon micropores may acquire different structures depending on the pore size. For instance, nanoscale crystalline structures can form in carbon micropores even above the melting temperature of the bulk solid.6,7 More recently, the high-pressure phase of KI, which needs 1.9 GPa for transformation from the ambient pressure phase, was observed in cylindrical single-walled carbon pores below 0.1 MPa.8 Extended X-ray absorption fine structure (EXAFS) analysis evidenced the presence of partially dehydrated alkali metal ions in the carbon micropores.9Thus, confinement of ions and molecules in nanoscale pores may induce their unusual arrangement. In case of the confinement
of neutral molecules, the attractive interaction originates from the dispersion interaction, and the interaction extent is limited in 1−2 nm for a small molecule such as N2. On the contrary,
electrostatic interaction is a longer range interaction, and the ion in the micropore can influence another ion at a larger distance than the size of the ion and the solvent molecules. Accordingly, the ionic solution structure in the carbon micropores can differ from the bulk ionic solution. Theoretical studies also have shown the necessity of improved under-standing of highly concentrated ions in the carbon pores.10−13 In our previous work, X-ray scattering was used for elucidating the structure of organic electrolytic solution constrained in carbon pores of 1.0 nm in the average pore width; the addition of bulky electrolytic ions in the organic solvent in the carbon pore spaces brought about a marked change in the solvent distribution.14Chmiola et al.15showed that even bulky organic cations could be accommodated in subnanometer scale carbon poresless than 1 nm in widthusing carbide-derived carbons (CDCs). Moreover, a slight decrease of the pore width only by 0.4 nm induced a more than 2-fold increase in the capacitance.
This indicates distinctly that the structure of confined organic molecules/ions is highly sensitive to the pore width in the subnanometer range. Consequently, there is a need to elucidate the structure of organic electrolyte in the subnanometer carbon pores to understand the molecular packing as the first step toward understanding the supercapacitor operation. In this paper, the distribution of Et4NBF4 and propylene carbonate (PC) molecules in porous carbons with pores of ∼0.7 nm is discussed. Here we used samples of CDC and pitch-based activated carbonfiber (ACF).
■
EXPERIMENTAL METHODSCDC and ACF were used after grinding in an agate mortar. The N2adsorption isotherms of CDC and ACF were measured
at 77 K volumetrically using automatic adsorption equipment after the preheating at 393 K and 1 mPa for 2 h. The surface area and microporosity of these carbon samples were determined from the N2adsorption isotherms.
X-ray photoelectron spectroscopy (XPS) spectra were measured using a monochromatized Al Kα X-ray source under 10−6Pa (AXIS-ULTRA DLD, Shimazu).
Nanoporous carbon sample was pretreated at 393 K and 1 mPa for 2 h, and then it was immersed in PC and 0.5 M Et4NBF4−PC solution. The PC and Et4NBF4deposited on the
external surface of the nanoporous carbon were evaporated at 373 K for 3 h under a N2flow of 100 mL min−1. The residual
amount of PC and/or Et4NBF4on the external surface was less than 10%, which was determined by thermal gravimetric (TG) analysis (Supporting Information, Figure S1).
The synchrotron X-ray diffraction (XRD) patterns of the solution-impregnated carbons and dry carbon samples were measured at 303 K by use of beamline BL02B2, SPring-8, where the wavelength of the incident X-ray was 0.1002 nm. Also the synchrotron XRD patterns of bulk PC and Et4NBF4−
PC solution were measured for comparison; the Lindemann glass capillary cell of 0.5 mm in diameter was used. The PC or Et4NBF4−PC solution embedded carbon was regarded as a three-phase mixed system consisting of molecules and/or ions in the pores, solid carbon, and vacant pore spaces. The necessary X-ray scattering from the interference term between adsorbed molecules in the pore was extracted according to the procedures given in the preceding papers.6,14
The reverse Monte Carlo (RMC) simulation was carried out using the XRD data on the interference term between molecules in the carbon pores after the correction procedures. The probable molecular arrangement was deduced, which
agreed with experimental XRD data after the above correction. Recent simulation studies have encouraged the use of a more realistic pore model.16−18However, a slit-shaped carbon model consisting of double graphene sheets was used for the RMC simulation, because the three-phase mixed system in the nonslit-shaped pore is too complex for simulation and the breadth of the graphitic wall units from XRD is about 3 nm (3.0 nm for CDC and 3.4 nm for ACF), indicating the interaction of molecules with theflat graphitic walls. As to PC and Et4NBF4, we used a fully atomistic model. We did not take into account contribution of surface oxygen atoms in the RMC procedure. A new configuration was generated in an RMC trial that was randomly chosen by moving (including rotation), inserting, and deleting a molecule. The ratio of the number of molecules of Et4NBF4and PC wasfixed in the calculation, being determined from the experimental conditions. The RMC simulation was repeated over 5 000 000 steps until there was no more improvement in the fitting between simulated XRD pattern and the experimental one. In this RMC, the atomic configuration of molecules in the pore was optimized and no molecular structural distortion was assumed.
■
RESULTS AND DISCUSSIONFigure 1 shows N2 adsorption isotherms of as-received CDC
and ACF at 77 K and their αs plots. Both isotherms are of
IUPAC type I, indicating that both carbons are microporous. Correspondingly, the high-resolution αs plots have a clear
upward swing belowαs= 0.5, indicating that both carbons have
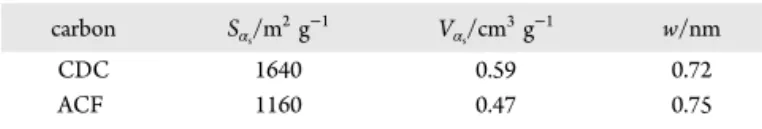
very narrow distributions of micropores of less than 1 nm in width.19We can determine precisely the specific surface area and micropore volume of both carbons using the subtracting pore effect (SPE) method,20 as listed in Table 1. The SPE
surface area of CDC is much larger than that of ACF, and thereby CDC should have thinner pore walls than ACF. The average slit pore widths of CDC and ACF are almost similar regardless of the great difference in the SPE surface area. The N2adsorption analysis evidences that both carbons are almost
ultramicroporous. The chemistry of pore walls of CDC and ACF was examined by XPS (see the Supporting Information).
Figure 1.N2adsorption isotherms of CDC and ACF at 77 K (a) and their high-resolutionαsplots (b).
Table 1. Parameters of Pore Structures of CDC and ACF
carbon Sαs/m 2g−1 V αs/cm 3g−1 w/nm CDC 1640 0.59 0.72 ACF 1160 0.47 0.75
The C1s XPS spectra of both carbons had a broader peak with a shoulder on the higher binding energy side, indicating the presence of surface oxygen groups. The C1s XPS spectra were deconvoluted assuming the following valence states of carbon: CC at 284.5 eV, C−C at 285.5 eV, C−O at 286.1 eV, CO at 287.0 eV, and COO− at 289.0 eV (Supporting Information, Figure S2).21 At the same time, O1s XPS spectra of both carbons were measured. The peak intensity ratios of O1s against C1s were 0.3 for CDC and 0.05 for ACF. The O/C ratios of the graphite crystals of Madagascar graphite, grafoil, and less crystalline graphite are in the range of 0.02−0.07 according to Ohba and Kaneko.22The surface oxygen content of CDC is considerably large owing to the very thin pore walls compared with ACF.
Figure 2 shows synchrotron XRD patterns of porous carbons, PC impregnated carbons, and PC electrolytic solution-impregnated carbons at 303 K. ACF has three broad peaks around 16.9, 30, and 52 nm−1, which are assigned to (002), (100) and (101), and (110) reflections of graphite. On the other hand, CDC has almost no peak around 14.9 nm−1, being an obscure shoulder; in-plane reflections are observed around 30 and 52 nm−1, being close to ACF. The XRD feature of CDC suggests the presence of extremely thin graphitic pore walls. Probably CDC has a single curved graphene-like wall structure, agreeing with the N2adsorption data and molecular dynamics
simulation.23,24 Also these structural features of CDC are in agreement with the previous studies.23,24The XRD patterns of PC-impregnated and PC electrolytic solution impregnated samples of CDC and ACF are similar to each other, and they have three peaks near the s values of ACF. However, the peak at the smallest s shifts slightly to a smaller value compared with those of the pure carbon, although CDC has a shoulder peak at the low s value. The most intense peak positions around s = 14−17 nm−1are summarized in Table 2. The right-side shift of the main peak of bulk PC and PC−Et4NBF4 solution is
observed by confinement of PC and PC−Et4NBF4solution for
both carbons. The peak position of PC and PC + Et4NBF4 confined in carbon pores is affected by the (002) reflection of carbon samples, and thereby we must correct the reflection by
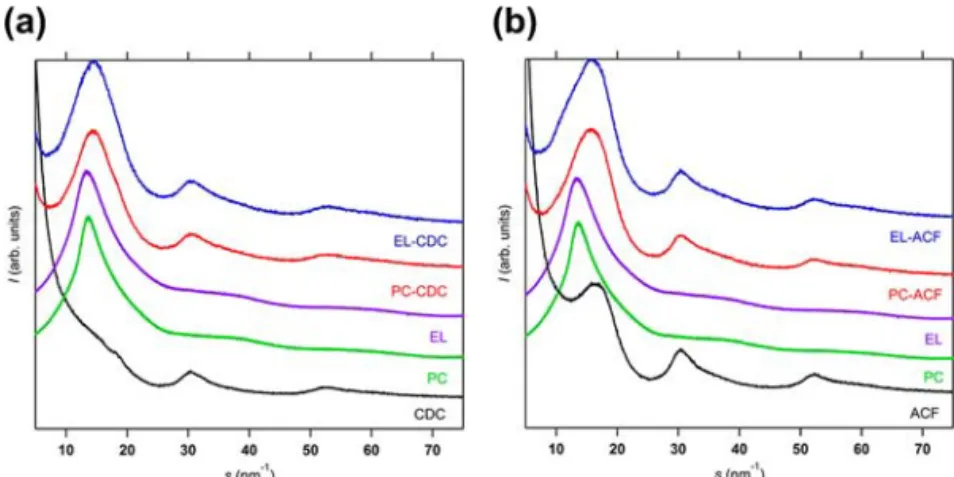
the carbon samples. Figure 3 shows the XRD patterns of PC and PC + Et4NBF4confined in carbon pores of CDC and ACF
after careful correction procedures.6,14 The XRD patterns of bulk PC and bulk Et4NBF4−PC solution are also shown for
comparison. The strong peaks around s = 14−15 nm−1 of confined PC and Et4NBF4−PC solution shift to the right
compared with those of bulk PC and the solution. In addition to the strong peak around s = 14−15 nm−1, confined PC and Et4NBF4−PC solution have very broad peaks around 31 and 55 nm−1, whereas it is quite difficult to observe the XRD peaks of the bulk PC and Et4NBF4−PC solution at the corresponding s-regions. Consequently, confined PC and PC + Et4NBF4should
have more ordered and closely packed structures than bulk PC liquid. This explanation can be explicitly shown by the electron radial distribution function (ERDF) analysis of these XRD patterns. Figure 4 shows the ERDFs of PC confined in pores of CDC and ACF, in comparison with bulk PC. Confined PC has a similar nearest-neighbor peak at about 0.48 nm, clearly shifted to a shorter distance by 0.05−0.06 nm compared with that of bulk PC. Also, the amplitude of the confined PC is larger than that of bulk PC. Ohba et al. evaluated the PC intermolecular structure in the carbon slit pore with grand canonical Monte Carlo (GCMC) simulation using a 13-centered model for a rigid PC molecule.25The simulation predicts both the shorter distance shift of the nearest-neighbor peak and enhancement of the amplitude for the confined PC molecules, as observed
Figure 2.XRD patterns of carbon, PC-impregnated carbon (PC-carbon), and Et4NBF4−PC-impregnated carbon (EL-carbon): CDC (a) and ACF
(b).
Table 2. Position of the Most Intense Peak (nm−1)
PC bulk EL bulk CDC ACF PC-CDC EL-CDC PC-ACF EL-ACF 13.6 13.5 14.9 16.9 14.5 14.6 15.8 16.1
Figure 3.Corrected XRD patterns of PC and Et4NBF4−PC confined
above. Therefore, PC molecules in pores are packed in a denser way than in the bulk PC. Also, the effect of confinement of PC molecules in the pores is observed in the long-range structure. The second nearest-neighbor peak (at about 1 nm) of the confined PC is shifted to a shorter distance as well. This shift also indicates a dense packing of PC molecules in the pore space. PC molecules in the pores of ACF have a sharper second peak than those of CDC, while the second peak of PC molecules in pores of CDC is very wide. Consequently, the carbon space of ACF leads to a considerably more ordered packing of solvent molecules than that in CDC; the pore space of CDC should be too narrow to construct the higher packing structure, even though the average pore width difference between ACF and CDC is only 0.03 nm. Thefine control of the pore width of ACF is more difficult than CDC, and thereby XRD analysis using a series of CDC samples having different pore widths must be carried out in future. Figure 5 shows the
ERDFs of Et4NBF4−PC and PC confined in the pores and the
bulk solution. The addition of Et4NBF4to PC does not change remarkably the ERDF of the bulk PC since the nearest-neighbor peak does not shift. However, a decrease of the amplitude of the nearest-neighbor peak is observed upon addition of the salt in the constrained solution, although such change is not observed in the bulk solution (Figure 2). This could stem from the less ordered packing of bulky Et4N ions. They can induce a partial disordering in the highly packed PC
molecular assembly in the pores. As PC is a polar molecule and the Coulombic interaction affects the intermolecular alignment of PC molecules, the above result can be also interpreted by the partial disordering of the PC molecular assembly through the local electrostatic interaction around ions.
Further insight of intermolecular structures in the absence and presence of Et4NBF4 could be obtained by the RMC analysis of XRD patterns, even though the RMC cannot provide a conclusive structure, but a plausible one. Figure 6a
shows an excellent agreement between the experimental and RMC-simulated XRD patterns of PC and Et4NBF4−PC
solution confined in pore of CDC. Snapshots of Figure 6, parts b and c, show an irregular structure with isolated Et4N+
ions which do not form ion pairs with BF4−. At the same time, we can see that PC and Et4N+molecules are vertically oriented
against the pore walls, as shown in Figure 6c. In these narrow pores of 0.7 nm width, the long axis of PC and Et4N+fits the
slit width of the pore. Therefore, an unusual vertical alignment of PC and Et4N+ leads to a denser packing. The molecular
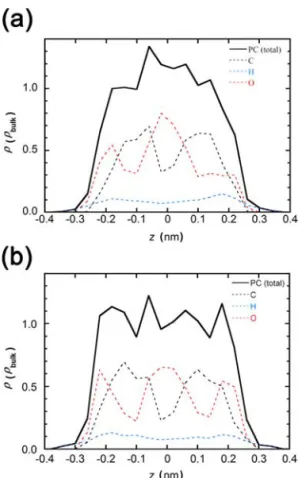
alignment in the pore can be better understood from the distribution of PC molecules and the component atoms of the PC molecule in the pore space through the snapshot analysis. Figure 7 shows such distributions for Et4NBF4−PC in the pore
of CDC and ACF. Here the pore wall is assumed to be a completely smooth basal plane of graphite, and thereby discerning of CDC and ACF is carried out by the different slit widths. Generally speaking, both distributions are very close to each other. Nevertheless we can notice that PC molecules are most distributed near the center in the smaller CDC pore compared with those in the wider ACF pore. The analysis of the atom distribution in the PC molecule can provide information on the orientation of the molecule. The PC molecule has three antisymmetrical oxygen atoms. Accordingly, a higher distribution of oxygen atoms and carbon atoms indicates the orientational direction of the PC molecule. Figure 8 shows two representative molecular orientation models of the PC molecule in the slit pore. One is standing up against the pore wall and another is parallel to the pore wall. Both orientations give completely different atomic distributions
Figure 4.Electron radial distribution functions of PC impregnated in pores of CDC and ACF, in comparison with bulk PC.
Figure 5.Electron radial distribution functions of PC, electrolyte PC solutions confined in pores, and the bulk electrolyte solution.
Figure 6.Agreement between the experimental and RMC-simulated XRD patterns (a) for PC and Et4NBF4−PC confined in pores of CDC
and top (b) and side (c) views of snapshots of Et4NBF4−PC solution
along the slit width direction. The atomic distribution from the snapshot agrees with the vertical orientation, if we allow two identical orientations in the slit space. Fundamental features of the vertical alignment are similar in the pores of CDC and ACF. PC molecules may be slightly tilted in the narrower pore of CDC, which should lead to the observed disordered second nearest-neighbor structure. The effect of addition of Et4NBF4
can be examined using the distribution of molecules as well, although we cannot discuss the orientation of Et4N+ ions
themselves, because the molecular number is too small for getting the average information. As the molecular shape of Et4N+is very different from that of PC, a partial disorientation
of PC molecules occurs, considering the decrease in the amplitude of the nearest-neighbor peak. However, still there are many vertically aligned PC molecules in the pore. Thus, PC molecules should have very unusual intermolecular interactions in the very small carbon pores of about 0.7 nm.
CONCLUSIONS
On the basis of ERDF and RMC analyses, we indicated the vertical alignment of PC molecules interacting with Et4N+and
BF4−which are confined in extremely narrow slit pores of CDC
and ACF. The nearest PC−PC distance is 0.05−0.06 nm shorter than that in the bulk solution, showing dense packing of PC molecules in the pores. It is essentially important that PC molecules can have the most dense assembly structure according to the nanoscale pore geometry. Future efforts should be directed toward unveiling the structure of the PC-based molecular assemblies confined in the subnanoscale pores under the electrical potential.
■
ASSOCIATED CONTENT*
S Supporting InformationTG analysis of EL-ACF and EL-CDC and XPS spectra of CDC and ACF. This material is available free of charge via the Internet at http://pubs.acs.org.
■
AUTHOR INFORMATIONCorresponding Author
*E-mail: [email protected].
Notes
The authors declare no competingfinancial interest.
■
ACKNOWLEDGMENTST.F. and K.K. were supported by Exotic Nanocarbons, Japan Regional Innovation Strategy Program by the Excellence, JST. The synchrotron experiments were performed at the BL02B2 of SPring-8 with the approval of the Japan Synchrotron Radiation Research Institute (JASRI) (proposal nos. 2011B1245, 2010A1601, 2009B1480, and 2009A1417). Y.G. and J.S. were supported by the Partnership University Fund (PUF). P.S. was supported by the Partnership University Fund (PUF) and the European Research Council (Advanced Grant No. ERC-2011-AdG, project no. 291543IONACES).
■
REFERENCES(1) Sheng, K.; Sun, Y.; Li, C.; Yuan, W.; Shi, G. Ultrahigh-Rate Supercapacitors Based on Electrochemically Reduced Graphene Oxide for AC Line-Filtering. Sci. Rep. 2012, 2, 247.
(2) Lang, X.; Hirata, A.; Fujita, T.; Chen, M. Nanoporous Metal/ Oxide Hybrid Electrodes for Electrochemical Supercapacitors. Nat. Nanotechnol. 2011, 6, 232−236.
(3) Mai, L.-Q.; Yang, F.; Zhao, Y.-L.; Xu, X.; Xu, L.; Luo, Y.-Z. Hierarchical MnMoO4/CoMoO4 Heterostructured Nanowires with
Enhanced Supercapacitor Performance. Nat.Commun. 2011, 2, 381. Figure 7.Distribution of PC molecule and the component atoms in
the PC molecule along the slit width of CDC (a) and ACF (b).
(4) Xie, X. N.; Lee, K. K.; Wang, J.; Loh, K. P. Polarizable Energy-Storage Membrane Based on Ionic Condensation and Decondensa-tion. Energy Environ. Sci. 2011, 4, 3960−3965.
(5) Pech, D.; Brunet, M.; Durou, H.; Hueng, P.; Mochalin, V.; Gogotsi, Y.; Taberna, P.-L.; Simon, P. Ultrahigh-Power Micrometre-Sized Supercapacitors Based on Onion-Like Carbon. Nat. Nanotechnol 2010, 5, 651−654.
(6) Iiyama, T.; Nishikawa, K.; Suzuki, T.; Otowa, T.; Hijiriyama, M.; Nojima, Y.; Kaneko, K. Molecular Assembly Structure of CCl4 in
Graphitic Nanospaces. J. Phys. Chem. B 1997, 101, 3037−3042. (7) Iiyama, T.; Nishikawa, K.; Suzuki, T.; Kaneko, K. Study of the Structure of a Water Molecular Assembly in a Hydrophobic Nanospace at Low Temperature with in situ X-Ray Diffraction. Chem. Phys. Lett. 1997, 274, 152−158.
(8) Urita, K.; et al. Confinement in Carbon Nanospace-Induced Production of KI Nanocrystals of High-Pressure Phase. J. Am. Chem. Soc. 2011, 133, 10344−10347.
(9) Ohkubo, T.; Konishi, T.; Hattori, Y.; Kanoh, H.; Fujikawa, T.; Kaneko, K. Restricted Hydration Structures of Rb and Br Ions Confined in Slit-Shaped Carbon Nanospace. J. Am. Chem. Soc. 2002, 124, 11860−11861.
(10) Merlet, C.; Rotenberg, B.; Madden, P. A.; Taberna, P.-L.; Simon, P.; Gogotsi, Y.; Salanne, M. On the Molecular Origin of Supercapacitance in Nanoporous Carbon Electrodes. Nat. Mater. 2012, 11, 306−310.
(11) Kondrat, S.; Kornyshev, A. A. Superionic State in Double-Layer Capacitors with Nanoporous Electrodes. J. Phys.: Condens. Matter 2011, 23, 022201.
(12) Kondrat, S.; Pérez, C. R.; Presser, V.; Gogotsi, Y.; Kornyshev, A. A. Effect of Pore Size and Its Dispersity on the Energy Storage in Nanoporous Supercapacitors. Energy Environ. Sci. 2012, 5, 6474−6479. (13) Huang, J.; Sumpter, B. G.; Meunier, V. Theoretical Model for Nanoporous Carbon Supercapacitors. Angew. Chem., Int. Ed. 2008, 47, 520−524.
(14) Tanaka, A.; Iiyama, T.; Ohba, T.; Ozeki, S.; Urita, K.; Fujimori, T.; Kanoh, H.; Kaneko, K. Effect of a Quaternary Ammonium Salt on Propylene Carbonate Structure in Slit-Shape Carbon Nanopores. J. Am. Chem. Soc. 2010, 132, 2112−2113.
(15) Chmiola, J.; Yushin, G.; Gogotsi, Y.; Portet, C.; Simon, P.; Taberna, P. L. Anomalous Increase in Carbon Capacitance at Pore Sizes Less Than 1 Nanometer. Science 2006, 313, 1760−1763.
(16) Bandosz, T. J.; Biggs, M.; Gubbins, K. E.; Iiyama, T.; Hattori, Y.; Kaneko, K.; Pikunic, J.; Thomson, K. T. Chemistry and Physics of Carbon; Marcel Dekker: New York, 2001; pp 41−228.
(17) Palmer, J. C.; Moore, J. D.; Brennan, J. K.; Gubbins, K. E. Adsorption and Diffusion of Argon in Disordered Nanoporous Carbons. Adsorption 2011, 17, 189−199.
(18) Nguyen, T. X.; Bhatia, S. K. Some Anomalies in the Self-Diffusion of Water in Disordered Carbons. J. Phys. Chem. C 2012, 116, 3667−3676.
(19) Setoyama, N.; Suzuki, T.; Kaneko, K. Simulation Study on the Relationship between a High Resolution αs-Plot and the Pore Size Distribution for Activated Carbon. Carbon 1998, 36, 1459−1467.
(20) Kaneko, K.; Ishii, C.; Ruike, M.; Kuwabara, H. Origin of Superhigh Surface Area and Microcrystalline Graphitic Structures of Activated Carbons. Carbon 1992, 30, 1075−1088.
(21) Utsumi, S.; Honda, H.; Hattori, Y.; Kanoh, H.; Takahashi, K.; Sakai, H.; Abe, M.; Yudasaka, M.; Iijima, S.; Kaneko, K. Direct Evidence on C-C Single Bonding in Single-Wall Carbon Nanohorn Aggregates. J. Phys. Chem. C 2007, 111, 5572−5575.
(22) Ohba, T.; Kaneko, K. Surface Oxygen-Dependent Water Cluster Growth in Carbon Nanospaces with GCMC Simulation-Aided in situ SAXS. J. Phys. Chem. C 2007, 111, 6207−6214.
(23) Palmer, J. C.; Llobet, A.; Yeon, S.-H.; Fischer, J. E.; Shi, Y.; Gogotsi, Y.; Gubbins, K. E. Modeling the Structural Evolution of Carbide-Derived Carbons Using Quenched Molecular Dynamics. Carbon 2010, 48, 1116−1123.
(24) Laudisio, G.; Dash, R. K.; Singer, J. P.; Yushin, G.; Gogotsi, Y.; Fischer, J. E. Carbide-Derived Carbons: A Comparative Study of
Porosity Based on Small-Angle Scattering and Adsorption Isotherms. Langmuir 2006, 22, 8945−8950.
(25) Ohba, T.; Kaneko, K.; Kanoh, H. Local Ordered Structure of Propylene Carbonate in Slit-Shaped Carbon Nanopores by GCMC Simulation. ISRN Nanotechnol. 2011, 2011, Article ID 708927, 5 pages.