To cite this document: DESCOMBES, Xavier. PLOURABOUE, Franck. EL BOUSTANI, Abdelhakim. FONTA, caroline. LEDUC, Géraldine. SERDUC, Raphael. WEITKAMP, Timm. Brain Tumor Vascular Network Segmentation from Micro-Tomography. In:Biomedical Imaging: From Nano to Macro, 2011 IEEE International Symposium, 30 March - 02 April 2011, Chicago, USA.
O
pen
A
rchive
T
oulouse
A
rchive
O
uverte (
OATAO
)
OATAO is an open access repository that collects the work of Toulouse researchers and makes it freely available over the web where possible.This is an author-deposited version published in: http://oatao.univ-toulouse.fr/
Eprints ID:5015
Any correspondence concerning this service should be sent to the repository administrator: [email protected]
BRAIN TUMOR VASCULAR NETWORK SEGMENTATION FROM MICRO-TOMOGRAPHY
Xavier Descombes
1, Franck Plourabou´e
2, Abdelhakim El Boustani
2,3, Caroline Fonta
4G´eraldine LeDuc
5, Raphael Serduc
5, Timm Weitkamp
5 ∗ 1INRIA/I3S, 2004 route des Lucioles, BP93, 06902 Sophia Antipolis Cedex, France
2
IMFT UMR 5502 CNRS/INPT/UPS, av. du Pr. Camille Soula, 31400 Toulouse, France
3
Ecole Nationale des Sciences Appliques de Tanger (ENSA), BP 1818, Tanger, Morocco
4
Univ. Toulouse, UPS, Centre de Rech. Cerveau et Cognition / CNRS, CerCo, 31410 Toulouse, France
5
ESRF, 6 rue Jules Horowitz, BP220, 38043 Grenoble Cedex 9, France
ABSTRACT
Micro-tomography produces high resolution images of bio-logical structures such as vascular networks. In this paper, we present a new approach for segmenting vascular network into pathological and normal regions from considering their micro-vessel 3D structure only. We define and use a condi-tional random field for segmenting the output of a watershed algorithm. The tumoral and normal classes are thus character-ized by their respective distribution of watershed region size interpreted as local vascular territories.
Index Terms— Segmentation, conditional random field,
micro-tomography, brain tumor
1. INTRODUCTION
High resolution micro-tomography provides an efficient imaging technique for the systematic 3D analysis of supra-cellular structures such as micro-vascular networks [1, 2]. Since the diameters of most capillary vessels are distributed between5 and 9 microns, micrometric spatial resolution is necessary for such a method to capture the entire vascular network.
Specific3-D images of vessel networks can be obtained from the injection of an X-ray contrast agent in various tis-sues [1]. It brings to the fore specific features of normal or pathological vessels, as for example in the brain [3]. To be more precise, tumorous vessels are large, irregular and tortu-ous, compared to normal ones in most tumors and organs. As opposed to classical microscopic studies, the scale of analy-sis in CT-volumes is different from single cell, thus providing important organizational level of information. At the millime-ter scale, the number of vessels is very important, so that it is not reasonable to perform manually any vessel segmentation. It is thus necessary to develop automatic segmentation meth-ods for a systematic, quantitative, reliable and differentiated
∗This research was supported by the ANR project “Micro-R´eseaux”.
investigation of normal and pathological networks. Such seg-mentation allows ultimately a detailed comparison between normal and pathological vessels with respect to their shape and spatial distribution as well as the determination of the angiogenic regions of a given tumor. A reliable automated segmentation would be of high interest because there is in-deed a growing evidence in the recent literature [4] that the maturation and maybe the normalization of tumoral vascu-lar networks may be related to the observed resistance of the brain tumors to various treatments [5].
In this paper, we propose a segmentation method adapted to normal/tumorous vessel networks. We consider binary vol-umes composed of a background and a 3D network repre-senting the vessels. The binarization is performed using an hysteresis thresholding (see [3]) and is robust since the to-mographic data are very contrasted. Our objective is to find a criterion to segment this network in two classes. From a careful inspection of the obtained image of vessels, it is clear that in the tumoral region the vessels are larger, very irregular, with complex shape quite different from the smooth elongated cylinders observed in normal regions. This observation sug-gests that vessel shape could be used to distinguish normal and pathological regions. Nevertheless, the automatic skele-tonization of the vessels is very time consuming. Further-more the quality of this skeletonization largely depends on the vessel smoothness (the thinning step of most skeletonization procedures is not robust when irregular shapes are present). Hence, it is neither easy nor computationally efficient to use vessel shape as a segmentation criteria. Fortunately another important property of tumorous vessels can be observed : the vessels in the tumor are further apart from each other [3]. The local vessel territories can thus be used for segmenting the vessel network.
We therefore quantify this sparsity for segmenting the net-work as being the main differentiating structural property. We first partition the volume into regions associated to local vas-cular territories using a watershed algorithm. Then we seg-ment the full partitioned volume based on the size of each
partitioned 3D region, which exhibits different distribution in normal and pathological tissues. The different steps of the methods are detailed in section 2.
To segment the partitioned volume, we consider the graph where each vertex represents a region and edges are defined between adjacent regions. We show that the watershed region distribution follows a power-law tailed Pareto law leading to noisy segmentation when considering a maximum likelihood estimator. We therefore regularize the solution by introducing a conditional random field, detailed in section 3. Finally, the segmentation results are described in section 4.
2. METHOD
We start with binarized volumes (micro-vascular networks images are highly contrasted and easy to binarize). A dataset consists of several sub-volumes, which may have different sizes. For segmenting the entire volume, we consider the fol-lowing steps:
Closing- On each sub-volume, a closing with a ball as a struc-turing element is applied. The radius of the ball is4 voxels. This pre-processing step aims to repair vessels which may have been split into different connected components during the binarization process. The closing step cleans the data for the next step.
Down-sampling- We then merge the different sub-volumes. However, in order to restrain the need for memory allocation, we have to down-sample the different sub-volumes. We as-sociate a single voxel to each3 × 3 × 3 cube of the initial data, before merging the sub-volumes. To avoid disconnect-ing vessels, we assign value1 (vessel) to each voxel in the down-sampled volume for which at least one of the voxels on the corresponding cube at the initial resolution belongs to vessels.
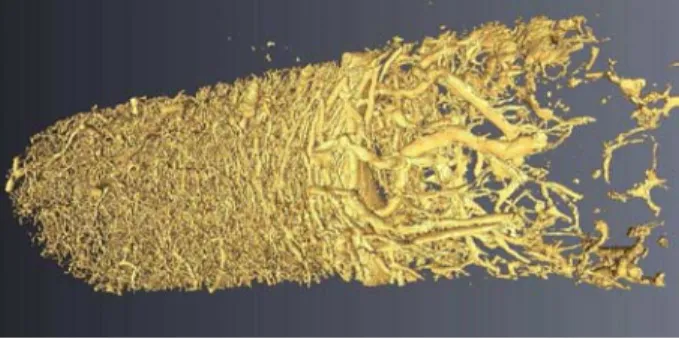
Registration and merging- The merging step is performed by registering the sub-volumes. We only have to estimate a translation vector between two overlapping sub-volumes. This vector is computed by maximizing the number of com-mon voxels marked as vessels. An example of a full volume is shown on figure 1
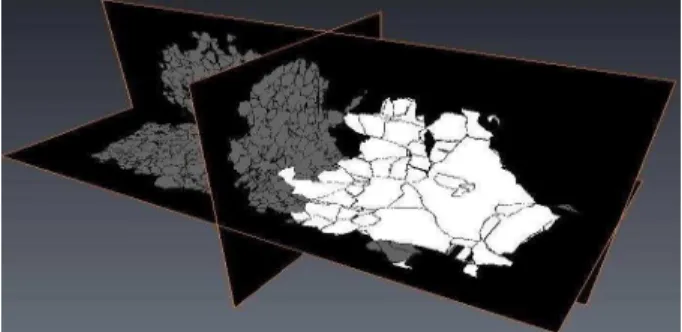
Distance map- A distance map is computed from calculating the Euclidean distance in 3D from each nearest vessel. Watershed- We compute the watershed of the inverse of the distance map, shown on figure 2. The result is displayed on figure 3. Since it is expected that the tumor is surrounded by vessels, the vessels are localized on the boundaries of water-shed regions.
Labeling- We label the watershed regions into tumor and non tumor areas. We develop an original model based on a Condi-tional Random Field on a graph which is detailed in section 3. The segmentation obtained is shown in figure 4.
Fig. 1. volume rendering of the full volume of data after the merging step
Fig. 2. Distance map to any vessel
3. A CONDITIONAL RANDOM FIELD ON THE WATERSHED GRAPH
In this section, we detail the graph labeling algorithm based on a Conditional Random Field (CRF) that we propose for segmenting the tumor.
We consider a graphG, derived from the partitioned vol-ume issued from the watershed algorithm. Each region of the watershed result is considered as a vertexi if it is not con-nected to the volume boundary. The set of vertices is denoted byI. The edges are defined by the following neighborhood relation: i ∼ j if and only if i and j correspond to two con-nected regions.
We label the graph G by gi = 1 for tumor regions and
gi = 0 for non-pathological regions. The resulting
informa-tion is the region sizesi and some prior knowledge on the
connectivity of the tumor. To embed these two informations into a single model we consider a binary Conditional Ran-dom Field on the graphG. Conditional random fields can be seen as an extension of the standard Markov Random Field approach based on the Bayes formalism [6, 7]. The posterior is directly modeled instead of defining it through the product of a prior and a likelihood. In our context, this allows normal-izing the weight of the data term and the interaction potentials independently of the local topology of the graph.
Fig. 3. Watershed on the distance map opposite
Fig. 4. Segmentation: tumor (white) and normal tissue (grey)
3.1. Likelihood definition
To define the likelihood we consider two sub-volumes,Vtand
Vs, corresponding to tumor and normal tissues respectively.
The empirical volume distribution of both classes exhibits a heavy tail behavior. Consistently, the log-log histograms dis-play a linear behavior leading to Pareto parameters estima-tion. We successfully tested the Pareto distribution hypothesis using the Kolmogorov-Smirnov test, (p = 0.06 for the empir-ical tumor volume distribution andp = 4.10−8 for normal
tissue).
Therefore, we consider the following likelihood : ½ p(si|gi= 1) = βts−αi t ifsi< mint p(si|gi= 1) = 0 otherwise (1) and ½ p(si|gi= 0) = βss−αi s ifsi< mins p(si|gi= 0) = 0 otherwise (2) where αt, βt (resp. αs, βs) are the parameters of the
likelihood of tumor (resp. normal tissue). The minima are obtained through normalization of the distributions to1, i.e. min = ((α − 1)/β))−α1+1. To estimate these parameters, we
first discretize the volume space on the logarithm scale and then apply a linear regression in the log-log domain. On the considered volumes, the regression givesαs = 2.909 and
log(βs) = 16.05 for the normal tissue and αt = 1.791 and
log(βt) = 5.174 for tumor. Let us consider the maximum
classification shown in figure 5. The two classes are obvi-ously mixed due to the overlapping between the tumor and normal class distributions. Moreover, the heavy tail of the normal class distribution is under the tumor class distribu-tion, so that the tumor class tends to be overestimated by the maximum likelihood estimator. Therefore, a local filter is not sufficient to de-noise the maximum likelihood segmentation but a global model is necessary to regularize the result.
Fig. 5. Maximum likelihood using Pareto distributions
3.2. Posterior distribution
To regularize the solution, we consider a generalization of the Ising model [8]. Here we have to take into account two dis-tinct properties. First, the number of neighbors of a given ver-tex is not constant. Besides, the size of neighbor region is also spatially variable. Therefore, we extend the Ising model by considering an attractivity property proportional to the contact surface between two regions as proposed in [9]. Therefore, small regions have a low impact on their neighbors. However, using this principle, the weight of the regularization term with respect to the data term depends on the size of the region. This may prevent regularization for small regions. Besides, the likelihood defined by Pareto distribution is equal to zero for small regions. To overcome this problem we consider a Conditional Random Field by directly addressing the poste-rior as follows P (G = g|s) = 1 Z exp −β X {i,j}:i∼j Surf(i, j)δgi6=gj −X i X j:j∼i Surf(i, j)f(log(p(si|gi))) , (3)
whereSurf(i, j) is the contact surface between regions i and j and: f (log(p(si|gi))) = ½ log(p(si|gi)) ifp(si|gi) 6= 0 M otherwise (4) We maximize the posterior with a Metropolis dynamic em-bedded into a simulated annealing scheme [8].
4. RESULTS
We consider real intra-cortical images obtained using syn-chrotron tomography imaging at the European Synsyn-chrotron Radiation Facility (ESRF) [1, 10]. They consist of rat brain implanted with 9L gliosarcoma cells. The resolution is about one micron and a dataset represents about 8mm3. The
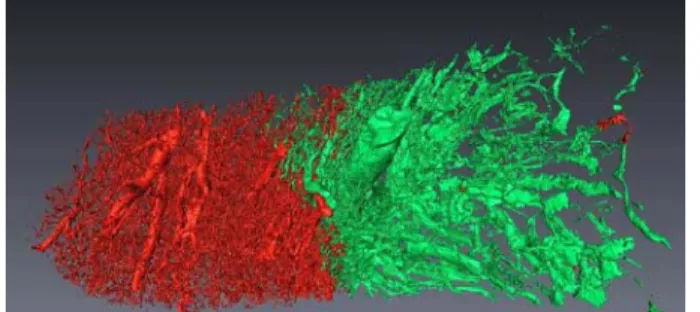
re-constructed image is first binarized using hysteresis thresh-olding and mathematical morphological open/closure proce-dures. The segmentation result obtained forβ = 5, is shown on figure 6. The tumor segmentation in green corresponds to the experts expectation. It can provide statistical information about the vascular network characteristics. First, we can more precisely evaluate the Pareto distribution parameters. We ob-tainαs = 3.089 and log(βs) = 18.79 for the normal tissue
andαt = 1.524 and log(βt) = 3.420 for tumor. This new
estimation is stable when performing a new segmentation us-ing these parameters. We also show the difference between the two vascular networks by computing the vessel diameter histograms (see figure 7,H0hypothesis rejected with p-value
2.2e − 16 using KS test) and the average vessel density (4.7% of vessel voxels for normal tissue versus7.4% for tumor). Similar results have been obtained on six volumes represent-ing a tumor at different stages. We are currently conductrepresent-ing a statistical study.
Fig. 6. Result: normal tissue (red) and tumor (green) (β = 5)
Fig. 7. Vessel diameter distribution, in micron, for normal tissue (left) and tumor (right)
5. CONCLUSION
In this paper, we have proposed a new approach for the seg-mentation of vascular networks, consisting of a CRF segmen-tation based on the watershed graph of the vessel tree. We
have shown that this methods permits to segment tumourous and normal brain vascular networks. We found that both re-gions exhibit different statistical properties (vascular density and vessel diameter). In future work, we can extend this seg-mentation to a larger number of classes, as for example being able to evaluate tumor necrotic regions or hyper-vascular hot spots at the tumor border.
6. REFERENCES
[1] F. Plourabou´e, P. Cloetens, C. Fonta, A. Steyer, F. Lauw-ers, and J. Marc-Vergnes, “High resolution x-ray imag-ing of vascular networks,” J. Microscopy, vol. 215, no. 2, pp. 139–148, 2004.
[2] J. Reichold, M. Stampanoni, A.L. Keller, A. Buck, P. Jenny, and B. Weber, “Vascular graph model to sim-ulate the cerebral blood flow in realistic vascular net-works,” J. Cer. Blood Flow and Metab., vol. 29, pp. 1429–1443, 2009.
[3] L. Risser, F. Plourabou´e, A. Steyer, P. Cloetens, G. Le Duc, and C. Fonta, “From homogeneous to fractal normal and tumorous micro-vascular networks in the brain,” J. Cer. Blood Flow and Metab., vol. 27, pp. 293– 303, 2007.
[4] R.K. Jain, “Normalization of tumor vasculature : an emerging concept in angiogenic therapy,” Science, vol. 307, pp. 58–62, 2005.
[5] R. Gr´epin and G. Pag`es, “Molecular mechanisms of re-sistance to tumour anti-angiogenic strategies,” J. of
On-cology, 2010.
[6] J. Lafferty, A. McCallum, and F. Pereira, “Conditional random fields: probabilistic models for segmenting and labeling sequence data,” in Proc. 18th ICML, 2001, pp. 282–289.
[7] S. Kumar and M. Hebert, “Discriminative random fields,” Int. J. Computer Vision, vol. 68, no. 2, pp. 179– 201, 2006.
[8] S. Geman and D. Geman, “Stochastic relaxation, Gibbs distributions, and the Bayesian restoration of images,”
IEEE Trans. on PAMI, vol. 6, pp. 721–741, 1984.
[9] T. G´eraud, J-F. Mangin, I. Bloch, and H. Maˆıtre, “Seg-menting internal structures in 3d mr images of the brain by markovian relaxation on a watershed based adja-cency graph,” in Proc. 18th ICIP, 1995, vol. 3, pp. 3548–3552.
[10] T. Weitkamp, P. Tafforeau, E. Boller, P. Cloetens, J.-P. Valade, P. Bernard, F. Peyrin, W. Ludwig, L. Helfen, and J. Baruchel, “Status and evolution of the esrf beamline id19,” in Proc. AIP Conf., 2010, vol. 1221, pp. 33–38.