HAL Id: hal-01988039
https://hal-mines-albi.archives-ouvertes.fr/hal-01988039
Submitted on 21 Jan 2019
HAL is a multi-disciplinary open access
archive for the deposit and dissemination of
sci-entific research documents, whether they are
pub-lished or not. The documents may come from
teaching and research institutions in France or
abroad, or from public or private research centers.
L’archive ouverte pluridisciplinaire HAL, est
destinée au dépôt et à la diffusion de documents
scientifiques de niveau recherche, publiés ou non,
émanant des établissements d’enseignement et de
recherche français ou étrangers, des laboratoires
publics ou privés.
A Tentative Framework for Risk and Opportunity
Detection in A Collaborative Environment Based on
Data Interpretation
Frederick Benaben, Benoit Montreuil, Juanqiong Gou, Jiayao Li, Matthieu
Lauras, Ibrahim Koura, Wenxin Mu
To cite this version:
Frederick Benaben, Benoit Montreuil, Juanqiong Gou, Jiayao Li, Matthieu Lauras, et al.. A Tentative
Framework for Risk and Opportunity Detection in A Collaborative Environment Based on Data
Interpretation. HICSS 52 - 52nd Hawaii International Conference on System Sciences, Jan 2019,
Maui, Hawaii, United States. 10 p. �hal-01988039�
A tentative framework for risk and opportunity detection in a collaborative
environment based on data interpretation
Frederick Benaben1
Benoit Montreuil2
Juanqiong Gou3 1IMT Mines Albi, France
([email protected]) Jiayao Li3&1 Matthieu Lauras1 2Georgia Institute of Technology, USA ([email protected])
Ibrahim Koura1&3
Wenxin Mu3
3Beijing Jiaotong University,
China
Abstract
This article deals with the question of risk and opportunity identification based on data management as one main step of the convergence of artificial intelligence and industrial engineering. Two main subjects are addressed in this article: (i) the data management framework that could be the backbone for the whole approach, and (ii) the modeling theoretical background that could be used as a basement for the definition of a formal system for risk and opportunity modeling. The general principles presented in the article are used to define outlooks and to organize them as milestone of a roadmap.
1. Introduction
Nowadays, organizations (companies, public services, associations, etc.) are actually catching
obvious opportunities and escaping obvious risks
thanks to the experience of their managers and decision-makers. The objective of the approach presented in this article is to increase the mindfulness of decision makers by providing them with (i) a vision of an invisible world (the risks and opportunities around them), and (ii) an analysis of the potential ways to benefit from this surrounding environment to reach their goals. As a consequence, decision makers should be able to catch more hidden opportunities and to escape more risks. Figure 1 illustrates the objective of this approach. The trajectory of any organization, in terms of capability to perform its missions, can thus be influenced and basically improved by providing the decision makers with a more accurate visibility.
The main objective of this article is to clarify the vision of a formalized and structured way to use contextual data for the purpose of decision-making. This is a very basic objective, however, it aims at answering two main questions: (i) what does “use of
data” mean exactly? And (ii) how can data be formally used for risk and opportunity detection?
Figure 1. Concrete objective of the approach about the management of organizations.
The previous Figure 1 illustrates the general idea regarding the trajectory of organizations in a world of risks and opportunities. Roughly speaking, it also provide a simple vision of concepts such as “resilience”, “fragility” and “antifragility” close to the definition provided in [1] and [2].
The article is structured as follows. Section 2 is dedicated to give an overview of existing contributions that help to answer both the previous questions and support the establishment of a theoretical framework for those questions. Section 3 describes the main objectives of the theoretical approach and how could data be used to settle an exploitable picture of a contextual situation, to support decision-making. Section 4 details constraints and expectations of that theoretical vision, defining avenues to actually build the described system of thought. Finally, section 5 is a conclusion.
2. Related works
2.1. The usage of data
In computer science, the distinction between data,
information and knowledge has been widely debated.
Proceedings of the 52nd Hawaii International Conference on System Sciences | 2019
URI: https://hdl.handle.net/10125/59742 ISBN: 978-0-9981331-2-6
[3] gives the following visions: “Data are symbols
that represent properties of objects, events and their environments. They are products of observation”,
“information is referred from data, it is contained in
descriptions, answers to questions that begin with such words as who, what, where, when and how many” and finally, “Knowledge is conveyed by instructions, answers to how-to questions”.
More recently, [4] precisely distinguishes these terms: “Data consists of discrete, objective facts
about events but nothing about its own importance or relevance; it is raw material for creating information” while “Information is data that is organized to make it useful for end users who perform tasks and make decisions” and “Knowledge is broader than data and information and requires understanding of information (information about information, such as who has created the information).”
Finally, in the domain of command and control, [5] shows that the notion of common operational
picture, as defined by [6], obliges to put data into
context, which leads to information instead of data. Then, software systems (e.g. service-oriented web-based infrastructures or intelligent software agents) allow the use of the obtained models for analyzing, monitoring the situation and finally support decision, which is the illustration of knowledge. Consequently, and based on the elements, this paper will use the following definitions:
• Data: formalized observation of the world. • Information: result of the interpretation of data
through the instantiation of conceptual references.
• Knowledge: result of the exploitation of
information through dedicated processing mechanisms.
The collect of data provides raw observations of the considered situation, which is the delimited part of the world that is actually studied (e.g. 12°C is a
data) – Actually, this “data layer” must include for instance detection and trust considerations that will not be considered in this article (the hypothesis is “let’s assume the data is coming”) – Fusion,
combination, sense making and intelligence are used to interpret this data in order to create information as instances of semantic concepts (e.g. 12°C, Atlanta,
18th of July may provide the information “there may be a summer rain” which is actually a Risk).
Analysis, processing and treatments are then used to exploit this information to create knowledge, which is context dependent and will help to take decisions and perform actions (e.g. let’s take an umbrella).
Figure 2 introduces the KID (Knowledge / Information / Data) Framework. It can be considered
as a refinement of the DIKW (Data / Information / Knowledge / Wisdom) pyramid presented in [7].
Figure 2. The overall KID framework.
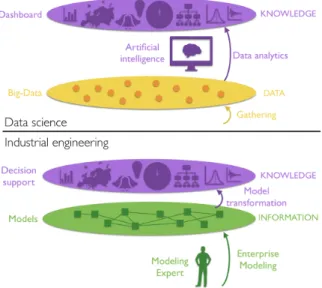
About the idea of data usage to furnish information, two domains can be considered: At the intersection of industrial engineering and data
science there is the aim of providing organizations
with a way to drive efficiently and relevantly their activities with regards to internal and external events.
Industrial engineering mainly uses enterprise modeling [8] as the reasoning material for this
purpose while data science focuses on data analytics [9] to define dashboards and tentatively reach the same purpose.
Considering first industrial engineering, [10] describes the objective of enterprise modeling as follows: (i) managing complexity by understanding the enterprise structure and operations; (ii) supporting enterprise engineering and continuous improvement; (iii) capitalizing enterprise knowledge and know-how; and (iv) controlling and monitoring enterprise operations. Finally, enterprise modeling mainly uses expert modelers to create (based on dedicated approaches and associated metamodels) models that can then be exploited to provide decision support about the trajectory of the organization. Lower part of Figure 3 illustrates this Enterprise modeling statement in the KID framework of Figure 2.
Considering data science, [11] describes the notion of “Big Data analysis pipeline” which is based on two main phases: Data management and Data
analytics. Data management includes Acquisition, Information extraction and Data integration and representation. Data analytics includes Analysis and Interpretation (The meaning of the word
“interpretation” is different from the one of Figure 2: [11] clearly states that “interpretation” means: “a decision-maker, provided with the result of analysis, has to interpret these results”). It is easy to draw the line between this vision of Big Data and the philosophy described on Figure 2. The first step (data management) is dedicated to collect and organize data (i.e. fill in the data layer of Figure 2) while the second step (data analytics) aims at providing the user with visualization that may be interpreted by
him. Actually, the Analysis stage of data analytics is dedicated to perform “detection of frequent patterns and correlations to obtain general statistics”, which is basically what is expected at the knowledge layer of Figure 2. The upper part of Figure 3 illustrates this
Data analytics vision in the KID framework.
Figure 3. Specificities of Data Analytics (up) and Enterprise Modeling (down) in the KID
framework.
As it can be extracted from the previous Figure 3 there are drawbacks to both these approaches. Data
analytics performs pattern detection, or
classification, or clustering, or other data treatments
but all of these treatments, if able to deal with an “open data world’ (meaning potentially unknown data types), are not able to provide “open exploitation” (meaning unexpected or ad-hoc exploitation), it is about predefined actions.
Enterprise modeling, thanks to the use of models, is
able to perform appropriate and specific treatments; however, the modeling step is mainly manual. As a consequence, the vision described in this paper basically aims at working on bridging the gap between both these research domains: In continuity with previous work [12], the ambition is to use data analytics to build situation models (relevant and meaningful about observed organizations in their ecosystems) and to exploit those models to design dashboards that would be used to support decision-making (about risks and opportunities) and trajectory management (how to escape risks and benefit from opportunities). The purpose is to provide a way to interpret data about organizations and their environment while making the generated information formalized enough for computed exploitation. This exploitation is dedicated to contribute to the
management of enterprises and networks of enterprises. The following Figure 4 illustrates this general ambition:
Figure 4. The detailed KID framework.
The general principle of interpretation as the usage of a knowledge base and a metamodel has been presented in [13]. This work mainly used static interpretation rules. Exploitation to infer appropriate behavior as collaborative business process models has been presented in [14]. These results are mainly based on model-driven engineering [15] principles and model transformation mechanisms [16]. There are mainly two real limitations to this vision:
• Operational limits: Obviously, the use of static
interpretation rules and the focus on the deduction of collaborative business process models are actually curbing this work. First, this implies that this approach only can interpret data according to predefined schemas (of course, these schemas can be updated on-the-fly but they still must be defined, based on experts inputs). Second, the only exploitation benefit that has been studied and implemented so far is the automated generation of collaborative business process models (this is relevant but other exploitation at the knowledge level should be considered).
• Theoretical limits: The whole approach has
been built as a strong, concrete and incremental structure; time after time, stacking the results one upon the other. A lot of efforts have been made for this capitalization and continuous integration of results over the last fifteen years. However, no real “theoretical study” has been performed regarding the obtained edifice as a whole in order to explain and legitimate the results as a complete theoretical system of thought.
2.2. Risk and opportunity detection
This article claims that risks and opportunities are the same concepts. As discussed in [17], Opportunity is the opposite of Risk but practices mainly focus on risk detection. In this sub-section, the concept of risk will be studied from the literature to provide guidelines for risk and opportunities characterization. According to [18], risk can be considered as the combination of the probability of occurrence and the impact of hazard. This is a very classical two dimensions representation of risk (probability VS. impact). This vision can also be extended to opportunity as presented on Figure 5:
Figure 5. Classical two dimension representation of Risk (and Opportunity).
However, the idea of the risk being considered as the combination of the probability of occurence and the impact of hazard also shows two interesting concepts: occurrence and hazard. In addition, [19] indicates that risk can be seen as based on three essential components: (i) a driver or danger which induct the risk; (ii) an event with probability of occurrence of the risk; and (iii) a consequence resulted from the occurrence of the risk on susceptible assets. Finally, [20] presents a structure for the description of a dependency chain based on the Danger / Risk / Consequence chain (DRC chain). This DRC chain can be extended to include favorable
condition (as the positive reflect of danger) to
describe Opportunity as well. The following Figure 6 illustrates this dependency chain:
Figure 6. The extended DRC chain.
By considering the existing works on the domain of Risk Management, analogies can be done to extend the results to Risk and Opportunities. Specifically, the research works about risk identification can be considered to structure risk and opportunity detection. Basically, the approach on risk identification mainly focuses on literature review, semi-structured interview, questionnaire and other experience-based methods ([20] and [21]). Consequently, the following statements can be made: • The model used for classical Risk representation
(impact VS. probability) is somehow simple and hard to exploit for cascading effect anticipation. • There is no real Risk identification approach,
except based on human deep involvement, such as reviews, interviews and questionnaires. The envisaged approach focuses on the continuous use of data to create models representing risks and opportunities. It is intended to draw the line between data management and risk identification by surpassing the usual warning and pattern detection.
3. Overview of the objectives
The aim of the approach consists in developing a sound theoretical framework for data interpretation to (i) identify risks and opportunities within an ecosystem of organizations and (ii) provide support mechanisms to tune trajectories for organizations within this risks and opportunities space.
Basically, the idea is to tackle the operational and
theoretical limits identified at the end of section 2.1.
The chosen approach is to analyze and exploit the structured set of contributions and results from the field of collaborative networks to build the theoretical framework that will allow to formalize, generalize and systematize the interpretation and exploitation stages (i.e. to climb the abstraction layers from data to knowledge to provide an efficient and effective dashboard for enterprise management). In short, the chosen approach is to try to tackle the operational
limits by tackling the theoretical ones.
Roughly speaking, the expected result can be described as follows on the two transitions identified above (interpretation and exploitation):
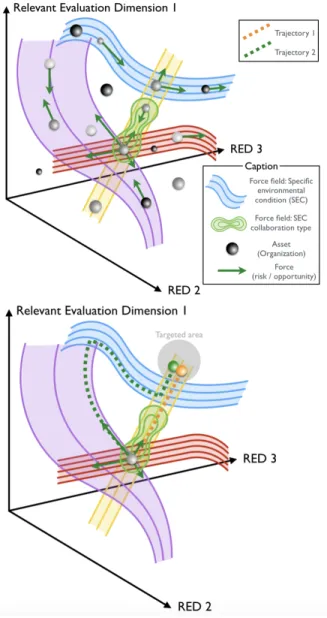
About interpretation first, the collected data (reminder: the gathering, filtering and cleaning of data is out of the scope of this article; the data is supposed to be relevant and trustable, which is obviously a hard hypothesis) is used to identify: • The relevant evaluation dimensions (so-called
RED on Figure 7): These dimensions represent the most appropriate evaluation criteria for the considered and observed system (e.g. from KPI).
• The specific environmental conditions (so-called SEC on Figure 7): These conditions represent the “force fields” in which organizations are immersed (some due to economic, legal or cultural characteristics of the environment and some due to existing collaborations and relationships between organizations).
• The present organizations (so-called Assets on Figure 7): These assets represent the enterprises that are in the considered ecosystem. They are described according to characteristics and attributes that are consistent with the evaluation dimensions mentioned above.
• The susceptibility identification mechanisms (SIM not on Figure 7): these mechanisms are dedicated to identify which assets are sensitive to which specific environmental conditions and to define the value of the undergone forces (risks and opportunities on Figure 7).
The analogy that can be used is force fields: Relevant evaluation dimensions allow identifying different types of force fields. For instance, if we aim at guiding an organization (resp. a spaceship), we may be interested in its critical attributes (resp. speed, location, radiation, temperature, etc.). Consequently we will consider the associated force fields (resp. gravitational fields, magnetic fields, etc.). Then, each specific environmental condition can be considered as a proper force field that has at any given point a direction and a magnitude that must be characterized. Similarly, each organization (resp. spaceship) can be considered as an element that is potentially sensitive to the force field (resp. the magnetic sensibility of the spaceship equipment). Consequently, not only should every asset be characterized with regards to the environing force fields but also the specific susceptibility of each and every asset should be determined (e.g. equivalent to the “Lorentz force” for a charged particle in an electromagnetic field).
About exploitation, the obtained models of forces and organizations are used to define:
• Causal chains based on what consequences would some events have on the current location of an organization with regards to the undergone forces. Events could be external events (from the environment) or internal events (decisions and actions of the observed organization).
• Potential paths that one organization could follow (i.e. decisions to take and actions to perform) to reach a target area (with regards to the relevant evaluation dimensions) by using the identified forces (risks and opportunities) exerted on that organization (dash lines on Figure 7).
The analogy that can be used is the travel of spaceships among gravitational fields. Trying to reach some specific location in space, a spaceship could try to go straightforward to that point, using its engine and fuel. However, due to the gravitational fields and the generated forces, this strategy would be exhausting and fuel consuming. Obviously, spaceships use gravitational fields to have longer and more intricate trajectories that are finally more efficient. The engine (actions of the organization) and fuel (resources) are actually used only to optimize the usage of gravitational forces.
The following picture illustrates both these levels (interpretation and exploitation).
Figure 7. Risk and opportunity identification (interpretation phase) for trajectory
definition (exploitation phase).
The upper part of Figure 7 presents the expected result for the interpretation phase: force fields, forces and organizations in significant dimensions. The lower part of Figure 7 describes the expected result of the exploitation phase: suggested trajectories based on the analysis of the models obtained through interpretation.
The previous considerations may be summarized from another perspective: the climbing of the KID framework abstraction layers requires to characterize
organizations and environmental conditions to infer
potential risks and opportunities resulting of the projection of the faced conditions onto the specific profile of organizations. The left part of Figure 6 illustrates this interpretation transition from data to
information. Then, on the right part of Figure 6, the
identification of potential events allows deducing
consequences that may appear if the events occur on
the identified risks and opportunities. The analysis of these consequences in the light of the expected
objectives (targeted area in the evaluation dimensions) should permit to design optimal trajectories for organizations with regards to their expectations. Besides, these consequences should
also be used as input to update organizations,
conditions and events models.
Figure 8. From the characterization of organizations and conditions to the identification of accurate trajectories.
There is one important restriction that must be mentioned and that it will be necessary to consider: Focusing on one organization (for the definition of its appropriate trajectories) will also imply to take into account the other organizations in a significant perimeter. Interactions are obviously at the core of this project and even if the previous considerations are describing the approach for one organization, it is necessary to consider an organization in its complete living environment, making it a fluid context with changing conditions and forces. This restriction should be kept in mind and will be studied as well.
4. Hypotheses and expectations
The envisaged methodology is based on the analysis of the atomic expected achievements described above and on their mapping with actual
activities that it will be necessary to achieve in order
to provide these achievements. From the previous sections, these atomic achievements are the following:
Achievements for the interpretation layer:
• AchI1: A way to define the relevant dimensions
of the considered “system” (e.g. a method for converting KPIs, priorities, and expectations into the relevant dimensions of a framework).
• AchI2: A formal method for the identification
and precise characterization of conditions (e.g., a formal set of transformation mechanisms to characterize potential force fields in the considered “system” based on the defined
dimensions and the collected data,).
• AchI3: A characterization approach for the
definition of organizations (e.g. a formal mechanism to interpret the collected data and to describe and characterize organizations).
• AchI4: A way to identify risks and opportunities
for the considered organization(s) (e.g. mechanisms to deduce susceptibility from
organizations and conditions and to characterize risks and opportunities).
Achievement for the exploitation layer:
• AchE1: A way to define events, as degrees of
freedom of organizations, which can allow them to benefit from an opportunity or avoid a risk (e.g. an inference mechanism to determine actions in the environment or in the organizations with regards to the existing and characterized conditions).
• AchE2: An approach to infer and describe
potential consequences of identified events (e.g. first a formal way to characterize consequences, and second a set of propagation mechanisms to spread consequences of events with regards to
risks and opportunities).
• AchE3: The final method for the definition of
organizations trajectories (e.g. first a formal way to characterize objectives and second some mapping mechanisms to use the identified and propagated consequences with regards to the
objectives, in order to define relevant trajectories).
All the previous achievements can be identified on the mechanisms identified on Figure 8. The following Figure 9 presents these seven
achievements, located on the interpretation and
exploitation big-picture.
Figure 9. Achievements on the interpretation and exploitation mechanisms big-picture.
Based on past works, existing contributions in the literature and the overall vision of the approach, the main activities envisaged to obtain the identified achievements are the following:
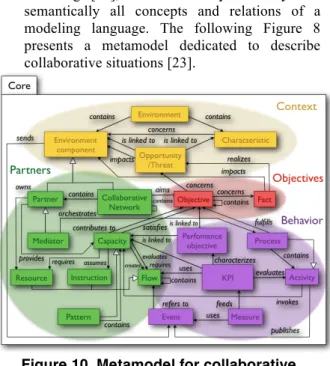
• Act1 – Design of the Metamodel: A metamodel
is a model that defines the language used for modeling [15], it describes syntactically and semantically all concepts and relations of a modeling language. The following Figure 8 presents a metamodel dedicated to describe collaborative situations [23].
Figure 10. Metamodel for collaborative situations.
This metamodel is structure according to four main parts:
– Context (concepts of environment component, opportunity / threat and characteristic): it describes the background
of the collaborative situation.
– Partners (concepts of collaborative network,
partner, capacity, resource, flow, instruction
and pattern): these concepts are used to
describe the network of partners to be considered in the collaboration.
– Objectives (concepts of fact, and objective): these concepts may be instantiated to depict what are the specific goals to be considered as targets.
– Behavior (concepts of behavior, activity,
measure, performance objective, KPI): these
concepts are the ones describing how the collaborative network behaves according to the three other parts.
This first activity will then use and adapt these existing results to describe the concepts and relations.
• Act2 – Definition of the interpretation
mechanisms: Basically, this task aims at
defining ways to use data to generate automatically dimensions, conditions, organizations and to infer susceptibility, of organizations to deduce risks and opportunities (all these are concepts from the metamodel). This is a really challenging task. There are a few avenues that should be considered for this purpose.
– Event-driven architecture and
complex-event processing: as stated in [24] and [25],
data can be considered and managed as events produced by people or electronic devices. Interpretation rules, as the ones described in [26] using ESPER1 and [27]
using SIDDHI2, can formally identify
predefined patterns to instantiate concepts of the metamodel.
– Machine learning: Layers of neural networks could be used to identify profiles of datasets, just like our senses identify the sensorial profile of an unknown element to link it with known elements and known concepts [28].
– The collaborative network theory: as presented in [29] it is also an inspiring and foundational set of contributions. The described typology of collaborative networks is a significant hint for data interpretation. It describes and structures what should be deduced.
– Inspiration from physics and chemistry
laws: As presented in [30] the physical and
chemical principles could be used as an inspiration analogy to formally define some evolution rules. Particularly, the theory about force fields could be used as an inspiring context for the data interpretation
1http://www.espertech.com/
2
https://wso2.com/products/complex-event-processor/
purpose and the definition of the susceptibility rules of organizations with regards to the context.
• Act3 – Study of the propagation mechanisms
within the ecosystem: This task is dedicated to
provide the approach with mechanisms to manage the dynamicity of the ecosystem. Roughly speaking, the previous task Act2 is in charge of defining a model of the overall situation (i.e. a global static picture) while the current task Act3 is in charge of defining the evolution rules of this observed situation (i.e. a global dynamic movie). This is a really challenging task as well. There are several avenues that should be considered for this purpose, some inheriting from the ones of Act2. – Considering that the results of the
interpretation phase are models (describing
the conditions, organizations, risks and
opportunities within the relevant
dimensions), the first idea could be the use
of model simulation technics to define the potential evolution of the system. Such simulation technics could be in particular
system dynamics [31] considering how
efficient this approach is for consequence propagation [32].
– Besides, the lifecycle of ecosystems of organizations described in [33] is also a very relevant input for the study of the dynamicity of the ecosystem models. – Finally, considering the vision of risks and
opportunity as vectors in a physical field, it is reasonable to think about them as elements of a vector space. The mathematical question about this vector space being ultimately a group, a ring or a
field may also provide additional tools
(theorems and laws) to study and determine the dynamicity of ecosystems of organizations.
• Act4 – Definition of a trajectory design
approach: This activity focuses on the last
achievement and probably the main benefit: the definition of decision trajectory for organizations. Depending on the considered organization (or group connected of organizations) and the associated target area(s) the ambition is to exploit the modeling space (resulting from Act2) and the dynamics principles (resulting from Act3) to analyze deeply the current location of organizations and the potential evolutions to define the best trajectory (in terms of decisions and exploitation of risks and opportunity) to reach a target
location. The approach could be to exploit, on the one hand, the vector space of risks and
opportunities and, on the other hand, the
inspiration from gravitational trajectories
calculus / magnetic field trajectories calculus to
define ways to calculate such trajectories.
5. Conclusion and perspectives
As stated above, the main significance factor of the topic addressed by this paper is probably the expected binding between data analytics (form the
artificial intelligence domain) and enterprise modeling (from the industrial engineering domain),
shading the drawbacks of both these approaches and providing a sound and fair framework for decision support system and management of organizations. The decision trajectory system is an original decision support system and is intended to create a breakthrough in the management of organizations.
This article provides two main contributions: a framework for data management and an abstract model for risk and opportunity description identification. However, the most significant result at this stage is the roadmap describing on the one hand the achievements that should be aimed and on the other hand the set of tasks that should be performed to reach these goals.
The presented model for risks and opportunities will be enriched to include propagation principles and to provide a way to model and simulate cascading effects. The relationship between the concept of event and the concepts of decisions and actions will also be studied to define morphismes between the space of risks and opportunities and the degrees of freedom of decision makers.
Finally, one broader conclusion of this article can be the following bet: just like big-data brought artificial intelligence back on the foreground, the next achievement of artificial intelligence, particularly in the domain of complex decision making, will bring model-driven engineering back on the stage.
6. References
[1] N. C. Taleb, The Black Swan – The Impact of the Highly Improbable. Random House, New York, 2007. [2] N. C. Taleb, Antifragile – Things that Gain from Disorder, Random House, New York, 2012.
[3] R. Ackoff, “From Data to Wisdom”, Journal of Applied System Analysis, 16, pp. 3-9, 1989.
[4] I. Rus and M. Lindvall, “Knowledge management in software engineering”, IEEE Software, 19(3), pp. 26-38, 2002.
[5] A. Tolk, “An agent-based Decision Support System Architecture for the Military Domain”, Intelligent Decision Support Systems in Agent-Mediated Environments, 115, pp. 187-205, 2005.
[6] I. Dickinson, “National resilience extranet common operational picture”, Niteworks report, Ref number: NW/Pj/ResComms/4902a, 2013.
[7] J. Rowley, “The wisdom hierarchy: representations of the DIKW hierarchy”, Journal of Information and Communication Science, 33(2), pp. 163-180, 2007. [8] F. Vernadat, Enterprise modeling and integration, Principles and applications, Chapman & Hall, 1996. [9] A. Gandomi, M. Haider “Beyond the hype: Big data concepts, methods, and analytics”, International Journal of Information Management, 35, pp. 137-144, 2015.
[10] F. Vernadat, “Enterprise modeling and integration (EMI): current status and research perspectives”, Annual Reviews in Control, 26, pp. 15-25, 2002.
[11] H. Jagadish, J. Gehrke, A. Labrinidis, Y. Papakonstantinou, J. Patel, R. Ramakrishnan and C. Shahabi, “Big data and its technical challenges”, Communication of the ACM, 57(7), pp. 86-94, 2014. [12] F. Benaben, A. Montarnal, A. Fertier, S. Truptil, “Big-Data and the question of horizontal and vertical intelligence: a discussion on disaster management”, Proceedings of Pro-VE’16, Springer, IFIP, Porto, Portugal, 480, pp. 156-162, 2016.
[13] F. Benaben, M. Lauras, S. Truptil, N. Salatgé, “A Metamodel for Knowledge Management in Crisis Management”, Proceedings of 49th HICSS’16, Hawaii, USA, pp. 126-135, 2016.
[14] W. Mu, F. Benaben, H. Pingaud “Collaborative process cartography deduction based on collaborative ontology and model transformation”, Information Sciences, 334, pp. 83-102, 2016.
[15] OMG, Meta object facility (MOF) Version 2.0 query / view / transformation, final adopted specification, 2008. [16] K. Czarnecki, S. Helsen, “Feature-based survey of model transformation approaches”, IBM Systems Journal, 45(3), pp. 621-645, 2006.
[17] R. Olsson, “In Search of Opportunity Management: Is the Risk Management Process Enough?”, International Journal of Project Management, 25(8), pp. 745-752, 2007.
[18] P. J. Edwards, P. A. and Bowen, Risk management in project organisations, Elsevier, Oxford, UK, 2005.
[19] B. Zeng, P. C. Yen, “Rethinking the role of partnerships in global supply chains: a risk-based perspective”, International Journal of Production Economics, 185, pp. 52-62, 2017.
[20] F. Benaben, A.-M. Barthe-Delanoë, M. Lauras, S. Truptil, “Collaborative Systems in Crisis Management: A Proposal for a Conceptual Framework”, Proceedings of Pro-VE’14, Springer, IFIP, Amsterdam, Netherlands, 434, pp. 396-405, 2014.
[21] C. Fang, F. Marle, E. Zio, J. C. Bocquet, “Network theory-based analysis of risk interactions in large engineering projects”, Reliability Engineering & System Safety, 106(2), pp. 1-10, 2012.
[22] X. Zhang, Y. Yang, J. Su, “Risk identification and evaluation of customer collaboration in product development”, Journal of Industrial Engineering and Management, 8, 3, pp. 928-942, 2015.
[23] M. Lauras, S. Truptil, F. Benaben, “Towards a better Management of Complex Emergencies through Crisis Management Metamodeling”, Disasters, 39(4), pp. 687-714, 2015.
[24] O. Etzion, P. Niblett, Event Processing in Action, 1st ed, Manning Publications Co., Greenwich, CT, USA, 2010. [25] D. Luckham, W. Schulte, Event Processing Glossary, Version 1.1, EPTS, 2008.
[26] A.-M. Barthe, S. Truptil, F. Bénaben, H. Pingaud, “Event-driven agility of interoperability during the run-time of collaborative processes”, Decision Support System, 59, pp. 171-179, 2014.
[27] A. Fertier, M. Montarnal, S. Truptil, A.-M. Barthe-Delanoë, F. Benaben, “A situation model to support collaboration and decision-making inside crisis cells, in real time”, Proceedings of ISCRAM’17, Albi, France, 2017. [28] A. Mossalam, M. Arafa, “Using artificial neural networks (ANN) in projects monitoring dashboards’ formulation”, Housing and Building Research Center Journal, 16(2), pp. 478-489, 2017.
[29] L. Camarinha-Matos, H. Afsarmanesh, “Collaborative networks: A new scientific discipline”, Journal of Intelligent Manufacturing, 16(4), pp. 439-452, 2005. [30] F. Benaben, V. Gerbaud, A.-M. Barthe-Delanoë A. Roth, “Establishment of collaborative networks – a model-driven engineering approach based on thermodynamics”, Proceedings of PRO-VE’17, Springer, IFIP, Vincenza, Italy, 2017.
[31] J. Forrester, Industrial Dynamics. Pegasus Communications: Waltham, MA. 1961.
[32] J. Forrester, “System dynamics, systems thinking, and soft OR”, System dynamics review, 10(2-3), pp. 245-256, 1994.
[33] L. Camarinha-Matos, H. Afsarmanesh, N. Galeano, A. Molina, “Collaborative networked organizations – Concepts and practice in manufacturing enterprises” Computers & Industrial Engineering, 57(1), pp. 46–60, 2009.