HAL Id: hal-01472961
https://hal.archives-ouvertes.fr/hal-01472961
Submitted on 21 Feb 2017
HAL is a multi-disciplinary open access
archive for the deposit and dissemination of
sci-entific research documents, whether they are
pub-lished or not. The documents may come from
teaching and research institutions in France or
abroad, or from public or private research centers.
L’archive ouverte pluridisciplinaire HAL, est
destinée au dépôt et à la diffusion de documents
scientifiques de niveau recherche, publiés ou non,
émanant des établissements d’enseignement et de
recherche français ou étrangers, des laboratoires
publics ou privés.
Distributed under a Creative Commons Attribution - NonCommercial - NoDerivatives| 4.0
Solid-State NMR on the Family of Positive Electrode
Materials Li_2Ru_1-ySn_yO_3 for Li-ion batteries
Elodie Salager, Vincent Sarou-Kanian, M. Sathiya, Mingxue Tang,
Jean-bernard Leriche, Philippe Melin, Zhongli Wang, Hervé Vezin, Catherine
Bessada, Michael Deschamps, et al.
To cite this version:
Elodie Salager, Vincent Sarou-Kanian, M. Sathiya, Mingxue Tang, Jean-bernard Leriche, et al..
Solid-State NMR on the Family of Positive Electrode Materials Li_2Ru_1-ySn_yO_3 for
Li-ion batteries. Chemistry of Materials, American Chemical Society, 2014, 26 (24), pp.7009-7019.
�10.1021/cm503280s�. �hal-01472961�
Solid-State NMR on the Family of Positive Electrode
Materials Li
2Ru
1-ySn
yO
3for Li-ion batteries
Elodie Salager,
1,2*Vincent Sarou-‐Kanian,
1,2M. Sathiya,
3,4,5Mingxue Tang
1,2, Jean-‐Bernard Le-‐
riche,
2,4Philippe Melin,
1,2Zhongli Wang,
1,2Hervé Vezin,
6Catherine Bessada,
1,2Michael Des-‐
champs
1,2and Jean-‐Marie Tarascon
2,3,51. CNRS, CEMHTI (UPR3079), Université d’Orleans, 1D avenue de la recherche scientifique, 45071 Orléans Cedex 2, France
2. Réseau sur le Stockage Electrochimique de l’Energie (RS2E), CNRS FR3459, 33 rue Saint Leu, 80039 Amiens Cedex, France
3. Collège de France, CNRS FRE3357, 11 place Marcelin Berthelot, 75005 Paris, France
4. Laboratoire de Réactivité et de Chimie des Solides (UMR 7314), Université de Picardie Jules Verne, 33 rue Saint Leu, 80039 Amiens Cedex, France
5. Alistore European Research Institute, CNRS FR3104, 33 rue Saint Leu, 80039 Amiens Cedex, France 6. Université Lille Nord de France, CNRS UMR 8516-‐LASIR, Univ. Lille 1, F-‐59655 Villeneuve d’Ascq, France
KEYWORDS. Lithium, battery, positive electrode, nuclear magnetic resonance, solid-‐state NMR, paramagnetic, disor-‐ der, Ruthenium, Tin, substitution
ABSTRACT: The possibilities offered by ex situ and in situ operando 7Li solid-‐state nuclear magnetic resonance (NMR) are
explored for the Li2Ru1-‐ySnyO3 family (0<y<1), shown previously to display cationic and anionic redox activity when used as
a positive electrode for Li-‐ion batteries. Ex situ NMR spectroscopic studies indicate a non-‐random Sn/Ru substitution in the family. In the first charge an increased metallicity at 4 V is deduced from the NMR spectra. Surprisingly, no striking difference is observed at 4.6 V compared to the pristine electrode, although the electronic structure is expected to be very different and the local cation environment to be distorted. For in situ operando measurements we designed a new electro-‐ chemical cell that is compatible with NMR spectroscopy and one-‐dimensional magnetic resonance imaging (MRI). These operando measurements validate the ex situ observations and indicate that the environment formed at 4 V is specific of the initial charge and that there is little, if not, electrolyte decomposition, even at 4.6 V. This is another attractive feature of these compounds.
Introduction
Layered materials have been instrumental for energy storage in lithium-‐ion batteries. LiCoO2’s ability to inter-‐
calate lithium ions allowed Sony to commercialize batter-‐ ies based on the rocking-‐chair principle.1 Ever since, re-‐
searchers have been working on ways to improve the properties of this material. Two great advances are worth being recalled. The first one over the 2001-‐2008 period deals with the partial replacement of Co3+ with Ni2+ and
Mn4+, which has led to the first new version of layered
oxides Li(Ni1/3Mn1/3Co1/3)O2, coined as NMC.2,3 These ma-‐
terials turn out to be very attractive since they display higher capacities (~ 200 mAh/g) than the three-‐ dimensional (LiMn2O4, LiNi0.5Mn1.5O4) spinels
(140 mAh/g) or than the most performing polyanionic compound LiFePO4 (170 mAh/g).4–6 These Li-‐NMC elec-‐
trodes are progressively replacing LiCoO2 in today’s Li-‐ion
cells. Further explorations of cationic substitutions in the layered oxide systems back to 2001 has led to materials made of Ni, Co, Mn and Li in the metallic layers. In this case, in addition to the Li present in the lithium layer, up to 1/3 of the 3d-‐metals can be replaced by Li, leading to materials termed Li-‐rich NMC,7–9 showing capacities ex-‐
ceeding 280 mAh/g. The origin of this extra capacity has however remained mysterious owing to the complexity of their structure, which can be viewed either as a solid solution of Li2MO3 and LiM’O2 or as a composite made of
small separate domains of these two phases.6,10,11
The processes at stake in Li2MO3-‐type structures have
been recently investigated in the families of Li2Ru1-‐yMyO3
materials, with M being Mn12 and Sn.13 The Li
2Ru1-‐ySnyO3
material was shown to provide the best capacity retention and the lowest voltage decay of the whole family. These exceptional properties were ascribed to the electrochemi-‐ cally inactive tin atoms that contribute to the stability of the framework during intercalation and deintercalation. The participation of the anionic network to the electro-‐ chemical processes, leading to the staggering capacities reported, was also demonstrated. Detailed local structure information to effectively understand the Li-‐driven mo-‐ tion of cations and anions during cycling is however still missing due to the “transparency” of lithium to many of the experimental techniques used in the previous studies. It is worth recalling here that the two materials Li2SnO3
and Li2RuO3 are made of lithium layers sandwiched be-‐
tween LiM2 layers forming honeycombs (M surrounding
Li). They crystallize in the same space group (C2/c) alter-‐ nating oxygen and cation layers, but they differ in the way the LiM2 layers are stacked, leading to different super-‐
structure patterns.14–16 X-‐ray diffraction studies13 have
demonstrated earlier the existence of a solid solution between the two end-‐members Li2SnO3 and Li2RuO3.
Nothing is known however about i) the arrangement of the Ru and Sn atoms as they could not be separated in previous X-‐ray diffraction studies and ii) the arrangement of Li owing to its low electronic density masked by the heavy Ru and Sn atoms.
Li solid-‐state Nuclear Magnetic Resonance (NMR) spec-‐ troscopy is a very sensitive tool to study local structure around the lithium and to follow structural changes in these paramagnetic materials, especially for materials with chemical disorder that cannot be easily character-‐ ized by diffraction methods. A 7Li NMR study on
Li2MnO3,17 with a similar layered structure, reported that
the 7Li NMR signatures were sufficiently different for Li in
the Li layers and in the Mn layers to be distinguished. Paik et al. showed that Li was extracted from both layers upon chemical etching.18 In parallel, 6/7Li NMR has been
used to study NMC and Li-‐excess NMC, following the pioneering work of Grey et al.19–22 Li NMR also allowed to
study cation ordering in mixed lithium-‐ruthenium(V) oxides.23–26 To push the limits further, we explore the
possibilities offered by 7Li solid-‐state NMR in the Li 2Ru1-‐ ySnyO3 series. Keeping in mind the complexity of the NMR
spectra for paramagnetic systems that are chemically disordered (Ru/Sn substitution), the experiments were designed to combine the advantages of complementary ex situ and operando measurements. The best resolution in NMR is reached with ex situ studies; it necessitates how-‐ ever a series of batteries stopped at various potentials for the characterization and therefore samples sparsely the charge-‐discharge processes. On the contrary, in situ ex-‐ periments allow studying the battery without the need to open it, and eliminate variations arising from small differ-‐ ences in the various batteries for a better quantification. Operando NMR studies go one step further by monitoring the battery in real time, while it is cycling, with a better time and voltage resolution.27–31 In the case of these highly
reactive materials, real-‐time measurements are precious as they reduce the risk of relaxation of the materials. For operando measurements, we designed an electrochemical cell compatible with one-‐dimensional imaging and used chemical shift imaging to identify the position of the electrolyte giving several sharp signals in the NMR spec-‐ trum. The in situ broad spectroscopic signature of the electrode is followed during charge and complements the ex situ measurements at different potentials.
The experimental results on the structural analysis of the family of Li2Ru1-‐ySnyO3 pristine materials are reported
here together with the solid-‐state NMR study of the Li2Ru0.75Sn0.25O3 compound upon cycling, using comple-‐
mentary ex situ and in situ operando measurements.
Experimental Section
The Li2Ru1-‐ySnyO3 powders were made as previously de-‐
scribed by annealing at high temperatures (900 °C) stoi-‐ chiometric amounts of RuO2 (Sigma-‐Aldrich 99.9%),
SnC2O4 (Sigma-‐Aldrich 98%) and 10% excess of Li2CO3
(Sigma-‐Aldrich, 99.0%) to compensate for its volatility at high temperature. Powdered electrodes made of 90% Li2Ru1-‐ySnyO3 and 10% carbon super P (CSP, Timcal) were
cycled in swageloks at a rate C/20 (1 Li per Ru in 20h) and stopped at various states of charge.
For the ex situ 7Li NMR study, the pristine materials
and the washed electrodes were packed in 1.3 mm outer diameter rotors in an Argon glovebox, closed tightly with
a cap and spun under N2 using magic angle spinning
(MAS). The ex situ data reported here were acquired on a 4.7 T Avance III HD Bruker spectrometer (7Li frequency of
77.7 MHz). The 7Li spectra were obtained using a double
resonance 1.3 mm Bruker probe with rotors spun at 62.5 kHz (unless mentioned otherwise) and a Hahn-‐echo sequence synchronized with one rotor period (16 µs). The RF field strength was 170 kHz. The longitudinal relaxation times T1 were measured for each sample and the recycling
delays always allowed full relaxation of the spins, except for the diamagnetic SEI part. The 7Li shifts were refer-‐ enced to a 1 mol.L-‐1 solution of LiCl at 0 ppm. For para-‐
magnetic compounds the shifts depend on temperature; the values given here were measured with the probe at room temperature, and correspond to a temperature inside the rotor close to 50°C due to frictional heating. The 1D spectra of figure 1 and S1 were fitted with Gaussian lines using the dmfit software.32 The narrow spectrum of
diamagnetic Li2SnO3 was acquired differently, on a 17.6 T
Avance III Bruker spectrometer using a 2.5 mm Bruker probe, with a spinning rate of 20 kHz for proper fitting of the quadrupolar lineshape. In that case Voigt functions were used. Details of the deconvolution and simulated spectra are given in SI.
In situ 7Li NMR spectra were acquired on a 9.4 T
Avance I Bruker spectrometer equipped with a diff50 Bruker probe, with a 50 G/cm/A gradient coil and a Bruker 40 A GREAT40 gradient amplifier. We modified the probe to pass the electrical connections of our new electrochemical cell to the galvanostat in a shielded tube at the centre of the probe body.
The main body of our new electrochemical cell is a 10 mm outer/6 mm inner diameter Kel-‐f® (polychlorotri-‐ fluoroethene) cylinder, a polymer chosen for its excellent hydrophobic and mechanical properties. The current collector on the negative side is a 2 mm-‐thick Cu disk fitted with a silver-‐coated Cu wire. On the positive side we used an Al disk with an Al wire. O-‐rings ensure air-‐ tightness at each wire and at the connections of the two main parts of the cell.
The operando study was performed on a half battery containing 13.4 mg of a plastic composite electrode (in accordance with Bellcore’s plastic Li-‐ion technology) containing Li2Ru0.75Sn0.25O3 / CSP / PVDF-‐HFP in ratios
80/10/10, a Li metal disc (0.3 mm thick) and Whatman GF/D borosilicate glass fibre sheets soaked with a home-‐ made electrolyte (1 mol.L-‐1 LiPF
6 in EC/PC/DMC in weight
ratio 1:1:3). The electrochemical charge and discharge was controlled by a Biologic VSP galvanostat, using a constant current of 58 µA (one Li per Ru inserted in 30 hours). The spectra were acquired with a α-‐τ-‐α-‐τ-‐acq echo sequence with an echo delay τ = 12 µs between the excitation pulse and the refocusing pulse. The pulse lengths (5 µs) were chosen to obtain the largest bandwidth available with the highest possible RF field strength of 50 kHz. The recycling delay was voluntarily shortened (250 ms) so as to enhance the signals from the fast-‐relaxing (paramagnetic) parts, limit the contribution from the free electrolyte and speed
up the acquisition. Each spectrum was collected in 29 min (0.02 Li inserted during acquisition) and we acquired 120 spectra in a full charge. Referencing of the shifts is chal-‐ lenging because it is difficult to align perfectly the elec-‐ trodes with the magnetic center of the magnet. We refer-‐ enced the in situ spectra by setting the most intense peak for the electrolyte at 0 ppm.
The image-‐spectrum correlations were obtained using a standard spin-‐echo chemical shift imaging sequence, with 32 scans and a repetition time of 180 ms. The image di-‐ mension was acquired with 256 increments and a maxi-‐ mum gradient strength of 379 G/cm (field of view of 16 mm; 62.5 µm between each slice). The acquisition time in the spectroscopic dimension was 9 ms.
The crystal structures obtained by random substitution of Ru by Sn (no partial occupancy) were generated from the Li2RuO3 structure with the program supercell by
Okhotnikov and Cadars.33 The substitution was per-‐
formed using one unit cell (6 Sn/Ru per unit cell). The probability of each type of Li environment was assessed by a careful analysis of these structures.
Results and discussion
a) The pristine materials from an NMR point of view The 7Li spectra were first collected for all the members
of the Li2Ru1-‐ySnyO3 series (Fig. 1) with the hope to obtain
further local structural information on the respective positioning of Ru, Sn and Li in these phases as the amount of Ru changes.
We focus first on the electrochemically inactive and di-‐ amagnetic end-‐member of the solid solution Li2SnO3,
which is reported as an ionic conductor with poor elec-‐ tronic conductivity.34 A 7Li NMR spectrum acquired at
17.6 T is shown in Figure 1b. The best fit was obtained with 2 components at shifts of 0.8 ppm (28%), -‐0.3 ppm (72%). These shifts are in the typical diamagnetic range and confirm the material (electronically) insulating char-‐ acter. This is also supported by the relatively long longi-‐ tudinal relaxation times (T1 = 1.46 s). The signals are sharp
and indicate good crystallinity, but the intensities do not match exactly those expected (50% and 25% for the two similar Li sites in the Li layers and 25% for the Li site in the LiSn2 layers). As such an end-‐member sample has no
electrochemical interest, we did not pursue further stud-‐ ies here to survey whether these deviations could result from non-‐stoichiometry issues, extended defects or Li mobility.
As we increase the amount of Ru in Figure 1, the 7Li
spectra become broader, with components appearing at shifts as high as 500 ppm (see SI for deconvolution). The-‐ se high shifts, well outside of the typical range for dia-‐ magnetic insulating solids, arise from the interaction of the nuclear spins with the unpaired electron spins. We study further the exact mechanism at the origin of these shifts to grasp further information on the detailed struc-‐ ture of the materials. A Knight shift (arising from conduc-‐ tion electrons) can be excluded as the EPR measurements did not detect any signal from conduction electrons.13
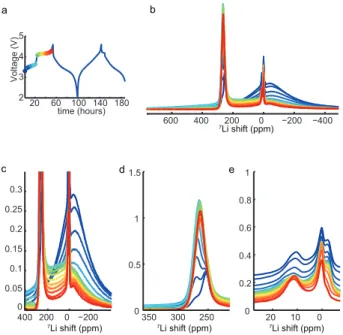
Figure 1. (a) 7Li solid-‐state NMR spectra of the solid solution Li2Ru1-‐ySnyO3 obtained at 4.7 T. Spinning sidebands are indi-‐
cated with asterisks (MAS rate 62.5 kHz). (b) Decomposition of the spectrum of Li2SnO3, details in SI. (c, d) Main Li com-‐
ponents in the Ru layers and in the Li layers respectively. The cross shows the position of the maximum intensity and the width of the bar indicates the full width at half height. The main shifts expected for a random substitution are shown in dotted coloured lines; other possibilities are in dotted black (Ru/Sn partial ordering) and grey (Ru/Li substitutions).
We account for the observed shifts in the NMR data of the family with the model for paramagnetic Fermi contact (FC) shifts developed by Grey et al.,19 for lithium oxides
containing paramagnetic metals with octahedral geome-‐ try. The authors demonstrated that the observed shifts can be interpreted using the sum of the individual contri-‐ butions of all paramagnetic metal-‐O-‐Li bonds, each bond contributing to a positive or a negative shift depending on the metal-‐O-‐Li bond angle and the electronic configura-‐ tion. As a consequence, the configurations of the cation coordination spheres around the lithium ions need to be considered for interpreting the 7Li spectra, in terms of
number and type of bonds to paramagnetic metals. The FC shift is expected to be dominant here, as the chemical shift range is negligible compared to the FC shift. Tin(IV) does not contribute to a FC shift in Li2SnO3 and hence in
the whole LixRu1-‐ySnyO3 family, as its oxidation state re-‐
mains unaltered.13 The number of surrounding Ru and
their position are therefore controlling the FC shift of the Li atoms.
For the Li2Ru1-‐ySnyO3 materials, the Li are located in an
oxygen octahedron surrounded by Li, Sn or Ru atoms: 12 atoms connected by 90° O-‐Li bonds are found in the first cation coordination sphere and 6 atoms are connected via 180° O-‐Li bonds in the second cation coordination sphere (Figure 2). Assuming a low-‐spin configuration as deduced from magnetic measurements, Grey’s model indicates that the 90° Ru-‐O-‐Li bonds contribute to a positive FC shift (FC90) through delocalization and the 180° Ru-‐O-‐Li
bonds generate a negative FC shift (FC180) on the Li by a
polarization mechanism.
Figure 2. (a) Environment for Li in Li layers and (b) for Li in Ru layers in Li2RuO3. Ru are in shiny grey and Li are in blue,
random fill. Oxygens (red) have a small diameter for easier reading of the figure. The Li-‐O-‐Ru bonds to consider for the central Li are shown with multiband cylinders. Note that each Ru90 creates two 90° bonds.
In the following paragraph, the structural differences that matter for the FC shift of the Li in the Ru layers (LiLi2Ru) and in the Li layers (LiLi) are detailed for Li2RuO3.
The LiLi2Ru (Figure 2b) are surrounded by 6 Ru90 atoms
(honeycomb ordering) and no Ru180 in the second cation
coordination sphere. These LiLi2Ru should therefore display
a shift of 12 FC90, highly positive. On the other hand the
coordination sphere of the LiLi (Figure 2a) is composed of
4 Ru90 atoms and 4 Ru180 atoms (the 10 other sites being
1 Ru90+1 Ru180 2 Ru90+2 Ru180 3 Ru90+3 Ru180 4 Ru90+4 Ru180 2 Ru90+1 Ru180 0 50 100 150 7Li shift (ppm) 5 Ru90+5 Ru180 6 Ru90+6 Ru180 1 Ru90 8 Ru90+7 Ru180 4 Ru90+3 Ru180 5 Ru90+4 Ru180 6 Ru90+5 Ru180 7 Ru90+6 Ru180 d Li in Li layers Li2RuO3 Li2Ru3/4Sn1/4O3 Li2Ru1/4Sn3/4O3 Li2Ru1/2Sn1/2O3 2 Ru90 75 40 29 79 50 23 81 28 11 9 4 0 1.5 Ru90 3 Ru90 4.5 Ru90 6 Ru90 50 100 150 200 250 300 350 400 450 500 7Li shift (ppm) 3 Ru90 4 Ru90 5 Ru90 6 Ru90 2 Ru90 1 Ru90 c Li in Ru layers Li2RuO3 Li2Ru3/4Sn1/4O3 Li2Ru1/4Sn3/4O3 Li2Ru1/2Sn1/2O3 405 250 191 141 101 208 28% 72% -20 -15 -10 -5 0 5 10 15 20 Li2SnO3 b 7Li shift (ppm) Li2RuO3 Li2Ru3/4Sn1/4O3 Li2Ru1/4Sn3/4O3 Li2Ru1/2Sn1/2O3 Li2SnO3 a * * * * x2 x2 x22 -200 200 600 1000 7 Li shift (ppm)400 0 800
Li). The resulting shift (8 FC90 + 4 FC180) will be much
smaller than for LiLi2Ru, as the 180° bonds contribute nega-‐
tively. Based on the X-‐ray structure, we expect relative intensities of 25% and 75% for the LiLi2Ru and the LiLi in
Li2RuO3, respectively. Unfortunately the spectrum of
Li2RuO3 does not display well-‐defined peaks as in
Li2MnO3, indicating a deviation from the ideal structure.
Stacking faults, as observed on Li2MnO3,35 or distortions
of the Ru network to form long and short Ru-‐Ru distanc-‐ es36 could be at play.
For the mixed compounds, the chemical disorder intro-‐ duced by Sn/Ru substitution needs to be taken into ac-‐ count. It is worth recalling the source of shifts and line-‐ shapes before we interpret in detail the experimental spectra of the Sn/Ru substituted materials. In the present case the prevailing source of 7Li shift is the FC shift mech-‐
anism arising from paramagnetic Ruthenium. Chemical disorder introduced by substitution of Ru by diamagnetic Sn has therefore the strongest effect. One peak is ex-‐ pected for each type of Ru configuration around the Li (number of Ru and type of Ru-‐O-‐Li bond) with an area controlled by its proportion in the material, while smaller variations induced by geometrical disorder (bond length, angle, etc…) result in the width of each component. NMR is well known for being a powerful tool to probe such disorder,37 but its sensitivity to local environments is also
a drawback when too many of those are present and/or have similar shifts. In that case, resolution is lost and the NMR peaks merge and appear as one average peak. The position of this peak then indicates the most populated environment(s), and its width is controlled by the num-‐ ber of merging peaks and their respective widths. Table S1 in SI indicates all the possible configurations around Li atoms. Twenty-‐two peaks are expected assuming only Ru/Sn and no Li/Ru substitution. Seven Ru configurations can be expected for LiLi2Ru (0 to 6 Ru90). The range of pos-‐
sibilities (20) is larger for LiLi, as Ru are present in the first
and second coordination spheres (Ru90 and Ru180).
Those configurations do not however happen with the same proportion in the crystal. Using the supercell pro-‐ gramme,33 the expected Li environments and their proba-‐
bility are surveyed in the case of random substitution. In Li2Ru0.25Sn0.75O3, nine non-‐negligible (>5% probability)
environments are found for Li: Li surrounded by 0 Ru90
(5% from LiLi2Ru), 1 Ru90 (7% LiLi2Ru and 7% LiLi) and 2 Ru90
(8% from LiLi2Ru and 7% from LiLi), 1 Ru90 + 1 Ru180 (32%
from LiLi), 2 Ru90 + 1 Ru180 (9%; LiLi), 1 Ru180 (7%; LiLi) and
1 Ru90 + 2 Ru180 (5%; LiLi). Note that the most probable
environments is 1 Ru90 + 1 Ru180 for LiLi and 1 or 2 Ru90 for
LiLi2Ru, but that some environments can be present both in
Li layers and in Ru layers, which complicates the interpre-‐ tation.
The detailed prediction of the FC shifts need elaborate spin-‐polarized calculations38,39 that go beyond the scope
of this manuscript. However, based on Grey et al. model and the spectrum of Li2Ru0.25Sn0.75O3, we could determine
the FC shift contributions FC90 and FC180 (on average
+33 ppm and -‐56 ppm, as detailed in supplementary in-‐
formation). We consider these as average values, as FC180
was shown to be extremely dependent on the Ru-‐O-‐Li bond for a range of Ru(V) lithium oxides40 and we do not
expect the sensitivity to bond angle to be different for Ru(IV). Based on these values, we exploit the experi-‐ mental spectra of the mixed Sn-‐Ru compounds. Table S1 in SI indicates the FC shifts calculated for the Li in all the possible Sn/Ru configurations, assuming no geometrical disorder.
Experimentally, the spectra become more shifted for increasing substitution of Sn by Ru, as expected for Li environments richer in Ru90, but they also become less
resolved due to an increased number of populated Ru configurations around the Li. Interestingly, the absence of major negative shift components in the 7Li spectra of the
whole family indicates that the Ru/Sn substitution results in general in a number of Ru90 higher than the number of
Ru180.
For a closer inspection of the paramagnetic part of the spectrum, a careful deconvolution was performed using the smallest necessary number of components (Figure S1). Valuable information on the Sn-‐Ru arrangement, which could not be accessed by other techniques, is obtained from the contribution of Li surrounded by only diamag-‐ netic Sn and Li near 0 ppm. This contribution decreases with the amount of Sn in the sample as expected, but it is much higher than expected for a statistical substitution (7% for 25% Ru and 0.4% for 50% Ru). Furthermore, 119Sn
NMR experiments conducted on the same samples (Fig-‐ ure S2) detected a “Sn-‐only” signal more intense than expected and support this hypothesis. Note that no other phase was detected by X-‐rays.13 The Ru substitution there-‐
fore creates preferentially “Sn-‐only”, i.e. non-‐ paramagnetic, lithium environments and consequently Ru-‐rich and Ru-‐poor environments in the material. Note that we do not know whether these environments are homogeneously distributed throughout the structure or whether they are “clustered” in the sample.
For the Ru-‐containing pristine materials, four main peaks were always found by deconvolution, accounting for ~20% of the signal each. In relatively good agreement with the expected shifts, the average FC shift increases experimentally with the Ru proportion. One peak is al-‐ ways much more shifted than the three others, and is assigned to the Li in Ru layers .Figure 1c shows the posi-‐ tion and width at half-‐height of this high-‐shift peak, to-‐ gether with the shifts expected from the FC model (verti-‐ cal lines) for a random substitution. Interestingly, the width of the Li2Ru peak (the extension of the bar in figure
1c shows the width at half height) indicates that a non-‐ negligible range of configurations with excess or missing Ru are created, in agreement with the previous observa-‐ tion. It is even more striking for Li2RuO3 and
Li2Ru0.75Sn0.25O3, for which the high-‐shift range has to be
described by two components (10% each). Part of it, but not all, might arise from a non-‐stoechiometry of the sam-‐ ples due to the volatility of Li during the synthesis. In the
case of high Ru content, the Ru propensity to “dimerize”, as was observed in Li2RuO3, is most probably at stake.36
For LiLi in Li layers, statistical substitution should result
in one predominant environment for each composition (dotted coloured lines in Fig. 1d). Experimentally, the hypothesis of “Ru grouping” is further confirmed by the observation of three types of environments: the expected environment and environments slightly richer and slight-‐ ly poorer in Ru. One of the LiLi sites in the structure is
distorted and might result in a slightly different FC shift, but this is not sufficient to explain the three other com-‐ ponents in the spectrum. Many Ru configurations around the LiLi are possible for a given number of Ru, and it is
difficult to rationalize the observed shifts further in terms of numbers of Ru and more so Ru90 and Ru180.
In the following we concentrate on the behaviour of the Li2Ru0.75Sn0.25O3 material (1-‐y=3/4, denoted hereafter
LixRSO) that was shown to provide the best cycling per-‐
formances of the family, using a combination of ex situ and in situ operando measurements. Resolution is low in NMR of such static solids due to the large anisotropic interactions. The solution is to pneumatically spin the sample, but spinning a battery is challenging due to eddy currents, heating, centrifugal forces and probe design issues. As a result, the high-‐resolution study is necessary ex-‐situ. Here we present the static in situ experiment together with the high-‐resolution ex situ study (with ul-‐ tra-‐fast spinning for maximum resolution). We designed an electrochemical cell compatible with imaging, and we demonstrate its use with the characterization of Li2Ru0.75Sn0.25O3.
b) Ex situ characterization of cycled electrodes When the Li/Li2Ru0.75Sn0.25O3 electrochemical cell is
charged up to 4.6 V, two main steps appear: a sloping voltage from 3 V to 4 V and a plateau from 4 V to 4.6 V (Figure 3). The first one leads to a single phase (Li1.3Ru0.75Sn0.25O3) with Ru(V) and the latter to a
peroxo/superoxo Li0.5Ru0.75Sn0.25O3 phase as previously
determined by combined XPS and EPR measurements. However there is limited information on the Li removal process at the structural level. To get more insight into this issue, the 7Li spectra of the partially oxidized elec-‐
trodes (xLi=1.3 and x=0.5) are shown in Figure 3. In all the
samples a sharp peak is found in the diamagnetic region (~0 ppm), which we assign to diamagnetic species formed in the solid-‐electrolyte interface (SEI) and not completely removed from the material by the washing step. Note that the three spectra were scaled to have similar intensities but the intensity of the 7Li spectrum for the Li
0.5RSO is
much lower (less Li atoms), resulting in an apparently more intense SEI peak.
As the sample is partially oxidized (Fig. 3, xLi=1.3) we
observe a surprising behavior. The 7Li spectrum becomes
broader and more symmetric, its shifts changes severely (183 ppm), and its intensity is much smaller than ex-‐ pected. Such behaviour was also revealed by a similar 7Li
spectrum (figure S3) for the isoelectronic LiRuVO
3 phase,
made electrochemically. We experienced difficulties
spinning the rotor above 59 kHz, indicating increased electronic conductivity or magnetism. Two possible ex-‐ planations can be put forward to account for the observed spectrum. One is nested in a reorganization of the Ru and Sn atoms, so that all the remaining Li (in both layers) have a similar environment. Another possibility is rooted in an increase of the metallic character of the sample following oxidation of the Ru, resulting in an average shift for all Li governed by the interaction with the itinerant electrons (as observed on LiCoO241).The second hypothe-‐ sis is favoured, as it is consistent with the increased con-‐ ductivity and EPR measurement which indicated a partial localization but strong electron mobility at room temper-‐ ature.13
Figure 3. 7Li solid-‐state NMR spectra in the first charge of
Li2Ru0.75Sn0.25O3 scaled to have the same intensity. Spinning
sidebands are indicated with asterisks (MAS rate 62.5 kHz except for Li1.3RSO : 59 kHz). The sharp peaks near 0 ppm in
the cycled materials arise from diamagnetic species formed in the solid-‐electrolyte interface.
When the sample is further oxidized to 4.6 V (xLi=0.5),
the main peak shifts back to the 60 ppm-‐region, close to the pristine material, with a tail towards higher shifts. Absolute interpretation of the shift needs new models for the system considering the position and electronic struc-‐ ture of Ru and O during cycling. One possibility is the change in the electronic environment experienced by Li with the formation of peroxo/superoxo-‐like species dur-‐ ing oxidation. Nonetheless, the non-‐gaussian shape and wider 7Li spectrum of the Li
0.5RSO sample compared to
the pristine indicate a large disorder in the system caused by electrochemical (possibly mixed Ru oxidation state), chemical (Sn/Ru/Li redistribution) and/or geometrical (bonds, angles) modifications, that introduces more com-‐ ponents in the NMR spectrum. Chemical disordering in the structure was also observed in recent STEM studies on similar Li2Ru1-‐yTiyO3 and Li2RuO3 systems.42
Figure 4. 7Li solid-‐state NMR spectra of multiple charge-‐ discharge cycles of Li2Ru0.75Sn0.25O3 (a) Spectra of the
charged electrode in 1st and 2nd cyles. (b) Spectra of dis-‐ charged electrodes in the 1st, 2nd, 25th and 50th cycles, com-‐
pared to the pristine electrode (full). The sharp components near 0 ppm in the cycled materials arise from diamagnetic species formed in the solid-‐electrolyte interface. Spinning sidebands are indicated with asterisks (MAS rate 62.5 kHz).
The evolution of the 7Li spectrum was also monitored
upon further cycling. In Figure 4a, the 7Li spectra for
charged samples obtained from two different batteries, cycled once (red) or twice (purple), are superimposed. The spectra are identical, with the exception of the dia-‐ magnetic Li signal arising from SEI, expected to vary from battery to battery. This observation further confirms the reproducibility of the material detected from the electro-‐ chemical studies. We collected additionally the 7Li spectra
for samples in the discharged state after 1, 2, 25 and 50 cycles. The spectra of the discharged materials after 1 and 2 cycles neatly superimpose (Fig. 4b), but the more in-‐ tense tail compared to the pristine Li2RSO sample in the
high-‐shift range (Ru90-‐rich environments) suggests that a
grouping of the Ru is triggered in the initial cycling and is not completely recovered upon a full cycle, in agreement with previous XRD measurements.
The evolution of that tail with the number of cycles in-‐ dicates that this grouping of the Ru in the Ru layers is reduced until the 25th cycle (or that Li atoms do not re-‐
turn close to these environments). This is at first surpris-‐ ing, although one could envision that a few cycles are necessary to free atom migration (e.g. remove pinning defects) within the structure and therefore facilitate their return to their nearly original states. Purely coincidentally or not, such a behavior mirrors the capacity retention of similar electrodes which decay till 25 cycles prior to stabi-‐ lization, hence indicating a possible correlation between capacity decay and Ru/Sn organization in the metal layer during the first cycles. It is worth mentioning the absence of further evolution of the 7Li spectra by extending the
cycling till 50 cycles (Fig. 4b), highlighting once more the exceptional cyclability of the LixRu0.75Sn0.25O3 family of
compounds.
The ex-‐situ measurements were successful in spotting the local chemical disorder triggered by the removal and uptake of Li, and they could indicate an increase in the “grouping” of the Ru atoms in the Ru layers during the first cycles, followed by a small decrease of this “group-‐ ing” at the end of the formation cycles. Additionally, a surprising behavior was observed at 4 V with an increase in metallicity and at 4.6 V with a spectrum closer to the pristine/fully reduced electrode. In order to shed more light on this issue and to get better time and voltage reso-‐ lution without any risk of evolution during battery disas-‐ sembly, we complemented our study with real-‐time ob-‐ servations.
Next, our new electrochemical cell and probe design are presented, then we demonstrate how the combination of imaging and spectroscopy enhances the understanding of the spectra and finally we focus on the time-‐resolved information we gather for LixRu0.75Sn0.25O3 in the first two
cyles, especially at half charge. c) Operando cell and probe design
In situ NMR brings special constraints on the cell de-‐ sign. Stainless steel containers cannot be used as they prevent acquisition of the NMR signal of the components inside the battery. Two types of electrochemical cell de-‐ sign for in situ NMR, compatible with standard NMR probes, have been proposed previously: flexible plastic pouch cells28,29,31 and a cylindrical polypropylene cell.30
Polarization studies on liquid electrolytes have also been performed inside a liquid-‐state NMR tube.43–45 Our new
cylindrical design, similar to a “Swagelok” cell, as shown in Figure 5, ensures control on the compression in the active cell part.
Contrary to Poli et al.,30 the cell is positioned vertically
in a Bruker diff50 probe equipped with a saddle coil. As a result, the two current collectors are horizontal in the magnet, which is better adapted to the geometry of the radio-‐frequency field created in the saddle coil and en-‐ sures maximal RF-‐field penetration in the electrochemical cell.46 The other advantage of such a configuration is the
cylindrical symmetry along the vertical axis. The large magnetic field gradient available along the vertical axis in the diff50 probe allows performing chemical shift imaging (CSI)47, a combination of 1D imaging and spectroscopy.
The formation of dendrites and mossy lithium by polariz-‐ ing symmetric Li pouch cells was followed by CSI,48 with a
3D gradient NMR/MRI probe. Thanks to the cylindrical symmetry of our new design and its vertical positioning inside the probe, meaningful results can be obtained here with a 1D image (projection) along the vertical axis. This extends the range of probes suitable for CSI imaging (only one z-‐gradient needed).
−1000 −500 0 500 1000 1500 2000 7Li shift /ppm a b Li2RSO −1000 −500 0 500 1000 1500 2000 7Li shift /ppm discharged
1 cycle & 2 cycles
discharged
25 cycles & 50 cycles
* *
* *
charged
Figure 5. Electrochemical cell
Figure 6. (a) Spectrum of the electrochemical cell containing the half-‐cell Li2Ru0.75Sn0.25O3//Li with LP30 electrolyte, (b)
chemical shift imaging of the cell, (c) zoom in the electrolyte part.
Electrochemically-‐wise, the validity of this new cell de-‐ sign is proved by the voltage-‐composition profile of the Li/Li2Ru0.75Sn0.25O3 cell, which is identical to the profile
obtained in cycling classical swageloks or coin cells over a few cycles (see below).
d) In situ and operando characterization of LixRSO
An operando NMR characterization of LixRSO is per-‐
formed with our electrochemical cell, bearing in mind that resolution is poorer in a static mode and that mag-‐ netic susceptibility variations caused by heterogeneities in the battery shifts the peaks.49,50 Operando measurements
have however the great advantage of measuring a series of spectra on the same battery, and they give a much better time/voltage-‐resolved picture of the phenomena at stake. In our case the signal to noise was good enough to meas-‐ ure one spectrum in 30 min and provided 240 spectra per electrochemical cycle.
Figure 6a shows the 7Li spectrum (Hahn echo) of the
cell placed onto the NMR probe, just after assembly in the glovebox and before any cycling. The three Li-‐based com-‐ ponents of the cell (lithium negative electrode, electrolyte and positive electrode) are observed in the 7Li NMR spec-‐
trum. The sheet of metallic lithium is Knight-‐shifted to 258 ppm. The electrolyte peaks appear as several narrow peaks in the diamagnetic region (11, 0, -‐3 ppm), due to variations of the magnetic susceptibility in different parts of the cell. They are identified with the chemical imaging technique in the next paragraph. Finally, the pristine electrode is the broad component centered at -‐5 ppm, with a component towards higher shifts. This shift is quite different from the maximum component in the ex situ Li2RSO spectrum (centered at +28.5 ppm), most
probably due to temperature effects and anisotropic mag-‐ netic susceptibility of the film.
Chemical shift imaging is a very powerful way to obtain localized spectra, e.g. spectra of portions of the sample. With this other method we identify the position of the lithium metal and of the electrolyte that give rise to the three peaks. The resulting image/spectrum of the Li/Li2Ru0.75Sn0.25O3 cell, shown in Figure 6b, correlates the
spectrum (horizontally) with the 1D position (vertical). We used the vertical magnetic field gradient available in this probe to select horizontal slices of the electrochemi-‐ cal cell; its cylindrical symmetry ensures that a 1D image is sufficient. We detect in Figure 6b the Li metal at the top of the cell, with a skin-‐depth effect reducing the sig-‐ nal at the center of the foil. The image-‐spectrum correla-‐ tion is useful to assign the electrolyte peaks (zoom in Figure 6c). The broadest peak (11 ppm), at the centre of the cell, is the electrolyte adsorbed in the separator. The 0 ppm peak is free electrolyte trapped by the O-‐rings during assembly along the current collector wires (mostly the top copper wire). The -‐3 ppm peak is further away and arises from a drop of electrolyte trapped at the bottom of the cell. Unfortunately the broad electrode signal cannot be imaged with the present technique because its trans-‐ versal relaxation time is too short for the signal to survive the series of radiofrequency and gradient pulses required
1D Projection from 2D 1D Projection from 2D position / mm 300 250 200 150 100 50 0 7Li shift / ppm −6 −4 −2 8 6 4 2 0 250 200 150 100 50 0 position / mm 7Li shift / ppm 300 50 40 30 20 10 0 −10 −20 −30 −4 −2 8 6 4 2 0 50 40 30 20 10 0 −10 −20 −30 60 Li metal Li in separator Li in free electrolyte Li in separator Li in free electrolyte Li in free electrolyte 60 7Li shift (ppm)0 −200 −400 200 400 300 100 -100 −300 a b c