Université de Montréal
Approches et considérations innovatrices reliées à
l’équivalence pharmacocinétique (PK) et
pharmacodynamique (PD) des médicaments
New and alternative approaches to the assessment of
pharmacokinetic and pharmacodynamic equivalence
par Deniz Ozdin
Sciences pharmaceutiques, Université de Montréal Faculté de pharmacie
Thèse présentée
en vue de l’obtention du grade de Philosophiæ Doctor (Ph.D.) en Sciences pharmaceutiques
option Pharmacologie
Mars 2020 © Deniz Ozdin, 2020
Université de Montréal
Faculté des études supérieures et postdoctorales
cette thèse intitulée :
Approches et considérations innovatrices reliées à l’équivalence pharmacocinétique (PK) et pharmacodynamique (PD) des médicaments
Présentée par Deniz Ozdin
A été évaluée par un jury composé des personnes suivantes Denis DeBlois, Ph.D.
Président-rapporteur
Murray P. Ducharme, Pharm.D, FCCP, FCP Directeur de recherche
France Varin, B. Pharm., Ph.D. Codirectrice
Denis Projean, Ph.D. Membre du jury Chantale Simard, Ph.D.
Résumé
La bioéquivalence, une mesure de substitution de l'innocuité et de l'efficacité à différents stades du processus de développement des médicaments, est tout particulièrement importante lors du développement d'un médicament générique. Entre autres critères, la bioéquivalence garantit que les médicaments génériques sont équivalents aux produits innovateurs ou de références approuvés en termes d’efficacité clinique et d’innocuité tout en contournant le long cours et le coût élevé des essais chez les animaux et des essais cliniques chez les patients exigés pour les médicaments innovants. Malgré les avancées dans le développement d'approches robustes au cours des dernières décennies, la pratique actuelle de la bioéquivalence fait toujours l'objet de controverses. Le but de cette thèse est d'explorer certaines de ces controverses et de les aborder en proposant des approches nouvelles et alternatives.
L'une des questions les plus controversées dans la pratique actuelle de la bioéquivalence est l'extrapolation des résultats d'études de bioéquivalence d'une population à une autre. La majorité des études de bioéquivalence portant sur des formes pharmaceutiques orales efficaces par voie systémique reposent sur les critères de pharmacocinétique obtenus chez des sujets sains, alors que la population cible est constituée de patients. Ceci est basé sur l'hypothèse que si deux produits sont bioéquivalents dans une population, ils devraient l'être dans une autre.
L'extrapolation des résultats des études de bioéquivalence ne se limite pas à celle des sujets sains aux patients. Depuis 2007, une proportion croissante d'études de bioéquivalence pharmacocinétique portant sur des soumissions génériques nord-américaines ou européennes a été réalisée auprès de populations géographiques/ethniques autres que celles visées, en raison du coût moins élevé de ces études en dehors de l'Amérique du Nord et de l'Europe.
Dans le premier volet de cette thèse, nous avons examiné si les résultats de la bioéquivalence obtenus dans une population géographique ou ethnique pouvaient être extrapolés à une autre. À cette fin, nous avons extrait les résultats des études de bioéquivalence pharmacocinétique disponibles publiquement et provenant de soumissions
génériques à Santé Canada et à la Food and Drug Administration des États-Unis. Pour dix médicaments différents, nous avons calculé l'effet d’un repas normalisé sur le produit de référence et comparé les résultats obtenus chez deux populations ethniques, les indiens et les nord-américains. Cette approche novatrice est basée sur le raisonnement suivant: si l'effet d’un repas sur le produit de référence est le même chez les populations indienne et nord-américaine, le produit générique et sa référence qui se sont révélés bioéquivalents dans la population indienne devraient également l'être dans la population nord-américaine. Pour 90% des médicaments à l'étude, une différence statistiquement significative a été détectée entre les deux populations après un repas. Pour 30% de ces médicaments, la différence s'est révélée d'une pertinence clinique possible. Les résultats de cette étude ont mis en évidence que l’extrapolation des résultats de bioéquivalence d’une population à l’autre devrait possiblement être reconsidérée pour certains médicaments.
Les défis dans le contexte de la bioéquivalence ne se limitent pas toujours aux études pivots où la performance d’un produit générique est comparée à celle de la référence. En effet, une étude pilote peut être menée afin d’établir un protocole d’étude approprié pour cette étude pivot. Par conséquent, les résultats inexacts provenant d'une étude pilote, tels qu'une estimation imprécise du moment ou de la durée d’administration optimale de la dose lors de la comparaison du produit testé par rapport à la référence, pourront affecter négativement les résultats de l’étude de bioéquivalence. Ceci est particulièrement crucial pour les produits indiqués pour un usage topique dermatologique dont les corticostéroïdes constituent un cas d’espèce. En effet, leur bioéquivalence est démontrée par une mesure pharmacodynamique, le blanchiment cutané, à différents temps après application topique. L’intensité du blanchiment est comparée entre le produit générique et le produit de référence à une durée d’administration spécifique d’une dose donnée, la DD50, soit la durée associée à 50% de l’effet maximal
observé. Par conséquent, cette durée d’administration de la dose doit d’abord être déterminée dans le cadre d’une étude pilote. L’agence réglementaire américaine recommande l’utilisation d’une approche populationnelle basée sur la modélisation non linéaire à effets mixtes pour l'estimation de la DD50 et ce, quelle que soit la méthode d'analyse. Étant donné qu’il existe
différents types de méthodes d’analyse non linéaire à effets mixtes, chaque commanditaire peut en choisir une différente. Dans le deuxième volet de cette thèse, nous avons examiné si
les mêmes estimations de DD50 pouvaient être obtenues en utilisant différentes méthodes non
linéaires à effets mixtes. À cette fin, nous avons ajusté les données de blanchiment de la peau d’onze études avec deux méthodes non linéaires à effets mixtes différentes : le maximum de vraisemblance avec maximisation de l’espérance (MLEM) et l'estimation conditionnelle de premier ordre (FOCE). Les résultats ont favorisé MLEM, compte tenu d’une meilleure puissance discriminative pour l’estimation de la DD50 de population et d’une meilleure
minimisation de la variabilité interindividuelle.
Bien que l'approche de la bioéquivalence fondée sur la pharmacocinétique ait contribuée de manière significative au développement de versions génériques de haute qualité des formes pharmaceutiques orales indiquées pour un effet systémique, la disponibilité de versions génériques pour les produits dermatologiques topiques demeure limitée et ce, par manque de méthodes acceptées par les agences réglementaires pour l'évaluation de la bioéquivalence de ces produits. Dans le troisième volet de cette thèse, une nouvelle approche pour l’évaluation de la bioéquivalence de formulations de crème topique d’acyclovir a été développée en utilisant une analyse basée sur un modèle de données d’exposition locales récupérées à partir d’échantillons de peau abrasée prélevés à une seule durée d’administration de la dose, la DD50 à l’aide de bandes adhésives. Un seul échantillonnage de peau effectué à la
DD50 a non seulement assuré que les données pharmacocinétiques étaient recueillies à la durée
d’administration de la dose ayant le meilleur pouvoir discriminant pour détecter une différence au niveau des formulations, mais a également permis de diminuer considérablement le nombre d'échantillons à analyser. Et surtout, cette nouvelle approche a permis de générer un profil pharmacocinétique au niveau même de la peau. Ce faisant, nous avons pu utiliser l'analyse compartimentale populationnelle et contourner les nombreuses hypothèses et calculs sophistiqués requis par les méthodes précédentes. Notre approche a également permis de générer de nouveaux paramètres pharmacocinétiques permettant de décrire la vitesse et le degré d’exposition cutanée pour l'évaluation de la biodisponibilité et de la bioéquivalence topiques. Finalement, cette méthode a le potentiel de discerner une formulation bioéquivalente d’une autre qui ne l’est pas.
Mots-clés : Bioéquivalence, médicaments génériques, effet d’aliment, ethnicité, enzymes CYP, transporteurs de médicaments, analyse compartimentale de population, corticostéroïdes topiques, FOCE, MLEM
Abstract
Bioequivalence is a surrogate measure of safety and efficacy in different stages of drug development process with the most pronounced significance in the development of generic drugs. Bioequivalence, among other standards, ensures that generic drugs are equivalent to their approved innovator or reference products in terms of clinical efficacy and safety while circumventing the lengthy-time course and high cost of animal and clinical trials in patients required for innovator drugs. Despite the advancements in development of robust bioequivalence approaches over the past decades, there are still controversies in the current practice of bioequivalence. The aim of this thesis is to explore some of these controversies and address them by putting forward new and alternative approaches.
One of the most controversial issues in the current practice of bioequivalence is the extrapolation of bioequivalence study results from one population to another. The majority of bioequivalence studies for systemic effective oral dosage forms are conducted based on pharmacokinetic endpoints in healthy volunteers whilst the targeted population is patients. This is based on the assumption that if two products are bioequivalent in one population, they should be bioequivalent in another one.
The extrapolation of bioequivalence study results is not limited to that from healthy volunteers to patients. Since 2007, an ever-increasing proportion of pharmacokinetic bioequivalence studies for North American or European generic submissions have been performed in geographical/ethnic populations other than the intended ones, due to the lower cost of these studies outside North America and Europe.
In the first part of this thesis, we investigated whether the bioequivalence results obtained in one geographical or ethnic population can be extrapolated to another one. To this purpose, we extracted pharmacokinetic bioequivalence studies results from generic submissions to Health Canada and the US Food and Drug Administration. We calculated food effect for ten different reference drug products and compared the results for each product between two ethnic populations, Indians and North Americans. This is based on the reasoning that if food effect is found to be the same between the Indian and North American populations,
then the generic product and its reference that were found to be bioequivalent in the Indian population should also be bioequivalent in North American population. For 90% of the study drugs, statistically significant difference was detected in the food effect between two populations. For 30% of these drugs, the difference was found to be of possible clinical relevance. The results of this study raised a flag for extrapolating the bioequivalence results from one population to another.
Challenges in the context of bioequivalence are not always limited to the pivotal studies where the performance of a generic product is compared to that of Reference. Prior to pivotal bioequivalence studies, a pilot study may be conducted to establish an appropriate study design for the pivotal bioequivalence study. Therefore, inaccurate results from a pilot study, such as inaccurate estimation of time point or dose duration for comparison of test versus reference, can affect the bioequivalence outcomes adversely. An example to this case is the comparison of the extent of skin blanching, the pharmacological effect of generic versus reference products of topical dermatological corticosteroids at specific dose duration, DD50,
where the effect is half maximal. This dose duration should initially be determined in a pilot study. The US FDA 1995 Guidance document recommends the use of non-linear mixed effect population modeling for the estimation of DD50, irrespective of the method of analysis. Given
the availability of different types of non-linear mixed effect modeling methods, each sponsor could choose a different one. In the second part of this thesis we investigated whether the same DD50 estimates can be obtained when different non-linear mixed effect modeling
methods are used. To this purpose, we fitted the skin blanching data from eleven studies with two different non-linear mixed effect modeling methods, the Maximum Likelihood Expectation Maximization (MLEM) and the First Order Conditional Estimation (FOCE). The results favored MLEM given its lower population DD50 estimates that would locate in a more
discriminative portion of the Emax curve and better minimization of inter-individual variability.
Although the pharmacokinetic-based bioequivalence approach has contributed significantly to the development of high-quality generic versions of systemic effective oral dosage form, the availability of generic versions of topical dermatological products remains constrained due to the limited methods accepted for bioequivalence evaluation of these products. In the third part of this thesis, a novel approach for the bioequivalence assessment of
topical acyclovir cream formulations was developed based on the model-based analysis of local exposure data recovered from tape stripping of the skin at a single dose duration, DD50.
Conducting the stripping procedure only at DD50 not only ensured that the PK data was
collected at the dose duration that is most discriminative of formulation differences, but it also decreased the number of samples to be analyzed significantly. More importantly, our novel approach in generating the local PK profile in the skin (dermatopharmacokinetic profile) and the implementation of population compartmental analysis circumvented the numerous assumptions and sophisticated calculations that were inherent to previous methods, while yielding the PK parameters relevant for topical bioavailability and bioequivalence assessment (rate and extent of exposure to the skin). This method successfully concluded bioequivalence and its absence.
Keywords : Bioequivalence, Generic drugs, Food effect, Ethnicity, CYP enzymes, Drug transporters, Population compartmental analysis, Topical corticosteroids, FOCE, MLEM
Table of contents
Résumé ... i
Abstract ... v
Table of contents ... viii
List of Tables ... xiv
List of Figures ... xvi
List of Abbreviations and Symbols... xix
Acknowledgments... xxvii Preface... 29 Chapter 1 – INTRODUCTION ... 30 1. Pharmacokinetics ... 30 1.1 Liberation ... 30 1.2 Absorption... 31 1.2.1 Oral Absorption ... 31
1.2.1.1 Mechanism of oral absorption ... 32
1.2.1.1.1 Passive diffusion ... 32
1.2.1.1.2 Carrier-mediated processes ... 33
1.2.2 Percutaneous Absorption ... 35
1.2.2.1 Mechanism of percutaneous absorption... 36
1.2.2.2 Skin structures and the layers in the path of percutaneous absorption ... 36
1.2.2.3 Percutaneous absorption pathways ... 38
1.3 Distribution ... 38
1.4 Metabolism ... 39
1.4.1 Extrahepatic Cutaneous Metabolism ... 40
1.4.2 Pre-Systemic Metabolism ... 41
1.5 Excretion ... 42
1.6.1 Transporters ... 43
1.6.1.1 Transporters Governing Absorption ... 45
1.6.1.2 Transporters Governing Metabolism ... 46
1.6.2 CYP enzymes ... 47
2 Pharmacodynamics ... 50
2.1 Pharmacokinetic-Pharmacodynamics Relationships ... 50
3 Bioavailability and Bioequivalence ... 53
3.1 Bioavailability ... 54
3.1.1 Components of Bioavailability ... 56
3.1.2 Absolute and Relative Bioavailability ... 58
3.1.2.1 Absolute Bioavailability ... 59
3.1.2.2 Relative Bioavailability ... 59
3.1.3 Relative Bioavailability Studies ... 60
3.1.4 Measures of Bioavailability ... 60
3.2 Bioequivalence ... 64
3.2.1 Bioequivalence in Drug Development Process ... 66
3.2.1.1 Drug Development and Approval Process ... 66
3.3 Different Approaches to Document Bioavailability and Bioequivalence ... 71
3.3.1 PK-Endpoint Studies ... 71
3.3.1.1 Pharmacokinetic Measures ... 72
3.3.1.1.1 Non-compartmental analysis ... 74
3.3.1.1.2 Compartmental analysis ... 75
3.3.1.2 PK-Endpoint Studies under Fed Conditions ... 77
3.3.1.2.1 Food-Effect Bioavailability Studies ... 78
3.3.1.2.2 Fed Bioequivalence Studies ... 79
3.3.2 PD-Endpoint Studies ... 81
3.3.3 Comparative Clinical Trials ... 83
3.3.4 In Vitro Comparison Studies ... 84
3.3.5 Alternative Approaches ... 85
3.4.1 Pilot and Pivotal Studies ... 85
3.4.2 Bioequivalence Study General Recommendations ... 86
3.4.3 Number of subjects ... 86
3.4.4 Experimental Study Design ... 87
3.4.4.1 Crossover Design ... 87
3.4.4.2 Replicated Crossover Design ... 88
3.4.4.3 Parallel Design ... 89
3.5 Statistical Considerations of Bioequivalence ... 90
3.5.1 Clinical Pharmacology and Background ... 90
3.5.2 Two One-Sided Tests (TOST) Procedure ... 92
3.5.2.1 Construction of Confidence Interval and Data Analysis ... 94
3.5.3 Bioequivalence Interpretation ... 96
3.5.3.1 Bioequivalence ... 96
3.5.3.2 Failure to Conclude Bioequivalence (Non-bioequivalence) ... 96
3.5.3.3 Bioinequivalence... 96
3.6 Factors that Impact Bioavailability ... 97
3.6.1 Factors that Impact Pre-Absorption Processes ... 98
3.6.2 Factors that Impact Absorption ... 98
3.6.3 Factors that Impact Metabolism... 99
3.7 Mechanisms that Impact Bioavailability ... 99
3.7.1 Interaction of CYP Enzymes and Transporters with Food Constituents ... 100
3.7.2 Interaction of CYP Enzymes and Transporters with Excipients ... 104
3.7.3 Polymorphism ... 106
3.8 Impact of Pharmaceutical Excipients on Bioequivalence ... 110
4 Bioequivalence for Topical Drug Products... 113
4.1 Accepted Methods ... 114
4.1.1 PD-Endpoint Studies ... 114
4.1.1.1 Pilot Study ... 114
4.1.1.2 Pivotal Study ... 115
4.1.3 In Vitro Studies ... 116
4.2 Promising Approaches ... 117
4.2.1 DPK Approach ... 117
4.2.1.1 TEWL in DPK ... 120
4.2.1.1.1 TEWL measurement in determining full SC thickness ... 121
4.2.1.2 DPK History... 122
4.2.1.3 Different DPK methods ... 123
4.2.1.3.1 FDA Proposed method ... 123
4.2.1.3.2 Relative-Depth method ... 125
4.2.1.3.3 Two-Time method ... 127
5 Compartmental Analysis ... 130
5.1 Objective Function ... 132
5.2 Estimation Methods to Minimizing Objective Function ... 132
5.2.1 Least Squares Methods ... 132
5.2.2 Bayesian Method ... 133
5.2.3 Maximum Likelihood Method ... 133
5.3 Individual Analysis ... 133
5.3.1 Components of Individual Models... 134
5.3.1.1 Structural Model ... 134
5.3.1.2 Variance Model ... 134
5.4 Population Analysis ... 134
5.4.1 Components of Population Models ... 135
5.4.1.1 Structural Model ... 136
5.4.1.2 Variance Models ... 136
5.4.1.2.1 Level 1 random-effects... 136
5.4.1.2.2 Level 2 random-effects... 137
5.4.2 Estimation Methods in Population Analysis ... 139
5.4.2.1 The Naïve-Pooled Data Approach ... 139
5.4.2.2 The Two-Stage Approach ... 139
5.4.2.4 The Non-Linear Mixed Effect Modeling Approach ... 140
5.4.2.4.1 Expectation Maximization ... 141
5.4.2.4.2 First Order Conditional Estimation ... 142
5.4.3 Applications of Population Analysis ... 143
6 Research Hypothesis ... 145
Chapter 2 ... 148
2 Influence of Different Populations on Pharmacokinetic Bioequivalence Results: Can We Extrapolate Bioequivalence Results from One Population to Another? ... 148
2.1 Preface... 149 2.2 Article #1 ... 152 2.2.1 Abstract ... 153 2.2.2 Introduction ... 154 2.2.3 Method ... 159 2.2.4 Results ... 162 2.2.5 Discussion ... 182 2.2.6 References ... 189 Chapter 3 ... 196
3 Revisiting FDA’s 1995 Guidance on Bioequivalence Establishment of Topical Dermatologic Corticosteroids: New Research Based Recommendations ... 196
3.1 Preface... 197 3.2 Article #2 ... 200 3.2.1 Abstract ... 201 3.2.2 Introduction ... 202 3.2.3 Methods... 205 3.2.4 Results ... 210 3.2.5 Discussion ... 217 3.2.6 References ... 223
Chapter 4 ... 229
4 Novel Approach for the Bioequivalence Assessment of Topical Cream Formulations: Model-Based Analysis of Tape Stripping Data Correctly Concludes BE and BIE ... 229
4.1 Preface... 230
4.2 Article #3 ... 232
4.2.1 Abstract ... 233
4.2.2 Abbreviations ... 234
4.2.3 Introduction ... 235
4.2.4 Materials and Methods ... 238
4.2.4.1 Formulations ... 238
4.2.4.2 Experimental Procedure and Data Acquisition ... 238
4.2.4.3 Population PK Modeling... 239 4.2.4.4 Bioequivalence Evaluation ... 242 4.2.5 Results ... 242 4.2.5.1 Population PK Modeling... 242 4.2.5.2 Bioequivalence Evaluation ... 253 4.2.6 Discussion ... 254 4.2.7 Conclusion ... 264 4.2.8 References ... 269
Chapter 5 - GENERAL DISCUSSION ... 274
Chapter 6 - CONCLUSION ... 293
REFERENCES ... 296
List of Tables
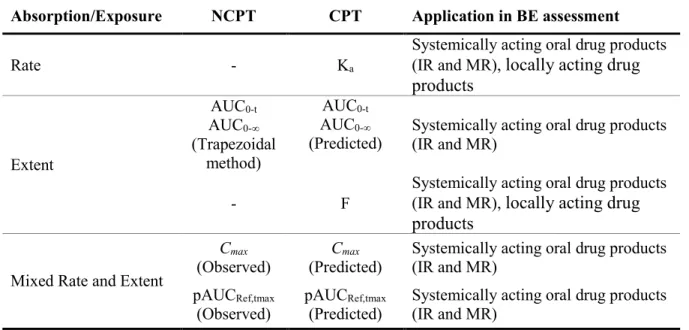
CHAPTER 1Table 1 Common bioavailability measures and their implementations in safety and efficacy………....64 Table 2 PK metrics derived from non-compartmental and compartmental analyses and their
application in BE assessment ... 77 Table 3 Interval H0 and H1 hypotheses in the TOST procedure and Type I and Type II errors.
... 93 CHAPTER 2
Table 1 Included drugs overview ... 165 Table 2 Summary Food Effect in North America and India represented as Point Estimate (PE) and 90% Confidence Intervals (CI) for AUC0-t. ... 166
Table 3 Summary Food Effect in North America and India represented as Point Estimate (PE) and 90% Confidence Intervals (CI) for Cmax. ... 171
Table 4 Heterogeneity (I2%) of Food Effect from clinical PK bioequivalence studies
conducted in North American and Indian populations ... 176 Table 5 Summary statistics of esomeprazole food effect using all available ANDS studies with Nexium® 20 and 40 mg tablets ... 177
Table 6 Summary statistics of omeprazole food effect using all available ANDS studies with Prilosec® 20 mg capsule, Losec® 20 mg tablet and capsule ... 179
Table 7 Overall summary of calculated and labeled food effects for the studied drug products and the comparison (statistical and clinical) between North American and Indian populations ... 181 Table 8 Comparison of summary food effects for the studied drug products when fixed-effect and random-effects model meta-analyses were implemented ... 186
CHAPTER 3
Table 1 PD model discrimination. ... 211 Table 2 Comparison of population mean estimates and associated inter-individual variability (CV%) of each study when different distribution profiles for PD parameters were assumed. ... 212 Table 3 Comparison of population mean estimates and associated inter-individual variability (CV%) obtained from two NLME modeling methods for each study. ... 217 CHAPTER 4
Table 1 PK model discrimination ... 244 Table 2 PK parameter estimates and their inter-individual variability (geometric CV%) following 20 mg cream application of 5% ACV (1000 µg dose) Generic a and Ref b
products for 8 min ... 246 Table 3 PK parameter estimates and their inter-individual variability (geometric CV%) following 20 mg application of 1.5% ACV BIE formulation a (300 µg dose) and 5%
ACV Ref product b (1000 µg dose) for 8 min (based on the study by Nallagundla et
al. (28), 50% of the bioavailable dose was absorbed after 8 min) ... 247 Table 4 Estimated PK parameters for BE Assessment (based on the study by Nallagundla et al. (28), 50% of the bioavailable dose was absorbed after 8 min) ... 253 Table 5 Summary of the Comparative Local Bioavailability from Population Analysis Predictions When (a) Comparing Generic vs. Ref Product, and (b) Comparing BIE Formulation vs. Ref Product ... 254 Table 6 A Summary of different DPK approaches and PK metrics for topical BA/BE assessment which were used in different studies ... 255 APPENDIX 1
Table 1 Summary of the pilot dose duration- response studies ... i Table 2 A summary of key findings from fittings with FOCE and MLEM algorithms and comparison of their general characteristics ... iv
List of Figures
CHAPTER 1Figure 1. Major mechanisms of GI absorption. ... 34
Figure 2. Structure of the skin and percutaneous absorption pathways ... 38
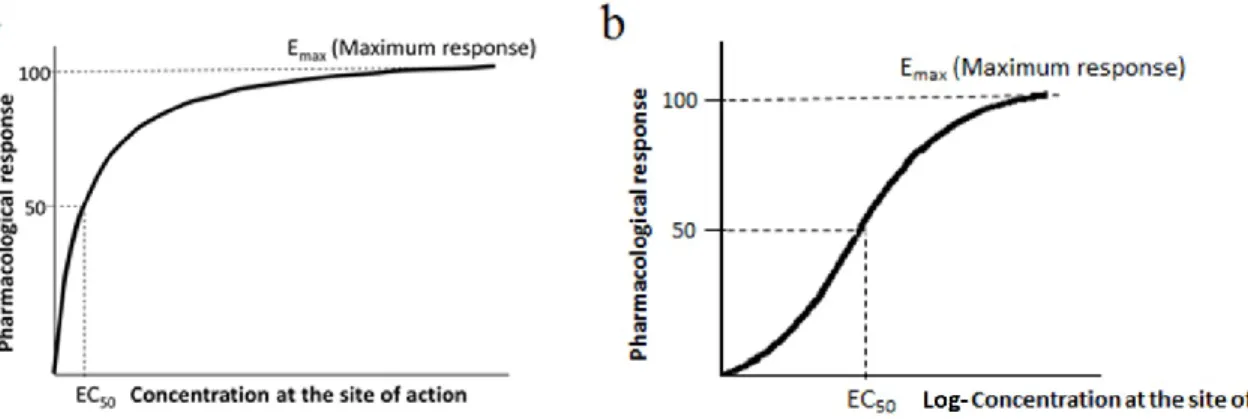
Figure 3. Plot of pharmacological response versus drug exposure ... 51
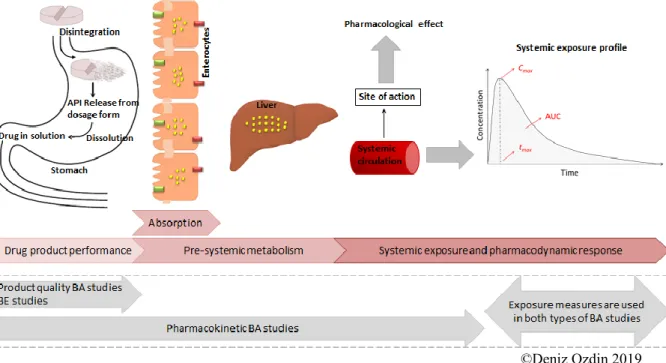
Figure 4. Applications of product quality and pharmacokinetic bioavailability studies in the clinical phase of drug development process. ... 56
Figure 5. Relative contribution of formulation factors, hepatic and intestinal pre-systemic metabolism on oral bioavailability. ... 58
Figure 6. Hypothetical plasma concentration–time curve after a single oral dose administration and derived PK metrics. ... 63
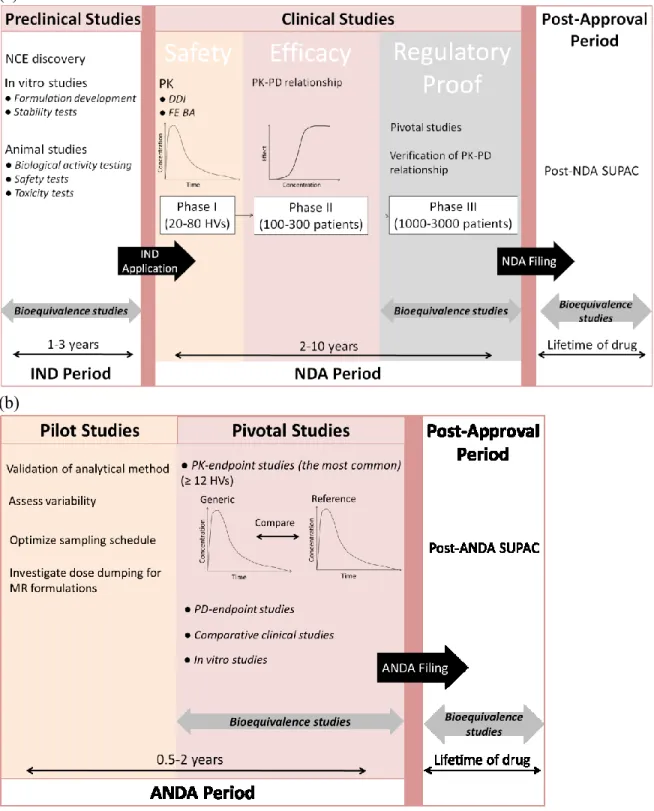
Figure 7. Schematic of the drug development and approval process ... 70
Figure 8. Pharmacodynamic response versus dose on logarithmic scale ... 82
Figure 9. Two-formulation, two-period, two-sequence crossover design. ... 88
Figure 10. Two-formulation, two-sequence, four-period crossover design (Fully replicated crossover design, TRTR/RTRT). ... 89
Figure 11. Two-formulation, three-sequence, three-period crossover design (partially replicated crossover design, TRR/RTR/RRT). ... 89
Figure 12. Two-group parallel design. Test, Test treatment; Ref, Reference treatment. ... 90
Figure 13. Decomposition of the Two One-Sided Tests procedure and the conventional equivalence interval ... 94
Figure 14. Possible bioequivalence study results. ... 97
Figure 15. Removal of a layer of stratum corneum with an adhesive tape strip... 118
Figure 16. Determination of full thickness of the stratum corneum using Trans Epidermal Water Loss. ... 121
Figure 17. Schematic representation of the traditional DPK approach for BE assessment between the test and reference formulations. ... 124
Figure 19. Schematic representation of the Relative-Depth method for BE assessment between the test and reference formulations. ... 126 Figure 20. Schematic representation of the Two-Time method for BE assessment between the test and reference formulations. ... 128 Figure 21. Schematic representation of our proposed DPK approach for BE assessment between the test and reference formulations. ... 129 Figure 22. The error Ɛi between predicted and observed concentration ... 131 Figure 23. Demonstration of inter-individual variability (ηi) for estimated PK parameters from
population compartmental analysis. ... 137 Figure 24. Demonstration of observation-level random error, Ɛi,j, on PK profiles from
population compartmental analysis ... 138 Figure 25. Comparison of iterative processes of EM versus FOCE methods. ... 143 CHAPTER 2
Figure 1. The hypothetical outcomes of performing pharmacokinetic bioequivalence (BE) studies in a population with different levels of expression or activity of CYP enzymes and/or transporters (Population 1) than the one intended to be marketed for (Population 2), and extrapolation of the bioequivalence study results. ... 157 Figure 2. An example illustrating the same food effect between two ethnic/geographical populations despite different bioavailabilities of drug products under altered physiological conditions (Fed vs. Fasted; Population 1 vs. Population 2) when they are bioequivalent in both populations (Fed vs. Fasted; Population 1 vs. Population 2). ... 158 Figure 3. Study flow diagram. ... 163 CHAPTER 3
Figure 1. The histogram of population PD estimates for study 1 (n=23). ... 214 Figure 2. Ratios of arithmetic and geometric mean to the median of post-hoc PD estimates..
... 215 Figure 3. Dispersion of the ratios of “PD estimates from MLEM versus PD estimates from FOCE” within the acceptance range of 0.80-1.25. ... 216
Figure 4. Dispersion of the ratios of residual variability of the model within the range of 0.80-1.25 when the FOCE versus MLEM method was used. ... 219 CHAPTER 4
Figure 1. Structural representation of the simplest and most complicated models, as well as the final PK model. ... 243 Figure 2. Goodness-of-fit plots for the final population PK model ... 249 Figure 3. Individual fitted (squares) and observed (circles) amount vs. time profiles of ACV in stratum corneum after 8 min topical administration ... 250 Figure 4. Visual predictive checks of the PK model for ACV recovered amount after topical administration of cream formulations ... 252 APPENDIX 1
List of Abbreviations and Symbols
Abbreviation DefinitionA Surface area
+δ Upper limit of equivalence interval ∆C Concentration difference
ABC ATP-Binding Cassette ABE Average Bioequivalence
ACV Acyclovir
AIC Akaike Information Criterion ANDA Abbreviated New Drug Application ANDS Abbreviated New Drug Submission ANOVA Analysis of Variance
API Active Pharmaceutical Ingredient ATP Adenosine TriPhosphate
AUC Area under the concentration time curve
AUC0-inf Area under the concentration time curve from time 0 to infinity
AUC0-ꝏ Area under the concentration time curve from time 0 to infinity
AUC0-t Area under the concentration time curve from time 0 to the last measurable
concentration, t
AUC0-tau Area under the concentration time curve from time 0 to the end of the dosing
interval
pAUCRef,tmax Partial area under the concentration time curve from time 0 to the population
median of tmax of the Reference
AUCt-inf Area under the concentration time curve from the last measurable
concentration, t, to infinity AUEC Area Under the Effect Curve BA Bioavailability
BCRP Breast Cancer Resistance Protein
BCS Biopharmaceutics Classification System
BE Bioequivalence
BIE Bioinequivalence
BMSR Biomedical Simulations Resource
C Concentration
CI Confidence Interval
CL Clearance
Cmax Maximum (observed) concentration
Cobs,i ith observed concentration in individual
Cpred,i ith predicted concentration in individual
CPT Compartment(al)
CR Controlled-Release
Ct Last measurable concentration
CV Coefficient of Variation
CV% Percent Coefficient of Variation
D/L2 Drug diffusivity across the stratum corneum of thickness L
DD50 Dose duration which produces 50% of maximal response
DDI Drug-Drug Interaction
DV Observation
E Extraction ratio
EA Fraction of drug that is not absorbed further to drug release from dosage form
EC50 Drug concentration which produces 50% of maximal response
ED50 Dose which produces 50% of maximal response
EG Intestinal extraction ratio
EH Hepatic extraction ratio
EM Expectation-Maximization EMA European Medicines Agency
Emax Maximum effect
ER Extended-Release
E-step Expectation step
Ɛi
Epsilon: error term describing difference between predicted and observed concentrations
Ɛi,j Distribution of differences between the observed and predicted
concentrations: residual variability
F Bioavailability
ƒ Function
Fabs Fraction of the drug dose absorbed
Fabsolute Absolute bioavailability
FDA Food and drug administration
FE Food Effect
FG Intestinal availability
FH Hepatic availability
FO First Order
FOCE First Order Conditional Estimation
FOCE-I First Order Conditional Estimation with Interaction Foral Oral bioavailability
Frel Relative bioavailability
FS Extent of input into the skin GI Gastrointestinal
GMR Geometric Mean Ratio
GOF Goodness-of-Fit GTS Global Two-Stage h Hour H0 Null hypothesis H1 Alternative hypothesis HC Health Canada HV Healthy Volunteers
I2 Indice of heterogeneity in terms of percentage
IMP Importance Sampling Parametric Expectation Maximization IND Investigational New Drug Application
Inter-CV% Inter-individual variability IOV Inter-Occasion Variability IPRED Individual-level predictions
IR Immediate-Release
ITS Iterative Two-Stage IV Intravenous(ly)
IVIVC In Vitro–In Vivo Correlation IVRT In Vitro Release Test
J Rate of passive diffusion or flux
K Lipid–water partition coefficient of drug in the biologic membrane ka Absorption rate constant
kcal Kilocalorie
Kdiff Diffusion rate constant
Kel Apparent terminal elimination rate constant estimated noncompartmentally
Kij Transfer rate constants from compartment “i" to compartment “j”
Kin First-order input rate constant into the skin
Kout Diffusion rate constant out from the last compartment
Kp Permeability coefficient
LADME Liberation, Absorption, Distribution, Metabolism. Excretion
LL Log-likelihood
LLCI Lower Limit of Confidence Interval
Ln Natural logarithm; Logarithm to the base of e
Log Logarithm
LSM Least Squares Means
m Mass
MAP Maximum a posteriori Probability
MCPEM Monte Carlo Parametric Expectation Maximization MDR Multidrug Resistance
min Minute
ml Milliliter
MLEM Maximum likelihood expectation maximization MOF Minimum value of Objective Function
MR Modified-Release
MRP Multidrug Resistance Protein M-step Maximization step
n Number of total observations NCE New Chemical Entity
NCPT Non-compartmental
NDA New Drug Application NDS New Drug Submission NIH National Institutes of Health NLME Non-Linear Mixed Effect NME New Molecular Entity
NONMEM Non-Linear Mixed Effect Modeling OAP Organic Anion Transporter
OATP Organic Anion Transporting Polypeptide OCT Organic Cation Transporter
OF Objective Function OGD Office of Generic Drug OLS Ordinary Least Square
OMAP Maximum a posteriori probability objective function OOLS Ordinary least square objective function
OWLS Weighted least squares objective function pAUC Partial Area Under the Curve
PD Pharmacodynamic
PE Point Estimate
PEG Polyethylene Glycol PEPT Peptide Transporter P-gp Permeability glycoprotein
PK Pharmacokinetic PKa Measure of acidity
PM Poor metabolizer
PRED Population-level prediction
Q Amount
Qmax Maximum amount
QRPEM Quasi-Random Parametric Expectation Maximization
Qtotal(clearance) Total amount of drug extracted from stratum corneum during the clearance
phase
Qtotal(uptake) Total amount of drug extracted from stratum corneum during the uptake phase
Ref Reference
RLD Reference Listed Drug
SABE Scaled Average Bioequivalence
SAEM Stochastic Approximation Expectation Maximisation
SC Stratum corneum
SD Standard Deviation shη η-shrinkage
SLC Solute Carrier
SLS Sodium Lauryl Sulfate
SNP Single Nucleotide Polymorphism SR Sustained Release
STS Standard Two-Stage
SUPAC Scale-Up and Post-Approval Change
t Time
TE Therapeutic Equivalence TEWL Trans Epidermal Water Loss
tmax Time to reach maximum (observed) concentration
TOST Two One-Sided Tests
TS Tape stripping
ULCI Upper Limit of Confidence Interval
US United States
Vd Volume of distribution
Wi Weighting factor
WLS Weighted Least Squares WRES Weighted Residuals
α Probability of committing a Type I error of a statistical test β Probability of a Type II error
γ Hill coefficient
-δ Lower limit of equivalence interval
ηi Eta: Difference between population and individual parameter value
θ Theta: population (mean) model parameter estimate
λz Terminal elimination rate constant estimated compartmentally
μ Micro
μR Mean bioavailability measure for reference
μT Mean bioavailability measure for test
ρ Density
Σ Sigma variance covariance matrix
σ2 Error variance
σ2
pooled Pooled error variance
τ2 Indice of heterogeneity in terms of variance
To my parents, Azita and Fikret, for your unfailing faith, support, and love throughout my life. To my husband, Artin, who changed my life to something even better with his affection and sense of humor. To Faculté de pharmacie, Université de Montréal, a sanctuary where the experience of learning could not have been more joyful.
Acknowledgments
“Success is not final, failure is not fatal: it is the courage to continue that counts.” - Winston Churchill The greatest debt is owed to my Ph.D. director, Murray Ducharme, and my co-director, France Varin. Your generosity with both time and scientific knowledge, caring for my best, and your strong support in turbulences of this period were nothing short of those of a parent. Your support and dedication in helping me in this process were beyond the job description of a supervisor. The whole period was a memorable journey that I will always remember with a smile on face and love in heart to both of you.
Thank you, Murray, for accepting my supervision despite your intense workload. With your work discipline, pace of work without compromising the quality, and critical thinking shaped me into a better researcher. I now truly believe in your motto “A good supervisor is a tough supervisor”, and I deeply appreciate the balance you created by both exposing me to challenges and supporting me. I thank you for your patience in explaining the notions to me when I had trouble absorbing them, and for all the brainstorming you did with me. Your supervision has been invaluable.
Thank you France for your constant unsparing support and sympathy that made this such a pleasant period beyond my expectations, not to mention your dedication, the very reason that opened the door of this Ph.D. Your composure and patience have always made me feel comfortable to discuss things without reservations, your saying “You should be as comfortable with your project as you could discuss them over a glass of wine” indulged me to work harder with the hope to reach there, and your challenging questions have always helped me to dig deeper and speculate better.
Thank you to Anders Fuglsang, for accepting to be a member of my consulting committee, whose regulatory experience has always helped me to think more practically.
I would also like to extend my gratitude to all faculty members, especially Céline Fiset and Denis DeBlois, who have always enlightened the paths for academic excellence opportunities. Without your dedication to students’ lives, I would not be able to accomplish my trainings in France.
I extend my special appreciation to my former supervisor, now a very dear friend, Claude Léveillée, who has always inspired me with his elegance, clairvoyance, professionalism, and dedication to work.
I would like to thank Corinne Seng Yue for her unwavering generosity in explaining scientific concepts throughout my Ph.D. and her constant availability. My appreciations also go to my friends at Learn and Confirm, especially Philippe Colucci, and friends at the faculty, especially Fady Thomas, Sara Soufsaf, and Guillaume Bonnefois, who have been the source of youth and vivacity. Thank you for having scientific discussions, challenging me, besides changing the most desperate moments of our PhD to fun moments.
My sincere appreciation to my mom Azita, who has always supported me with her unconditional love, her presence in my dark days and her enthusiasm in my achievements. Your presence in my life is invaluable. This journey would not have been possible without the values you taught me.
Lastly, my deepest appreciation to my husband Artin, the most affectionate companion I could ever have. This labor of love would not have been possible without the encouragement and support of Artin, whose patience and understanding have always embraced me.
Preface
Reliance on bioequivalence studies has accelerated the development of high-quality generic drug products with extraordinary cost savings. The ultimate goal of bioequivalence studies in generic drug development is to ensure that the generic product has equivalent safety and efficacy to its reference, and therefore, the generic is interchangeable with the reference counterpart. Nevertheless, there are insufficiently studied areas that require further studies to ensure the safety and efficacy of approved generic products, along with the fields where the demonstration of bioequivalence is associated with difficulties. This thesis aimed to identify some of these areas with the purpose of answering outstanding question marks and proposing novel alternative approaches for demonstration of bioequivalence where needed.
One of the most controversial issues in the practice of bioequivalence is the reliability of bioequivalence study results obtained in populations other than the targeted ones. Another outstanding issue is the uncertainties associated with the estimated values of the dose duration at which the bioequivalence of topical dermatological corticosteroids must be evaluated. Eventually, lack of cost-effective, reproducible and surrogate-based approaches for bioequivalence assessment of topical dermatological products is another challenge that needs to be addressed in the context of bioequivalence.
To better illustrate the relevance and significance of the research presented in this thesis, basic principles of pharmacokinetics, pharmacodynamics, bioequivalence, and compartmental modeling are first discussed in the introduction of this thesis.
After describing the context in which the research presented herein has evolved, the following articles are presented individually:
1) Influence of Different Populations on Pharmacokinetic Bioequivalence Results: Can We Extrapolate Bioequivalence Results from One Population to Another? 2) Revisiting FDA’s 1995 Guidance on Bioequivalence Establishment of Topical
Dermatologic Corticosteroids: New Research Based Recommendations
3) Novel Approach for the Bioequivalence Assessment of Topical Cream Formulations: Model-Based Analysis of Tape Stripping Data Correctly Concludes BE and BIE
Chapter 1 – INTRODUCTION
1. Pharmacokinetics
Pharmacokinetics (PK) is the discipline that describes “what the body does to the drug” and it involves the study of the liberation, absorption, distribution, metabolism, and excretion of drugs and are often referred to collectively as “LADME”[1]. Whether or not a drug’s PK includes all of these steps depends on its route of administration. Oral and topical routes of administration are the main focus of this thesis.
Oral administration is the most convenient route for access to the systemic circulation for systemic effective drug products. Topical routes of administration on the other hand are generally used for the purpose of local drug action. Topical administration is employed to deliver a drug substance at, or immediately beneath, the point of application, prior to reaching systemic circulation. A large number of topical medicaments are applied to the skin, although topical drugs are also applied to the eye, nose, throat, ear, vagina, and certain mucous membranes. In the context of this thesis, topical drugs refer to those administered to the skin [2].
In this chapter, each of the LADME steps will be discussed separately. Due to the relevance of absorption and metabolism to the focus of this thesis these topics are discussed more extensively.
1.1 Liberation
The liberation of a drug from its pharmaceutical dosage form is a critical first step in a drug’s disposition pathway. Following oral dosing, the drug product is disintegrated, the active ingredient is released from the solid dosage form (tablet, capsule, etc.), and dissolves in gastrointestinal (GI) tract. These steps are referred to as “drug product performance” and are inherently determined by the formulation. Once the drug substance is dissolved, it will be available to be absorbed across intestinal cell membranes into the systemic circulation. Drug product performance is, therefore, one step before drug absorption and constitutes a key parameter in bioequivalence studies [3].
1.2 Absorption
When a drug is administered by an extravascular route (e.g., oral, intramuscular, transdermal, etc.), the drug must first be absorbed into the systemic circulation and then diffuse or be transported to the site of action before eliciting biological and therapeutic activity.
In order to be absorbed, drug molecules must pass through several biologic membranes before reaching the vascular system. If the drug is given orally, the drug molecules must pass through the GI tract wall into capillaries. For transdermal patches, the drug must penetrate the skin to enter the vascular system. Drugs administered intravenously bypass this step, since they are injected directly into the bloodstream, and therefore, will readily become available in systemic circulation without a need to pass biologic membranes.
In general, there are differences as well as similarities among the mechanisms and the various membranes through which a drug may pass to gain access to the systemic circulation. In the following subsections, the process of absorption and different factors influencing absorption will be discussed in more details. Because the drugs studied in the context of this thesis were administered orally and topically, their process of absorption for each route will be discussed in more details.
1.2.1 Oral Absorption
Orally administered drugs must be absorbed first from the GI tract. Absorption refers to the passage of drug molecules from the site of administration, the intestinal lumen, into the enterocytes [4]. The first major obstacle to cross in oral absorption is the intestinal epithelium which consists of enterocytes. Apical surface of enterocytes faces the lumen (apical membrane) while the basolateral surface faces the surrounding fluids which lead to the blood (basolateral or basal membrane) [5]. Transcellular absorption from lumen to blood requires uptake across the apical membrane, followed by transport across the cytosol, then exit across the basolateral membrane and into blood [6].
Lipophilic compounds may readily cross the enterocyte by a means of passive diffusion down the concentration gradient (from a high concentration in the luminal fluid to a low concentration in enterocyte, and then into the portal blood), in the absence of specialized transport systems. Passive diffusion is the most common mechanism of absorption across the
intestinal membrane which is based on the principles of Fick’s First Law applied to membranes. In fact, classical explanations of the rate and extent of drug absorption have been based on the Fick’s First Law [4]. However, not all compounds can cross enterocytes by passive diffusion. Highly hydrophilic and charged compounds often require specific carrier-mediated pathways to facilitate transcellular transport. During the past decades, many studies have revealed the significance of carrier-mediated processes in the passage of drugs through biological membranes and in regulating the absorption. Other mechanisms such as vesicular transport with relatively less contribution could also be involved in the absorption across biologic membrane. Vesicular transport, in different forms such as endocytosis and pinocytosis, is the process of engulfing particles or dissolved materials by the cell. This mechanism of transport is beyond the scope of this thesis and will not be described any further. In the following subsection, only the major mechanisms involved in drug absorption and their principles are discussed in more detail.
1.2.1.1 Mechanism of oral absorption
Absorption mostly occurs via passive diffusion and carrier-mediated transport processes. Carrier-mediated transport can be divided into facilitated and active transport [7, 8].
1.2.1.1.1 Passive diffusion
Drug absorption by passive diffusion occurs down its concentration gradient and can be expressed using Fick’s First Law applied to membranes, where drug flux across a membrane is directly proportional to the magnitude of the concentration gradient across the membrane. Drug flux also depends on characteristics of the membrane as well as the permeability and solubility (physicochemical properties) of the absorbed compound. For an orally administered drug, drug flux across a membrane refers to the rate that dissolved drug crosses the intestinal wall to reach the portal blood circulation, in other words, the rate of absorption [4, 7, 9]. The rate of absorption via passive diffusion through the biological membranes can be described most simply by Fick’s First Law [10]:
J = 𝑑𝑄
𝑑𝑡
=
(𝐷𝐾𝐴)∆𝑪
where J or 𝑑𝑄
𝑑𝑡 is the rate of passive diffusion; D is the diffusion coefficient of drug in membrane which represents the amount of a drug that diffuses across a membrane of a given unit area per unit time when the concentration gradient is unity; K is lipid–water partition coefficient of drug in the biologic membrane that controls drug permeation; A is the surface area of membrane; and h is the diffusion path length across the membrane; ΔC is the drug concentration gradient across the membrane. D, K, A, and h can be combined and referred to as permeability coefficient:
Kp = 𝐷𝐾𝐴
ℎ
Obviously, this concentration gradient for an orally administered drug will be the concentration of the drug in luminal fluid minus that in cytosol in apical surface; or the concentration of the drug in cytosol minus that in portal blood at basolateral surface. Because the drug distributes rapidly into a large volume after entering the blood, the concentration of drug in the blood initially will be quite low with respect to the concentration at the site of drug absorption. The large concentration gradient is maintained until most of the drug is absorbed, thus driving drug molecules from the gastrointestinal tract (site of absorption) into the plasma hypothetically in a unidirectional manner. However, in reality, the process of absorption is rather complicated and is not unidirectional due to the carrier-mediated processes.
1.2.1.1.2 Carrier-mediated processes
Carrier-mediated transport could occur either by facilitated diffusion or by active transport [7, 8]. Active transport and facilitated diffusion are similar in that both are mediated by membrane-associated transporters (pump); they are saturable; and they are usually selective for certain drugs or nutrients. They differ in the direction of the transport and their requirement for energy [11].
Facilitated diffusion
Facilitated diffusion is performed by diffusion down a concentration gradient and does not require input of energy. In terms of drug absorption, facilitated diffusion seems to play a very minor role and only transports a molecule along its electrochemical gradient.
Active transport
Active transport is performed against the concentration gradient of drug molecules. The transport will be in ‘‘up a concentration gradient” direction which is not favored thermodynamically and, hence, does not occur spontaneously and requires input of energy. The input of energy is commonly supplied by coupled biochemical reactions such as ATP hydrolysis. The active transport pathway is mediated by transporters which are categorized into two major classes – efflux and uptake transporters [11]. The presence of transporters in membranes modulates the traditional theory of unidirectional diffusional absorption towards bidirectional absorption. The role of transporters in governing the absorption is described in more detail in Section 1.6.1.1. An overview of the involved mechanisms in absorption is depicted in Figure 1.
Figure 1. Major mechanisms of GI absorption. OATP, Organic Anion Transporting Polypeptide; OAT, Organic Anion Transporter; OCT, Organic Cation Transporter; PEPT, Peptide Transporter; P-gp, P-glycoprotein; BCRP, Breast Cancer Resistance Protein; MRP, Multidrug Resistance Protein.
1.2.2 Percutaneous Absorption
Drug products applied to the skin surface are categorized into two major classes of topical and transdermal formulations [12-14].
Topical (i.e., dermatological, herein) formulations are not designed to deliver the drug into the systemic circulation. They are rather designed to release drug that penetrates to some extent into the skin layers, where the pharmacological effect is expected. Therefore, the permeation process is expected to stop at the diffusion step through the skin layers, before reaching the cutaneous circulation [15].
The process of drug permeation through different layers of the skin to eventually reach the targeted site within the skin is referred to as input into the skin. Topical formulations are designed to deliver drug into the various layers of skin and exert a local effect in the skin for treating dermal disorders such as acne, dermatitis, erythematous lupus, and psoriasis, and are not designed for delivery of drug into the systemic circulation [12, 16]. Depending on the disease condition the target site for the topical product will vary. For example, in treatment of fungal infections a drug has to exert effect in stratum corneum; for management of eczema and psoriasis drug action is needed in the viable epidermis; and amelioration of muscle strains and sprains requires penetration to the deeper tissues [13].
Transdermal formulations, on the other hand, release drug that permeates through the skin and enters the systemic circulation. The process of drug permeation through all layers of the skin to reach the systemic circulation is referred to as percutaneous absorption. Transdermal formulations are designed to ensure that effective plasma concentrations of drug are reached for producing the systemic effect [14, 16, 17].
Topically applied drug products studied in the context of this thesis are topical dermatological formulations with local effect. Hence, the expression “percutaneous absorption” refers to “input into the skin” in the context of this thesis. The mechanisms and pathways of percutaneous absorption is the same for topical and transdermal formulations. The notion of input for topical versus absorption for transdermal formulations is discriminated only based on the last layer through which the drug permeates. In the following subsections mechanisms and pathways of percutaneous absorption are described.
1.2.2.1 Mechanism of percutaneous absorption
Percutaneous absorption, in the simplest way, can be considered as the permeation of drugs through the skin layers. Percutaneous absorption can alternatively be referred to as percutaneous transport. The general principles of percutaneous absorption are similar to those for oral absorption. From a pharmacokinetic standpoint, permeation of drug, through all percutaneous absorption pathways (section 1.2.2.3), occurs via passive diffusion on the basis of Fick’s First Law [14, 18].
Some influx and efflux transporters such as Organic Anion Transporting Polypeptide (OATP), Multidrug Resistance protein (MDR), and Permeability glycoprotein (P-gp) have also been found in skin cells (keratinocytes), but their contribution to percutaneous absorption is negligible in comparison to passive diffusion [19].
The kinetics of percutaneous absorption differs from the oral one, mostly due to the different physiology and anatomy of barriers in percutaneous absorption. In oral absorption of drug, enterocytes are the only line of defense that a drug has to overcome to be absorbed. In percutaneous absorption, however, drug has to pass different layers of the skin until it reaches the dermis layer. Permeation to dermis brings a drug in contact with lymphatics and cutaneous microcapillaries which eventually open to the systemic circulation. In the following section, different layers of skin which should be overcome in the path of percutaneous absorption are described.
1.2.2.2 Skin structures and the layers in the path of percutaneous absorption
Human skin is a stratified tissue composed of three different layers, which are from the top to the bottom: epidermis, dermis, and hypodermis (or subcutaneous tissues) [20].
Epidermis
Barrier functions of the skin largely confined to the epidermis, and more specifically to the outermost layer of the epidermis, stratum corneum (SC). From a skin permeation viewpoint, SC provides the main and the first (mechanical) barrier of the skin. Once drug molecules are able to pass through the SC, the rest of the epidermis provides little resistance. However, the skin’s barrier function does not only depend on the SC; but it is also determined by the second (biological) skin barrier formed of enzymes mainly in the viable epidermis [14, 21, 22].
Stratum corneum arises from the sequential differentiation of keratinocytes migrating from the basal epidermal layer (stratum basale) to the surface, ending as corneocytes in the SC. Stratum corneum is also known as the horny layer of the skin. The total thickness of SC is 10-25 μm [14, 20, 23]. Stratum corneum can be described as a brick wall-like structure with corneocytes as the “bricks” in a matrix (the “Mortar”) of intercellular lipids. These cells are high density, low hydration hexagonal flattened dead cells without a nucleus and full of keratin. SC consists of about 10-15 tightly stacked layers of corneocytes. Corneocytes are embedded in a lipidic intercellular matrix, mainly composed of ceramides, long-chain free fatty acids and cholesterol [21, 23-25]. Corneocytes are held together by corneosomes that are specialized inter-corneocyte linkages formed by proteins and, together with the lipids, they maintain the integrity of the SC [26-28].
Living epidermis (viable epidermis) comprises of metabolically active cells and is the main location of enzymatic biotransformation of dermally applied drugs. Enzymatic biotransformation of drugs in the skin will be described in more detail in Section 1.4.1. Viable epidermis is further divided into 3 layers: stratum granulosum, stratum spinosum, and stratum basale from the surface towards the deeper layers. The total thickness of viable epidermis is about 100 μm [29]. Keratinocyte are held together by desmosomes in the viable epidermis. Both cohesion and the number of desmosomes increase from the surface towards the deeper layers of epidermis which result in the looser packing of corneocytes in the SC and tighter packing of keratinocyte in the deeper layers [30, 31].
Dermis
The dermis provides mechanical strength and flexibility to the skin. Dermis is composed collagen and elastin. Hair follicles and sebaceous glands originate in the dermis and have follicular ducts extending through the epidermis to the skin surface. The dermis also contains large numbers of lymphatics and blood vessels. The capillary plexus between the epidermis and dermis is the major site of cutaneous absorption to the systemic circulation [32].
Hypodermis
Hypodermis or subcutaneous tissue refers to the adipose tissue with nerves and blood vessels lying beneath the dermis [33].
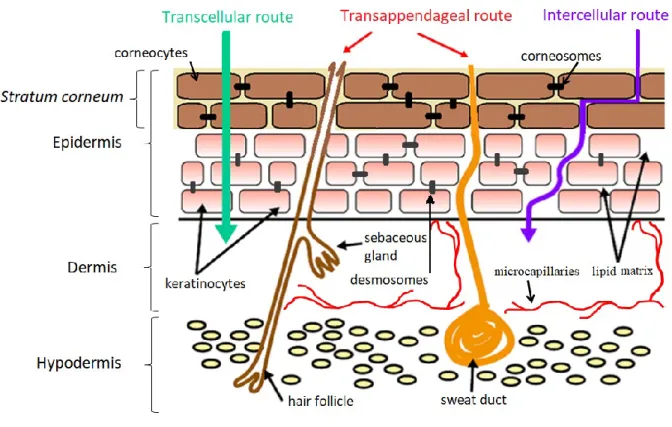
1.2.2.3 Percutaneous absorption pathways
The permeation of drugs through the skin occurs via passive diffusion through three pathways: (a) the corneocytes (transcellular route), (b) the lipid matrix between the corneocytes (intercellular route), and (c) the appendages. i.e., hair follicle, sweat and sebaceous glands which form shunts opening to the skin surface (follicular or transappendageal route). These pathways are not mutually exclusive, with most compounds permeating the skin through a combination of pathways based on the physicochemical properties of the permeating molecule. In general transcellular and intercellular routes are the major pathways in percutaneous absorption and the contribution of transappendageal route is considered to be minimal [18, 32]. Structure of the skin and percutaneous absorption pathways are schematized in Figure 2.
Figure 2. Structure of the skin and percutaneous absorption pathways
©Deniz Ozdin 2019 modified from [34]
1.3 Distribution
After a drug is absorbed systemically from the site of administration, they are carried by the blood and will pass from the bloodstream into various tissues and organs. Drugs may
bind to various macromolecular components in the blood, including albumin, α1-acid
glycoprotein, lipoproteins, immunoglobulins, and erythrocytes [35]. Binding to macromolecular components in the blood plays a critical role in drug distribution, since generally only free (unbound) drug is able to cross membranes and reach specific tissues. When drug molecules are delivered to the target sites, they produce targeted pharmacological effect; when they are delivered to other tissues, they may cause side effects or adverse reactions; and when they are distributed to eliminating organs, such as the liver and kidney, they will be eliminated from the body [36]. The topic of drug distribution is beyond the scope of this thesis.
1.4 Metabolism
Metabolism is the chemical conversion of the drug molecule, usually by an enzymatically mediated reaction, into another chemical entity referred to as a metabolite. The metabolite may have the same or different pharmacological effect as the parent drug. More often, the metabolites are either pharmacologically inactive or less active than the parent substance. Drug metabolism is also referred to as biotransformation [37].
Metabolism is divided into phase I and II processes. In phase I, the drug undergoes oxidation, reduction, and hydrolysis that introduce a polar functional group on the drug molecule. Metabolites produced by phase I reactions are rarely of sufficient polarity to undergo the excretion, and many require additional metabolism by phase II enzymes [38]. Catalases, peroxidases, reductases, cholinesterases, dehydrogenases are some examples of Phase I enzymes. However, the CYP superfamily is the major family of enzymes that is responsible for phase I reactions.
In phase II, a polar moiety is usually added into either the parent molecule or its phase I metabolites. The resulting polar metabolites are then excreted from the body through urine or bile, or in some cases sweat or exhalation. Phase II processes involve conjugation of specific endogenous compounds to drugs or their metabolites. For orally administered drugs, the liver and intestine are the principal sites of drug metabolism where both phase I and phase II reactions take place, and therefore, they are also the potential sites for different interactions, such as drug-drug and food-drug interactions [37, 39].
1.4.1 Extrahepatic Cutaneous Metabolism
Metabolism also occurs in extrahepatic organs such as the skin. Nevertheless, the extent of this metabolism is most often negligible. CYP enzymes are among the most studied drug metabolizing enzymes in the skin. Which of the CYP enzyme isoforms are present in human skin has still not been clarified and contradictory data are available in the literature. Among various CYPs, the presence of CYP2E1 enzymes has frequently been reported in keratinocytes, melanocytes, and Langerhans cells in the epidermis, and fibroblasts in the dermis [19, 40, 41]. CYP1A1, CYP1A2, CYP2C9, CYP2D6, and CYP3A4 are other CYP enzymes reported to be found in the skin [42-44].
CYP enzymes in the skin mediate the biotransformation of endogenous and exogenous substrates such as therapeutic drugs, fatty acids, retinoids, steroids including vitamin D, and glucocorticoids [45]. In general, biotransformation of substrates by CYP enzymes in the skin results in protection of the body from external factors or detoxification of xenobiotics. For instance, hydroxylation of vitamin D3 to calcitriol, the most active form of vitamin D3, is essential in offsetting the toxic effects of UV exposure and is mediated by the CYP enzymes in the skin [45-47]. Nevertheless, a number of examples also exist where certain substrates which themselves are not harmful can be biotransformed by cutaneous CYP into ultimate carcinogens. The CYP enzymes in the skin (e.g., CYP1A1) mediate the metabolic activation of polycyclic aromatic hydrocarbons (e.g., benzo(a)pyrene) and form reactive intermediates which can interact with tissue macromolecules, and this interaction is ultimately responsible for inducing skin carcinomas [45, 48-50].
The pharmacological effect of topical and transdermal drugs can theoretically be reduced as the active ingredient passes through the skin layers and may therefore undergo the cutaneous metabolism by CYP and other metabolizing enzymes [19]. For instance, Duell et al. [51] have shown that topical retinoic acid is converted to the less active metabolites 4-OH retinoic acid and 4-oxoretinoic acid, which could limit the pharmacological activity of retinoic acid. Cutaneous metabolism of nitroglycerine by CYP enzymes has also been suggested [52, 53]. However, no data to date has robustly demonstrated whether or not the biotransformation of topical and transdermal products by cutaneous enzymes is of clinical relevance.
In order to overcome cutaneous metabolism, even if its clinical relevance has not yet been documented, prodrugs can be promising. Numerous attempts have been directed to