HAL Id: hal-00389192
https://hal.archives-ouvertes.fr/hal-00389192
Submitted on 28 May 2009
HAL is a multi-disciplinary open access
archive for the deposit and dissemination of sci-entific research documents, whether they are pub-lished or not. The documents may come from teaching and research institutions in France or abroad, or from public or private research centers.
L’archive ouverte pluridisciplinaire HAL, est destinée au dépôt et à la diffusion de documents scientifiques de niveau recherche, publiés ou non, émanant des établissements d’enseignement et de recherche français ou étrangers, des laboratoires publics ou privés.
Application of the multiresolution wavelet
representation to non-cooperative target recognition
Christian Brousseau
To cite this version:
Christian Brousseau. Application of the multiresolution wavelet representation to non-cooperative target recognition. RADAR’2009 - International Radar Conference, Oct 2009, Bordeaux, France. pp.1. �hal-00389192�
APPLICATION OF THE MULTIRESOLUTION WAVELET
REPRESENTATION TO NON- COOPERATIVE TARGET RECOGNITION
Brousseau Christian
IETR
Université de Rennes 1
Campus de Beaulieu
35042, Rennes Cedex, France
christian.brousseau@univ-rennes1.fr
Abstract—In this paper, the problem of efficient
representation of large database of target radar
cross section is investigated in order to minimize
memory requirements and recognition search
time, using wavelet representation. Synthetic
RCS of large aircrafts, in the HF-VHF frequency
bands, are used as experimental data. Many
parameters are evaluated like mother wavelet,
decomposition level, and classification
parameters. Criteria used to determine the
efficiency of multiresolution representations are
compression scores, false identification rate and
search time.
Keywords-High resolution radar, non-cooperative target recognition, radar cross section, wavelet, multiresolution representation.
I. INTRODUCTION
Requirements for future air defence radar systems are detection, localization, but also identification of aircrafts. With the increasing resolution of modern radar systems, it is theoretically possible to store much information, according to aspect, elevation, pulsewidth, etc., of a complex target and use them in the field of target identification.
The advantage of the increasing resolution of radar systems is the opportunity to have more details characteristic of a specific target. The disadvantage is that these detailed characteristics require more and more computer memory to be stored, computer resources and increase the search time to NCTR (Non-Cooperative Target Recognition) association.
It is therefore important to develop efficient methods to decrease the size of representations of high resolution data of radar targets. One way to compress these representations is to use multiresolution signal decomposition to analyze the RCS (Radar Cross Section) information content [1] — [3].
In this paper, we investigate the problem of efficient representation of a large database of radar range profiles in
order to minimize memory requirements and recognition search time, using time-frequency representation.
The paper is organized as follows. In a first step, the used synthetic RCS database of large aircrafts, in the HF-VHF frequency bands, is described. In a second step, after a brief review of the wavelet transform theory, the method of applying the wavelet transform to radar signal processing and the procedure to establish the compressed database will be described. In a third step, the identification algorithm and the data processing algorithm are presented. Finally, in a fourth step, the efficiency of multiresolution representations using wavelet transform are discussed regarding some criteria, like compression scores, false identification rate and search time.
II. DESCRIPTION OF SYNTHETIC RCS DATABASE A. Introduction
The synthetic RCS database has been developed during the MOSAR project [4, 5] with the support of the French Ministry of Defence (DGA). The objectives of the MOSAR project are to improve knowledge of frequency response of targets in resonance region by measurements, and to test the efficiency of recognition methods. These studies led to:
• Development of a coherent, pulsed, quasi-monostatic, multifrequency, HF-VHF radar using the 20-80 MHz frequency band and the horizontal and vertical polarizations.
• Development and validation of a simulated RCS database using numerical models of aircraft in the
20-80 MHz frequency band.
• Development and the tests of NCTR algorithms.
B. Description of synthetic RCS database
To study aircraft RCS, several possibilities exist. One can perform:
• Anechoic chamber measurements on real aircrafts or scaled models.
• In–flight measurements with a radar system. • Simulations using a computational model.
Figure 1. Example of modeling aircraft using a wiregrid model – Airbus A320.
Anechoic chamber measurements are not well suited to collect data at various angle aspects of a target but they are useful to validate numerical models. To perform in-flight measurements, it is necessary to use a calibrated radar system and to wipe out propagation effects. The simulation of RCS behaviour, using a computational model, is a very attractive scheme but the model must be validated.
To be able to use a small computer like a PC, the analysis has been made with the free Numerical Electromagnetic Code NEC2 which is based on the Method of Moments (MoM). In this case, the aircraft structure is considered as Perfect Electric Conducting (PEC) body. An example of wiregrid model is presented at Fig. 1.
The synthetic database is constituted of eight aircrafts: Airbus A320, BAe 146-200, Boeing 727-200, 737-200, 737-300, 747-200, 757-200 and Fokker 100. For each aircraft, RCS has been determined as a function of frequency and angle aspect, using the following parameters:
• Frequency band: 20 to 100 MHz with a 1 MHz frequency step,
• Azimuth angle: -10° to +190° with a step of 2°, • Elevation angle: 0° to 90° with a step of 1°, • Polarization: HH, HV, VH, VV.
Then, the range profile is estimated using an inverse Fourier transform from the RCS frequency response. The synthetic database is finally constituted of around 300 000 range profiles, on eight aircrafts [6, 7]. Fig. 2 shows an example of estimated range profile.
III. APPLICATION OF WAVELET TRANSFORM TO DATABASE COMPRESSION
Wavelet transforms have been found useful in a variety of applications. This is because they provide the analyst with an approximation of the signal and a detail of the signal as well. For a complete description of wavelet analysis, the reader should refer to [8] and [9]. A brief summary of how the wavelets were used is presented here.
Figure 2. Example of estimated range profile – Airbus A320 – HH Polarisation.
The Discrete Wavelet Transform (DWT) of finite sequences analyzes a signal S by decomposing it into approximation Ai and details Di parts by quadrature filter
systems [9], where i is the decomposition level. Fig. 3 presents the scheme of the filter systems. An example of wavelet functions used in this paper for the DWT is shown in Fig.4.
The approximation and detail parts are respectively obtained by a low-pass filter and a high-pass filter. At each level, filtering process is followed by decimation by 2 that decreases the data size. Fig.5 presents an example of range profile and its wavelet decomposition computed in five levels.
The approximations and details at each level are pre-processed from the original signal and placed in the training data set.
First level Second level Third level
Figure 3. Filter systems of the wavelet transform (where S is the signal, Ai,
the approximations, Di, the details, and i, the decomposition level).
Figure 4. Example of wavelet functions used in 1-D discrete wavelet transforms – Daubechies family wavelets [10].
Samples Original signal Approximation – Level 5 Approximation – Level 1 Approximation – Level 2 Approximation – Level 3 Approximation – Level 4
Figure 5. Example of range profile and its wavelet transform computed in five levels using the Biorthogonal 3.1 wavelet.
IV. DATA PROCESSING ALGORITHM A. Introduction
To test the efficiency of database compression using multiresolution representation, many criteria can be used:
• Compression scores,
• Probability of false classification (Pfc) as a function of Signal to Noise Ratio (SNR),
• Minimum SNR to obtain a Pfc lower than 1 %, • Search computational time (Sct) for a fixed SNR. To determine these parameters, processing steps are the following: Loading of complete target database, selection of wavelet function, computation of compressed database on several decomposition levels, estimation of Pfc and Sct as a function of SNR.
B. Compression scores
The notion behind compression is based on the concept that the regular signal component can be accurately approximated using the following elements: a small number of approximation coefficients (at a suitably chosen level) and some of the detail coefficients.
The compression procedure contains three steps [10]: • Decompose: Choose a wavelet, choose a level N, and
compute the wavelet decomposition of the signal s at level N.
• Threshold detail coefficients: For each level from 1 to
N, a threshold is selected and thresholding is applied to
the detail coefficients.
• Reconstruct: Compute wavelet reconstruction using the original approximation coefficients of level N and the modified detail coefficients of levels from 1 to N. Two parameters can be calculated to estimate the compression scores [10]:
• The retained energy E defined as:
2
100
(%)
⎟⎟
⎠
⎞
⎜⎜
⎝
⎛
×
=
C
CC
E
(1)Where C are the coefficients of original signal, CC, the coefficients of current decomposition, and ||.||, the vector norm.
• The number of zeros NZ defined as:
NZ (%) = 100 × Number of zeros of the decomposition Number of coefficients
(2)
C. Probability of false classification
Probability of false classification Pfc is defined for M target classes as:
∑
==
M i i in
m
M
Pfc
11
(3) Where mi is the number of classification error, and ni,number of element in the class i.
The nearest neighbour algorithm [11] is used to recognize the target. It is a simple algorithm and is useful to use it to test the efficiency of database compression using multiresolution representation.
The distance used to find the nearest neighbour is the Euclidean distance dTk,r,s between the RCS magnitudes:
∑
= − = n i T i s r k i s r k T A A d 1 2 , , , , (4)Where AT is the magnitude of unknown aircraft T, Ak,r,s, the
magnitude of database element (aircraft k, azimuth angle r, elevation angle s), i, the sample number, and n, the number of sample.
Then, minimal distances to each aircraft are computed and the nearest neighbour kT for the measure T is extracted like:
(
k rs)
T s r k T d k , , , min arg = (5)D. Signal to Noise Ratio
To see the effect of random noise, zero-mean white Gaussian noise has been added to the signal. The Signal to Noise Ratio is defined as:
( )
1 2 2 10.
log
.
10
σ
N
s
dB
SNR
N i i∑
==
(6)Where si is the sampled signal, N, the length of the signal,
and σ2
, the variance of Gaussian noise.
E. Search computational time
In computing, to estimate the search computational time (Sct), a standard parameter is the number of MFLOPs. It’s an acronym meaning “Million FLoating point OPerations”. With this parameter, it is very easy to make a comparison between performances of different processing algorithms.
V. WAVELET APPLICATION TO TARGET RECOGNITION A. Introduction
The multiresolution aspect of the wavelet decomposition is a solution to “compress” database because the target signature on each decomposition levels correspond to the measured signals with multiresolution radar. By the reduction of the number of samples, the use of low resolution decomposition level decreases the search computational time.
To evaluate the performances due to the use of decomposition levels with lower resolution, some parameters must be determined: Mother wavelets, optimum decomposition level, and classification parameter.
B. Selection of mother wavelets
Previous work [1] has shown that there is no statistically significant difference in performance of the classifier when different wavelets are chosen. To confirm this result, some tests have been realized using a great number of mother wavelets applied to compression techniques.
Samples Magnitude
Original signal Compressed signal
Figure 6. Example of original range profile and compressed range profile using Haar wavelet and hard threshold until decomposition level 4.
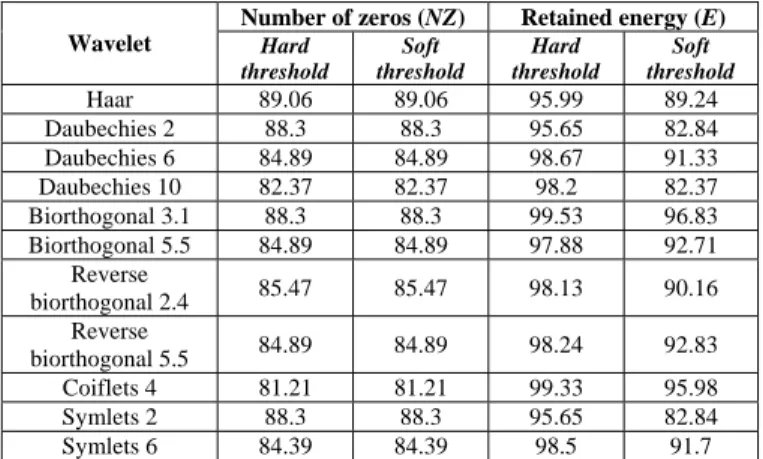
TABLE I. COMPRESSION SCORES AS A FUNCTION OF WAVELETS AND THRESHOLD UNTIL DECOMPOSITION LEVEL 4.
Number of zeros (NZ) Retained energy (E)
Wavelet Hard threshold Soft threshold Hard threshold Soft threshold Haar 89.06 89.06 95.99 89.24 Daubechies 2 88.3 88.3 95.65 82.84 Daubechies 6 84.89 84.89 98.67 91.33 Daubechies 10 82.37 82.37 98.2 82.37 Biorthogonal 3.1 88.3 88.3 99.53 96.83 Biorthogonal 5.5 84.89 84.89 97.88 92.71 Reverse biorthogonal 2.4 85.47 85.47 98.13 90.16 Reverse biorthogonal 5.5 84.89 84.89 98.24 92.83 Coiflets 4 81.21 81.21 99.33 95.98 Symlets 2 88.3 88.3 95.65 82.84 Symlets 6 84.39 84.39 98.5 91.7
The original signal is decomposed at level N and an adaptive threshold is applied on detail coefficients on each level from 1 to N [12, 13]. The signal is then reconstructed using the approximation coefficients of level N and the modified detail coefficients of levels 1 to N.
Fig. 6 shows an example of an original range profile and its compressed one. Differences between these range profiles can be observed.
Tab. I presents a resume of obtained results with different wavelets as a function of compression scores (retained energy
E, number of zeros NZ). We can observe that the efficiency are
very similar (80 % < NZ < 90 %, E > 95 %), but better performances are obtained with a hard threshold (retained energy is largest) due to a better agreement between original and compressed range profiles. A compromise must be found between E and NZ. This means that the simplest wavelet to implement will do as good a job as any other wavelet, at least for the high resolution radar target recognition problem.
Thus, in the next sections, three wavelets have been chosen: Haar, Daubechies 2 and biorthogonal 3.1. Fig. 7 presents an estimation of Pfc as a function SNR for different wavelets. Results are very similar whatever the wavelet families.
SNR (dB) Pfc (%) Original signal Haar wavelet Daubechies 2 wavelet Biorthogonal 3.1 wavelet
Figure 7. Probability of false classification Pfc as a function SNR for three different wavelets (Haar, Daubechies 2, biorthogonal 3.1) using an adaptative
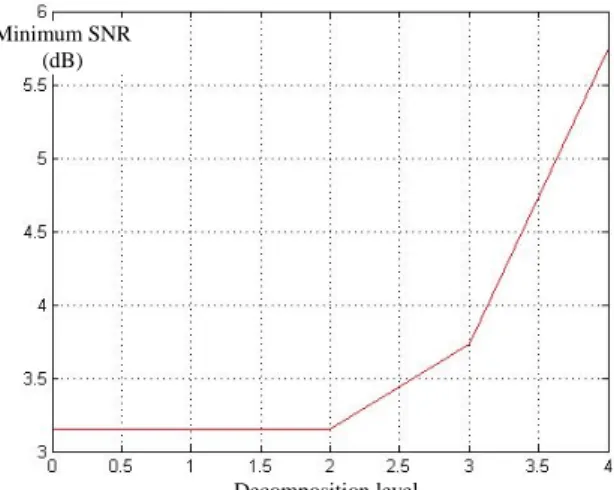
Minimum SNR (dB)
Decomposition level
Figure 8. Variation of minimum SNR to obtain a Pfc < 1 % as a function of level decomposition, using Haar wavelet and adaptative hard threshold.
Finally, Fig. 8 presents the minimum SNR to obtain a probability of false classification Pfc lower than 1 %, as a function of decomposition level. We observe an important increase of the SNR for a level decomposition larger to 2. This characteristic can be used to make de-noising procedure on measured radar signals.
C. Determination of optimum decomposition level
Determination of the optimum decomposition level is a sensitive parameter because the resolution decrease has a smoothing effect on the target signature and eliminates the identifiable scatterers. Fig.5 presents an example of range profile and its wavelet decomposition computed in five levels.
In theory, a maximum possible number J of scales can be considered for a signal composed of N = 2J samples. In practice, the maximum decomposition level can be chosen using a criterion characterizing the smoothing effect on scatterers.
To evaluate the maximum decomposition level, a similarity measure, like intercorrelation, between the original set of vector samples and the approximations on each level re-sampled on the finest resolution can be realized (Fig. 9).
Decomposition level
Haar wavelet Daubechies 2 wavelet Biorthogonal 3.1 wavelet
Figure 9. Intercorrelation between the original set of vector samples and the approximations as a function of level decomposition.
SNR (dB) Pfc (%) Original signal Approximation – Level 1 Approximation – Level 2 Approximation – Level 3 Approximation – Level 4
Figure 10. Probability of false classification Pfc as a function SNR for the original set and the approximation sets using a Haar wavelet and a
decomposition until level 4.
We can observed a good correlation, larger than 0.9, for a maximum decomposition level equal to 4.
Fig. 10 and 11 present respectively, the results of Pfc as a function of SNR, and the minimum SNR to obtain a Pfc lower than 1 %, as a function of decomposition level.
Smoothing effects on target signature as a function of decomposition level increases the probability of false classification Pfc and to preserve a maximum Pfc of 1 %, SNR must be increased of 11 dB. In compensation, search time (Sct) is decreased by a factor of 10 (Fig. 12).
D. Selection of the classification parameter
NCTR association can be made on the different decomposition levels using the “approximation” signatures but also on the “detail” signatures. But in this case, the classification time gain is the same than previously due to the same size of data vectors.
Minimum SNR (dB)
Decomposition level
Figure 11. Variation of minimum SNR to obtain a Pfc < 1 % as a function of level decomposition, using Haar wavelet and approximation signals.
Level decomposition Sct (MFLOPS) Haar wavelet Daubechies 2 wavelet Biorthogonal 3.1 wavelet
Figure 12. Search computational time Sct as a function of level decomposition for three wavelets (Haar, Daubechies 2, biorthogonal 3.1) and a fixed SNR.
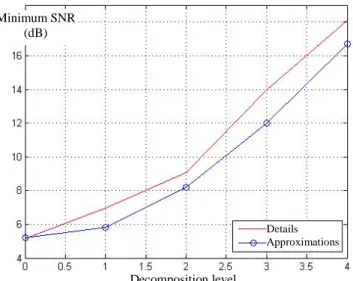
Fig. 13 presents the variation of the minimum SNR to obtain a Pfc lower than 1 %, as a function of decomposition level for a classification using detail or approximation signals.
Better results are obtained with the approximation signals. A 1 dB difference is approximately observed for a fixed probability of false classification.
VI. COMMENTS AND CONCLUSION
The objective of this paper is to evaluate the efficiency of multiscale algorithm to minimize the computational search time to NCTR association. The wavelet transform is one solution to this problem, because it is suitable to the representation of radar returns as a function of decomposition levels corresponding to signals measured by a multiresolution radar system.
No significant difference in performance of the classifier is observed when different wavelets are chosen. This means that the simplest wavelet to implement will do as good a job as any other wavelet, at least for the high resolution radar target recognition problem.
NCTR procedure can be made on the different decomposition levels using the “approximation” or the “detail” signatures. A same decrease of the estimated probability of false classification can be observed but better results are obtained with the approximation signals. To have the same probability of false classification, signal to noise ratio must be increased by a factor of 1 to 11 dB as a function of the decomposition level. In this case, the computational search time is respectively decreased by a factor of 1.9 to 10.
ACKNOWLEDGMENT
The author thanks THALES Air Systems and the French Ministry of Defence for their support to this study.
Minimum SNR (dB)
Decomposition level
Details Approximations
Figure 13. Variation of minimum SNR to obtain a Pfc < 1 % as a function of level decomposition, using Haar wavelet and approximation and details
signals.
REFERENCES
[1] D. Nelson, J. A. Satrzyk, and D. D. Ensley, “Iterative wavelet transformation and signal discrimination for HRR radar target recognition”, Multidimentional Systems and Signal Processing, Vol.14, No.2, 2002.
[2] E.J. Rothwell, K. M. Chen, D. P. Nyquist, J. E. Ross, and R. Bebermeyer, “A radar target disrimination scheme using the discrete wavelet transform for reduced data storage”, IEEE Transactions on Antennas and Propagation, Vol. 42, No. 7, pp.1033-1037, 1994. [3] J.S. Baras and S. Dey, “Adaptive classification based on compressed
data using learning vector quantization”, Proceedings of the 38th Conference on Decision & Control, Phoenix, Arizona, USA, December 1999.
[4] C. Barès, C. Brousseau, and A. Bourdillon, “A multifrequency HF – VHF radar system for aircraft identification”, 2005 IEEE International Radar Conference, Arlington, USA, May 2005.
[5] C. Barès, C. Brousseau, and A. Bourdillon, “Aircraft identification using RCS measurements in the low VHF band”, Radar 2004 – International Conference on Radar Systems, Toulouse, France, October 2004. [6] A. David, C. Brousseau, and A. Bourdillon, “Simulations and
measurements of radar cross section of a Boeing 747 – 200 in the 20 – 60 MHz frequency band”, Radio Science, Vol.38, No. 4, pp.1064-1070, July - August 2003.
[7] A. David, C. Brousseau, and A. Bourdillon, “Validation of heavy aircraft RCS simulations at very high frequencies”, Radar99 – International Conference on Radar Systems, Brest, France, May 1999. [8] S. Mallat, A wavelet tour of signal processing, 2nd edition, Academic
Press, 1998.
[9] S. Mallat, “A theory for multiresolution signal decomposition : The wavelet representation”, IEEE Transactions on Pattern Analysis and Machine Intelligence, vol. 11, No. 7, pp. 674–693, July 1989.
[10] M. Misiti, Y. Misiti, G. Oppenheim, and J.M. Poggi, Wavelet toolbox 4 – Users’s guide, The MathWorks, Inc., 2008.
[11] T. Cover, and P. Hart, “Nearest neighbour pattern classification”, IEEE Transactions on Information and Theory, Vol. IT-13, N° 1, January 1967.
[12] D. Donoho, and I. Johnstone, “Threshold selection for wavelet shrinkage of noisy data”, 16th IEEE Annual International Conference on Engineering in Medecine and Biology, 1994.
[13] L. Birge, and P. Massart, “From model selection to adaptive estimation”, In Festschrift for Lucien Le Cam (D. Pollard, ed.), pp. 55 – 87, Springer Editions, New York, 1997.
![Figure 4. Example of wavelet functions used in 1-D discrete wavelet transforms – Daubechies family wavelets [10]](https://thumb-eu.123doks.com/thumbv2/123doknet/11602504.299556/3.892.465.837.864.1015/figure-example-wavelet-functions-discrete-transforms-daubechies-wavelets.webp)