OATAO is an open access repository that collects the work of Toulouse
researchers and makes it freely available over the web where possible
Any correspondence concerning this service should be sent
to the repository administrator:
[email protected]
This is an author’s version published in:
http://oatao.univ-toulouse.fr/21157
To cite this version:
Valenzuela-Venegas, Guillermo and Henríquez-Henríquez, Francisco
and Boix, Marianne
and Montastruc, Ludovic
and Arenas-Araya,
Fernando and Miranda-Pérez, Jenny and Díaz-Alvarado, Felipe A. A
resilience indicator for Eco-Industrial Parks. (2018) Journal of Cleaner
Production, 174. 807-820. ISSN 0959-6526
A resilience indicator for Eco-Industrial Parks
Guillermo Valenzuela-Venegas
a, Francisco Henríquez-Henríquez
a, Marianne Boix
b,
Ludovic Montastruc
b, Fernando Arenas-Araya
a, Jenny Miranda-P!
erez
a,
Felipe A. Díaz-Alvarado
a,*a
Department of Chemical Engineering, Biotechnology, and Materials, Faculty of Physical and Mathematical Sciences, Universidad de Chile, Av. Beauchef 851, Piso 6-poniente, Group of Sustainability and Process Systems Engineering, 8370456, Santiago, Chile
bUniversit!e de Toulouse, Laboratoire de G!enie Chimique U.M.R. 5503 CNRS/INP/UPS, 4 all!ee Emile Monso, 31432, Toulouse Cedex 4, France
a r t i c l e
i n f o
Keywords: Indicator Resilience Eco-Industrial Park Networka b s t r a c t
An Eco-Industrial Park (EIP) is a community of businesses that seeks to reduce the global impact by sharing material. The connections among the industrial participants within this park improve the environmental performance of the industrial network. However, the connectivity also propagates fail-ures. This risk is an important point of criticism and a barrier to industrial plants when evaluate their integration to an EIP. This paper proposes an indicator to follow the resilience of an EIP so as to improve the security of the whole system, considering the dynamic of the participants to endure a disruptive event. This metric could be used by decision-makers in order to include the resilience in the design phase of an EIP. Solving these security problems would expand the set of experiences of cleaner production, facilitating the integration of industrial processes. The proposed resilience indicator is based on two main characteristics of an industrial network: the number of connections among participants, and the capacity of each flow to change its magnitude when a participant suddenly stops sharing flows within the park. A network is separated in independent layers to quantify its flexibility when substituting flows. Each layer includes a single shared material. The resilience of a multi-layer park is then calculated as a weighted summation. This indicator is applied over two illustrative cases to study: Kalundborg, in Denmark; and Ulsan, in South Korea. These applications show consistent results when compared with reality. Although the proposed resilience indicator has been developed for material networks, it can be adapted to heat integration networks. In this case, special attention should be payed to physical constraints as minimal temperature gradients.
1. Introduction
An Eco-Industrial Park (EIP) is a community of businesses located together in a common property, sharing materials, energy, or infrastructures (Lowe, 2001). It is motivated by economic, environmental, and social improvements achieved through the collaboration among the firms within the park. These relationships foster the implementation of Industrial Symbiosis (IS), which seeks to transform wastes, by-products or products of a firm into inputs for another one taking advantage of their own connections (Chertow, 2000).
The benefits obtained by an EIP cover the three sustainability
dimensions: economic, environmental, and social (Boix et al., 2015). The improvements are related to profitability and resil-ience, environmental impact reduction, and concern for local community next to the park (Valenzuela-Venegas et al., 2016). The magnitude of these benefits is associated to the configuration of an EIP, in other words, to connections among firms and their location. This configuration can be chosen by decision-makers at the design phase of EIPs.
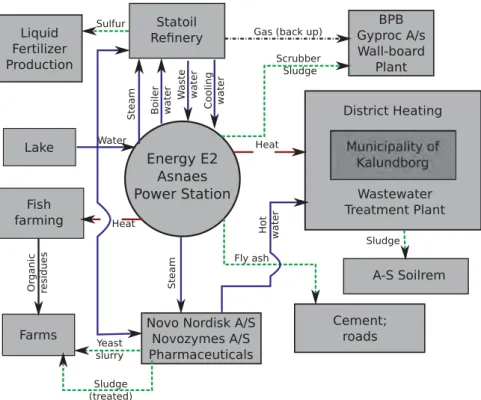
One of the best-known examples of EIP is Kalundborg, in Denmark (Knight, 1990). It presents a regional symbiosis where the participants exchange water, heat and by-products (Chertow, 2008). The participants are firms, local community, and a lake (seeFig. 1). Each participant is considered in the design. Some of the benefits are reduction in carbon dioxide (CO2) and in sulfur dioxide (SO2) emissions; transformation of wastes into raw materials; reduction in coal, oil, and water flows; and heat reutilization as
* Corresponding author.
E-mail address:[email protected](F.A. Díaz-Alvarado).
district heat for the local community (Chertow, 2000). All these flows produce changes on each sustainability dimension, obtaining remarkable improvements for each participant and for the entire park (Jacobsen, 2006).
To design an EIP focusing on their benefits, an optimization problem can be formulated (Boix et al., 2015). Using the solution of a nonlinear or mixed-integer nonlinear programming problem, it is possible to obtain an optimal network configuration (Biegler and Grossmann, 2004). This formulation can back up decisions during the design phase of an EIP, formalizing the industrial planning to make the industrial development more sustainable.
In this context, there are several works proposing a mathe-matical formulation to design an EIP. These efforts can be classified into three categories according to the type of exchanges among participants of the park (Tudor et al., 2007): water networks (e.g.
Boix et al., 2011, 2012; Montastruc et al., 2013; Ramos et al., 2016; Rubio-Castro et al., 2011; Tiu and Cruz, 2017), energy networks (e.g.Chae et al., 2010; Kuznetsova et al., 2016; Liew et al., 2013), and material networks (e.g. Haslenda and Jamaludin, 2011; Tietze-St€ockinger et al., 2004; Zhang et al., 2017). Each of these formula-tions optimizes the configuration of an EIP with focus on one or more sustainability dimensions.
In the work of Lovelady and El-Halwagi (2009) the authors propose and solve a problem of water network design in order to minimize the total annualized cost using different strategies as recycling, reutilization, and separation. They compare this solution with the scenario of using only freshwater, and conclude that the recycling strategy is the most profitable. InTiu and Cruz (2017), the authors propose a mathematical formulation to design a water network, simultaneously minimizing the economic and the envi-ronmental dimension through the reduction of piping, operating, freshwater, wastewater and treatment cost, and involving the vol-ume and the quality of the water used in the EIP (Tiu and Cruz, 2017). They obtain a better result considering both sustainability dimension that just one of them. In Cimren et al. (2011), an
optimization model over by-products in an industrial network is used to minimize economic and environmental indicators. This model is applied over an existing industrial network in USA and its solution is compared with a base case with no synergetic re-lationships among the companies. The resulting by-product network achieves the reduction on the costs and on the CO2 emissions when is compared with the base case, illustrating the improvements offered by the design of an EIP using a mathematical formulation.
In all these examples the main objectives of the EIP design problems are focused on sustainability dimensions (Boix et al., 2015). Even though EIPs are largely studied in the literature, they suffer of reluctance from industries. Indeed, the potential industrial participants are often hard to convince due to security issues when connecting processes, because failures are also propagated through a network (Zeng et al., 2013). In this sense, how to convince in-dustries to be included in an EIP? Is it always safe to connect pro-cesses? What if a company undergoes a stop in production?
In computer networks, a security or resilience factor is consid-ered when defining a configuration. This focus allows to reduce the vulnerability of the whole network (Goel et al., 2004). This measure takes into account the topology of the network, in other words, the way the elements are connected in it. In general, this factor quan-tifies the damage done to the whole network when the most critical element (e.g., the element with the maximum number of connec-tions) is removed (Matta et al., 2014). The aforementioned damage is commonly quantified by the number of compromised nodes after the failure of a single node within the network.
Following the same idea, after obtaining an optimal configura-tion in the context of an EIP design, the quesconfigura-tion is what would happen if a participant is removed from the park. A pending issue in this field is to design the connections of a single plant considering the stability of the other participants and their flow requirements, specially during failures within the network (Xiao et al., 2016; Zeng et al., 2013). A new objective during the design phase could be
Fig. 1. Eco-Industrial Park in Kalundborg. Blue arrows indicate water exchanges, red arrows heat exchanges, and green arrows residue exchanges. Figure obtained fromChertow (2008). (For interpretation of the references to colour in this figure legend, the reader is referred to the web version of this article.)
added to improve the security of the network by increasing its resilience.
The point is how to measure the resilience of the park during the design phase. In this sense, some authors define metrics in order to measure this characteristic (Chopra and Khanna, 2014; Li and Xiao, 2017; Xiao et al., 2016; Zeng et al., 2013; Zhu and Ruth, 2013). In
Chopra and Khanna (2012, 2014), the authors propose four metrics to measure the resilience of an EIP, focused in two aspects of an industrial network: its connectivity and its efficiency (Chopra and Khanna, 2012, 2014). The general goal of these metrics is to mea-sure the impact of a partial and complete disruption over the park and their participants, focusing on the most affected nodes and on the loss of efficiency of the park. InLi and Xiao (2017), the authors propose a methodology to measure the resilience of a network, analyzing their topological aspects (Li and Xiao, 2017). They explore the resilience from a topological approach, determining the main characteristics of a network and quantifying the importance of each participant through these characteristics. Additionally, the authors note the necessity to use the flows of the participant firms to better represent the real relationships in the park. Some works are focused on the cascading failure of the participants in a network, studying the responses of the firms after removing one of them. They base their analysis on the fact that if a critical component fails, it could lead to further participants decided to leave the network due to cascading failures (Zeng et al., 2013). InXiao et al. (2016), the authors propose a model that can be used for more stable operation of an eco-industrial system (Xiao et al., 2016). To do this, they define two indicators respectively to assess two characteristics of an in-dustrial network: its structural stability and its functional stability. The goal of the model is to measure the impact of the cascading failure, considering the decision of the firms to stay in or leave the park, i.e., the dynamic of the network after a disruptive event occurs.
All these works about resilience of an eco-industrial system are focused on the efficiency of the network from a topological point of view, or on the cascading failures phenomenon, considering the decision of the participant to stay in or leave the park. To the best of our knowledge, there are no works focusing on the dynamic of the participant of an EIP when a disruptive event occurs, considering the decision of the firms to absorb the consequences of this failure. The present work aims at creating a resilience measure for EIPs, considering the decision of the participant to absorb possible disruptive events on them. This indicator is constructed to support its future application in an optimization problem, so as to design EIPs with an additional resilience-oriented objective. The goal of this metric is to determine if the connections are enough to maintain the identity of the park and to quantify the performance of the participants when a firm stops sharing flows, after changes in their input and output flows. Beside the resilience measure, this indicator is applied over two application cases in order to illustrate its use. The objectives of this paper are to define a resilience metric over EIPs and to apply this factor in existing EIPs.
After the present introduction, Section 2 explains the con-struction of the proposed indicator, and Section3 illustrates its application by means of two examples. Section 4 presents the discussions about the application of the proposed indicator over the two illustrative examples, and about some improvements in its construction. Finally, Section5 presents the conclusions of this work.
2. Definition of the resilience indicator
This section explains some considerations about the represen-tation of an EIP to back up the definition of the Resilience Indicator. The starting point is the definition of resilience from Fiksel
(2003), where the authors define this concept as the capability of
the system to absorb disruptions before it changes its properties that control its functionality. This property allows an IS network to endure the impact of unforeseen event.
This definition takes into account the capability of a network to face a disruptive event. In other words, resilience considers the adaptability of a network to withstand a disruptive event and to absorb their consequences. The present work considers a disruptive event when a firm interrupts its activity losing their inputs and outputs in the network.
Generally, from computer network studies, or other similar systems, the concept of resilience is focused on the number of connections. The most connected participant is identified as the critical node. When this node is removed from the network, the number of connections is detected (critical node), and the number of lost connections is quantified over the whole network comparing two scenarios: the base state, and the state where the critical element is not present (Matta et al., 2014).
When a participant interrupts its activity, the network losses connections (edges) and modifies its flows. Two effects are present in the network. After the disruption in the network, the remaining participants must compensate the flows they have lost. For instance, if a participant of a network interrupts its activity (see
Fig. 2), its associated input and output flow would disappear (connections). The number of connections in the park changes. Since the network must continue working and producing, the remaining participants should modify the magnitude of their flows to compensate the losses without important changes in the network (entering of a new participant or creating new connections).
In view of the foregoing, the resilience measure has to detect these consequences and assess if the park could maintain its operation. The indicator has to focus on two aspects: (i) if the connectivity of the industrial network is enough to withstand a disruptive event and (ii) if the other firms can compensate the lost flows when a firm interrupts its activity.
The proposed resilience indicator measures two aspects of a network:
! The number of connections among participants, known as Network Connectivity Index (NCI).
! The capacity of the participants to compensate theflow demand when one participant interrupts its activity, or Flows adapt-ability index (
f
).The resilience indicator is defined as a combination of both metrics, the Network Connectivity Index and Flows Adaptability Index.Fig. 3shows the structure of this indicator, remarking how it is constructed by two sub-indicators and what characteristics of the resilience, in the context of EIP, it measures.
The following subsection explains the mathematical represen-tation used in the definition for both metrics.
2.1. Mathematical representation of an EIP
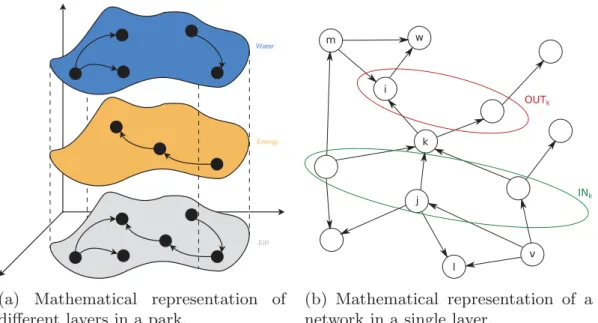
An EIP is a set of firms where the participants can share different elements such as material and energy. To facilitate the design and the analysis of these parks, the information about flows can be separated in order to compose a network for each shared compo-nent (seeFig. 4a). With this in view, the design of an EIP can be approached by a succession of sub-designs, each of them related to a single material or energy. In such sub-design, the exchange network is defined by the connections between the participants and their respective flows. During this work, an exchange network associated with a single component (e.g. water) is a layer.
Each exchange network can be designed through mathematical optimization tools, deciding connections and allocations of each participant (Boix et al., 2011). These tools use a mathematical representation to formulate the optimization problem. These rep-resentations are graphs, where the participants of the park are represented by nodes; and the connections, by oriented edges (see
Fig. 4b). This representation is adopted in order to define each metric and the resilience indicator of an EIP.
Due to the aforementioned points, the following terms and sets are defined:
! N: Set of park participants.
! C: Number of connections among park participants. ! n: Number of participants, n ¼ jNj .1
! L: Set of layers in the park.
! jLj: Number of layers in the park.
! INk: Set of participants that contribute an input into k2N.
! OUTk: Set of participants that have an output from k2N.
! Qlmax;in: Maximum input capacity of the participant l2N.
! Qimin;in: Minimum input capacity needed for the participant i2N
to operate.
! Qmmax;out: Maximum output capacity of the participant m2N.
! Fi;j: Magnitude of the flow between i2N and j2N.
! fk: Flow sensitivity of the participant k2N in a network.
! flayerr
k : Flow sensitivity of the participant k2N in the layer r2L
of the park.
! NCI: Network Connectivity Index of a park. !
f
: Flow sensitivity of a park.2.2. Network Connectivity Index
As in a computational network, in an EIP the connections among
Fig. 2. Consequences over an eco-industrial park when one of their participants stops its activity. The dotted arrows show the affected connections; and the numbers in bold, the modified flows.
Fig. 3. Main characteristics of the resilience applied in an EIP, and structure of the proposed resilience indicator to measured it.
participant are important because they follow the existing ex-changes within the network. In this sense, if one participant in-terrupts its activity, their surrounding connections are infeasible while the disruption persists. With a larger number of connections in the park, the network has greater possibilities to endure changes in its configuration because it will be able to keep its connectivity when a participant interrupts its activity. When a park has a lower number of connections, a disruptive event in a company can isolate others.
The Network Connectivity Index (NCI) aims at quantifying connections in a park and at measuring the endurance of the whole network against a possible disruption. The main focus of NCI is the configuration of the park: its topology. In this sense, if the park is completely connected and a disruptive event occurs, other firms will not be isolated and would have other options to compensate their losses. In this situation, the park maintains its identity. Conversely, if the network has only one connection between each participant and one of them interrupts its activity, the park is divided. This metric defines the connectivity level as a reference to a maximum and minimum number of connections in the network. It is important to remark the absence of orientation in this measure. The NCI takes into account the complexity of the network, but other aspects as orientation and flows will be considered in other metric (flows adaptability index). Since an EIP can be configured as a multi-layer park, to count the number of connec-tion, all the participants are considered in a unique layer, no matter what they are sharing. If between two nodes there are more than one connection, just one of them is considered. For example, if two participants (nodes) are connected in a direct or reverse direction (from A to B or from B to A), the NCI considers a unique connection (edge).
2.2.1. Minimum number of connections (Cmin
n )
The minimum number of connections of an EIP is defined as the minimum number of edges necessary to constitute a park. A basic assumption in this logic is that an EIP maintains its identity if each node has at least one connection.
In this definition, the following scenarios are possible:
! If the park has three node, n ¼ 3 (see summary Table 1), the minimum number of connection to maintain the participants connected, without identity loss (node isolation), is Cmin
3 ¼ 2. ! If a new node is added to the last configuration, n ¼ 4, it is
possible to create three new connections: one to each existing node. As the goal is to calculate the minimum number of con-nections, it is possible to consider only one of them. The mini-mum number of connection for n ¼ 4 would be 3. However, there is a possibility to reduce this value with no isolated nodes. In this case, it is possible to separate the network in two subsets (see summaryTable 1). The minimum number of connection for
n ¼ 4 is Cmin
4 ¼ 2.
It is worth to note that the case with two or less nodes is not considered because they do not constitute an EIP, where the collaboration among three firms is required (Chertow, 2008).
Table 1shows a summary of the minimum number of connec-tions Cmin
n for different number of nodes n. From this table and the
above progression, it is possible to infer the following for the minimum case: (i) if n is even, every node has a unique edge; and (ii) if n is odd, one node has two edges and the remaining nodes have a single edge.
The equation for the minimum number of connection Cmin n for n
nodes is expressed as follows:
Cminn ¼ n $ Pn=2R (1)
where x is the operation floor, which is the largest integer less than or equal x.
2.2.2. Maximum number of connections (Cmax
n )
The maximum number of connections (Cmax
n ) in a park of n
participants is defined as the larger number of edges among par-ticipants. In this sense, the following procedure is necessary to define Cmax
n :
! Considering a participant in a park composed by n members (p1, where p12N), its maximum number of connections is n $ 1. ! For another participant (p2, where p22N), the maximum
number of connections without the considered connection in
the above scenarios is n $ 2. This is because the connections have been considered unoriented.
! Following this logic, the maximum number of connection for the participant pk, where pk2N (without the considered connec-tion), will be n $ k.
! The maximum number of connections in a park with n partici-pants is obtained by the following summation:
Cmax n ¼ X k2N n $ k (2) Cmaxn ¼nðn $ 1Þ 2 (3)
To illustrate this point: if the network is composed by 3 nodes, the maximum number of connections is 3; if the network is composed by 4 nodes, the maximum is 6.Table 1shows a summary of Cmax
n for different number of nodes in a network.
2.2.3. Definition of Network Connectivity Index (NCI)
Establishing the maximum and minimum number of connec-tions in a park, it is possible to define the Network Connectivity Index (NCI) associated with each of them. If the network has the maximum number of connections, Cmax
m , then, NCIðCmaxn Þ ¼ 1. If the
network has the minimum number of connections, Cmin
m , then the NCIðCmin
n Þ ¼ 0. With these values, a linear function between both
cases (seeFig. 5) allows to interpolate other cases. It is worth to remark the use of a linear function in order to simplify the defini-tion of NCI. In future works, it could be changed according to properly represent the behavior of this characteristic between these two points.
The NCI is defined as follow:
NCIðn; CÞ ¼2"C $ n þ # n 2 $% n2$ 3n þ 2#n 2 $ (4)
where C is the number of connections of the network (edges) and n
is the number of participants of the network (nodes). It is worth noting that NCI is an adimensional index and indicates the connection level of a configuration network with n participants according to its maximum and its minimum number of connections.
This section has presented the construction of the Network Connectivity Index, which seeks to quantify the connection level of a park through the number of its connections. This index sets the maximum and the minimum number of possible connections, and establishes the level of connections of the park configuration. So, if
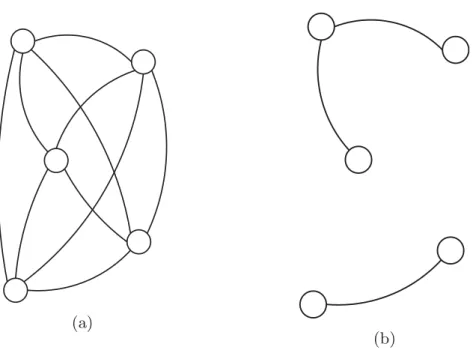
NCI ¼ 1, it means that the park is completely connected and can
endure a firm activity interruption (see Fig. 6a). Conversely, if
NCI ¼ 0, it means that some participants are isolated when a
disruptive event occurs (seeFig. 6b).
2.3. Flows adaptability index (
f
)After constructing the NCI in the above section, it remains to present the quantification of the Flows Adaptability Index (
f
) in order to compose a resilience metric, which represents the neces-sary flow magnitude for the continued operation of a park if a disruptive event occurs.The goal of this metric is to quantify if the flows and the participant capacities of the park are enough to compensate a disruptive event. This metric must quantify the necessary flow to sustain the operation of the park and the flexibility of the network to modify the remaining flows consequently.
Oriented connections were considered to quantify
f
because the flows under study imply mass or energy transfer from one partic-ipant to another. The measure is based on demands from the nodes and their provisions before and after the disruptive event.When a participant of a park interrupts its activity, its inputs and outputs disappear. These flows are also inputs for and outputs from other participants which need them to maintain their operations. The magnitude of other inlets and outlets in the surrounding nodes must change to compensate this loss during this event. With this purpose, a security range has been considered for every plant: a minimum and a maximum flow to operate. These values are defined for the inlets and outlets of every node. The inlet and outlet capacities for each participant k were defined as Qkmax;in and
Qkmax;out respectively, with k2N. It is also necessary to define the
sets INk and OUTk to include the nodes connected with k2N
through an input or output of k, respectively (seeFig. 7).
Since the flows of the participants of a network have different magnitude and quality, they are not easily replaceable. To substi-tute these flows, the new ones have to comply the same charac-teristics of the original. To simplify this behavior, it is possible to assume that all the flows can be substituted by any inlets or outlets in a layer of the network, i.e., all the flows comply the requirements about quality if they belong to the same layer.
It should be noted that the terms defined in the following sec-tions refer to a unique layer. Since an EIP can be configured by different layers, an extended definition will be provided in section
2.3.4for a park with multiple layers.
2.3.1. Defining changes over the elements in the set INkafter a disruptive event in node k
When a participant k2N interrupts its activity, all its input flows
Fj;kcj2INkare lost (seeFig. 7). To ensure the continuous operation
of the park, each of these flows has to be redistributed in the remaining outputs of the affected firms j2INk, i.e. in l2OUTjnfkg.
The feasibility of this change depends on the capacity of each firm receiving the additional flow and its committed capacity. This value is defined as the inlet available capacity for the participant l, denoted
Table 1 Maximum (Cmax
n ) and minimum number of connections (Cminn ) among
nodes in a park. Number of nodes (n) Minimum number of connections (Cmin n ) Maximum number of connections (Cmax n ) 3 2 3 4 2 6 5 3 10 6 3 15 7 4 21 8 4 28 9 5 36 10 5 45
as: Qin l ¼ 0 @Qlmax;in$ X v2INl;vsk Fv;l 1 A with l2OUTjnfkg (5)
It is worth to note that Qin
l is minimum when l is working at
maximum capacity ( P k2IN;vsk Fv;l¼ Q max;in l ). Conversely, Q in l is
maximum when Fj;lis the unique inlet of node l ( P k2IN;vsk
Fv;l¼ Fj;l).
The total output available capacity for the participant j2INkwhen k interrupts its activity is:
Qout j$k ¼ X l2OUTk;lsk Qin l with j2INk (6)
Calculating this term, the feasible increase in the outputs of
j2INkits inferred to compensate the lost flow Fj;k. To compare both
values and to determine if this capacity is greater or equal to the lost flow, the definition of the lack of flow for the participant j when k
interrupts its activity is provided as:
Lin
j$k¼ max n
0; Fj;k$ Qj$kouto with j2INkand k2N (7) This term is 0 if the park can compensate the lost flow of the participant j when k interrupts its activity; or it takes the magni-tude of the flow to compensate the loss.
2.3.2. Defining changes over the elements in the set OUTkafter a disruptive event occurs in node k
As in the previous case, when a participant k2N interrupts its activity, all their outputs Fk;icI2OUTkare lost (seeFig. 7). To ensure the continued and normal operation of the park, each of these flows has to be compensated increasing the remaining inputs of the affected firms i2OUTk, i.e. m2INknfkg. The feasibility of this
sub-stitution of flows depends on the capacity of each firm receiving the increased flow and its committed capacity. With this focus, the
outlet available capacity for the participant l is defined as: Qmout¼ 0 @Qmmax;out$ X w2OUTm;wsk Fm;w 1 A with m2INinfkg (8) It is important to note that Qout
m is minimum when m is working
at its maximum capacity ( P
w2OUTm;wsk
Fm;w¼ Qmmax;out). The
avail-able capacity of m is maximum when Fm;iis the unique outlet of node m ( P
w2OUTm;wsk
Fm;w¼ Fm;i).
Then, the total input available capacity for the participant i2OUTk when k interrupts its activity is:
Qi$kin ¼ X
m2INi;msk
Qmout (9)
Calculating this term, the feasible increase in the inputs of
i2OUTkis inferred to compensate the lost flow Fk;i.
Fig. 6. Maximum and minimum cases for the Network Connectivity Index (NCI) considering five participants: 6a maximum case, and 6b minimum case.
In the situation after disruption, it is not necessary to share the same flow than before to maintain the participant i in operation. Plant i can operate at its minimum capacity. It is necessary to define
the minimum capacity of i to continue its operation, Qimin;in. This value depends on the security factor of each participant and complies with Qimin;in+ P
m2INi
Fm;i. Since after the disruption the participant i
is working at its minimum capacity and has lost one input, the minimum flow necessary to feed is Qimin;in$
P
m2INi;msk
Fm;i. It is
important to highlight that if this value is negative or zero, the minimum capacity is already satisfied by the remaining inlets and it is not necessary to increase other flows.
In view of the above, it is deemed necessary to compare
Qimin;in$ P
m2INi;msk
Fm;iand Qi$kin so as to determine if this capacity is
equal or greater than the minimum required flow. For this purpose,
the lack of flow for the participant i when k interrupts its activity is
denoted as: Lout i$k¼ max 8 < : 0; Qimin;in$ X m2INi;msk Fm;i $ Qi$kin 9 = ;
with i2OUTkand k2N (10)
This term is 0, if the park can compensate the lost flow of the participant i when k interrupts its activity; or it will take the magnitude of the minimum flow to compensate the loss.
2.3.3. Defining the flows adaptability index
Using the aforementioned values, the required flow to compensate the absence of one participant in the park is calculated. It is worth noting that both metrics, Lin
j$kand Louti$k, identify the
participant that interrupts its activity and just one of their inputs and outputs respectively. To calculate the total required flow associated with the activity interruption of a participant, consider the summation of Lin
j$kover all the inputs (j2INk) and also consider
the summation of Lout
i$kover all the outputs (i2OUTk). The
combi-nation of both summations takes account of the necessary flow to compensate the disruption over k.
The total lack of flows related to a disruption in k is defined as: L k¼ X j2INk Lin j$kþ X i2OUTk Lout i$k ck2N (11)
Using this term, the total required flow to compensate the ac-tivity interruption of a network participant is obtained. In the same way as the NCI, the worst and the best scenarios were taken to establish a linear function between them in order to simplify the calculation.
The worst scenario for the park is when the network and their participants are working at their full capacity, i.e. when Lk is maximum: Qout
j$k¼ Qi$kin ¼ 0. Lkwould be:
Lmax k ¼ X j2INk Fj;kþ X i2OUTk Qimin;in (12)
The best scenario for the park is when the network can totally compensate the activity interruption of one of its participants. In this scenario, Lk is minimum:
Qout
j$k, Fj;k∧Qin
i$k, Q
min;in
i 0Linj$k¼ Louti$k¼ 0. Then, Lkwould be:
Lmin
k ¼ 0 (13)
Establishing these worst and best scenarios for the park, the flows adaptability index fkis defined for the network affected by
the interruption in the activity of the participant k. If the park is working at the worst scenario, fkðLmax
k Þ ¼ 0; if the park is working
at its best scenario, fkðLmink Þ ¼ 1. With these values, the following
linear function is created to quantify intermediate cases (seeFig. 8):
fkðLkÞ ¼ fk" Lmax k % $ 3 fk 3 Lmin k 4 $ fk" Lmax k %4 Lk$ L max k Lmin k $ Lmaxk ! (14) fkðLkÞ ¼ 1 $ L k P
j2INkFj;kþPi2OUTkQimin;in
k2N (15)
This equation can apply over each participant k of the park. In order to obtain a measure over the whole park, the average of this metric is calculated over all the participants under analysis:
f¼1
n
X k2N
fk (16)
It is important to remark that the value of
f
belongs to the in-terval ½0; 1.. This is useful for a further combination with NCI. Since the average complies with this requirement, this function is applied to calculate the flows adaptability index of the whole park.2.3.4. Final considerations about flows adaptability index
As mentioned before, an eco-industrial park is characterized by a complex network where different materials or energy are shared, composing different exchange networks. These different networks can be separated into layers. Since the flows adaptability index measures the required flow to compensate the loss of a participant in a specific exchange network,
f
has to consider this fact.f
can be calculated for each layer. Onwards, a superscript underf
will indicate the considered layer. The flows adaptability index for the specific layer r is calculated as:flayerr¼1
n
X k2N
flayerrk (17)
The flows adaptability index for the whole park is constructed covering all the layers in the set L:
fðparkÞ ¼ f3flayer1; flayer2; flayerr4with r2L (18) To simplify the notation, a linear combination of layers is
considered. The weights in the summation are all identical. The index is defined as:
fðparkÞ ¼ 1 jLj X r2L flayerr (19) 2.4. Resilience indicator
NCI and
f
have been conceived to measure, respectively, the connectivity of a park and its capacity to endure a disruptive event by replacing flows. Both characteristics are important to assess the resilience of a park. The following equation is proposed so as to define a resilience indicator:Resilience ¼ a$NCI þ ð1 $ aÞ$f (20)
where a and 1 $ a indicate the importance of each character-istic: the connectivity of a park, measured by NCI, and the capacity of the park to endure a disruptive event by replacing flows, measured by
f
. The same importance is proposed for both aspects, that is: a ¼ 0:5. This decision should be taken by the stakeholders of the park. Further developments in this line could be done so as to adapt this combination to reality. A feasible route to address this issue is to apply a multi-criteria decision-making tool. The resil-ience indicator is defined as:Resilience ¼ 0:5$NCI þ 0:5$f (21)
3. Application of the resilience indicator over case studies
In order to analyze the applicability of the proposed resilience indicator, consider two illustrative cases based on two particular EIPs: Kalundborg, in Denmark (seeFig. 9), and Ulsan, in South Korea (seeFig. 10). The application of the indicator is addressed in a single layer within both EIPs; and the study of multiple layers is covered in the case of Ulsan EIP. A brief explanation about each EIP is pre-sented below, as an introduction to the illustrative cases.
3.1. Defining the illustrative cases 3.1.1. Kalundborg EIP, Denmark
The most renowned EIP in the literature, Kalundborg is char-acterized by the sharing of water, steam, by-products, and heat (Chertow, 2008). The most remarkable members are: an oil re-finery, an energy plant, a cement plant, a pharmaceutical process, the lake Tiss
f
, and the municipality of Kalundborg (seeFig. 1). The Kalundborg's EIP was originated by an integrated planning driven by the municipality and the participant companies. The plan takes into account the local community and the lake (Kalundborg Symbiosis, 2015). The main benefits obtained by the park are the improvement in resource efficiency and the economic utilities of the firms (Jacobsen, 2006).3.1.2. Ulsan EIP, South Korea
Ulsan is located in the southeast of South Korea. This city has many important industrial complexes at a national and regional level. Among these complexes, two of them are analyzed: Ulsan-Mipo and Onsan. These Complexes employ 100; 000 workers and cover 63; 256 km2of the territory (Behera et al., 2012).
In 2005 started the implementation of a government initiative in the Mipo/Onsan complex, focused on the development of an EIP in the region. This program established the Ulsan EIP center in 2007,
aiming at sharing materials and energy within the network. There are 33 exchanging flows among the firms operating in this EIP, which includes 41 companies. The main benefits obtained by this exchanges are related to reduce the CO2 emissions and other gaseous pollutants, and to increase the economic utilities of the companies (Behera et al., 2012).
3.1.3. Case 1: application of the resilience indicator on networks with a unique layer
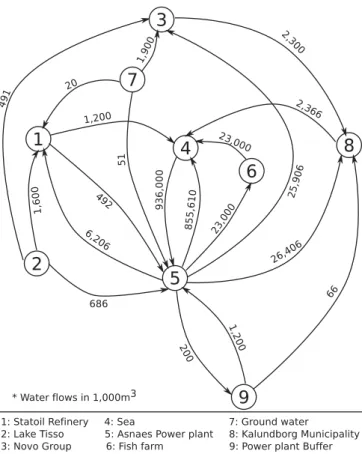
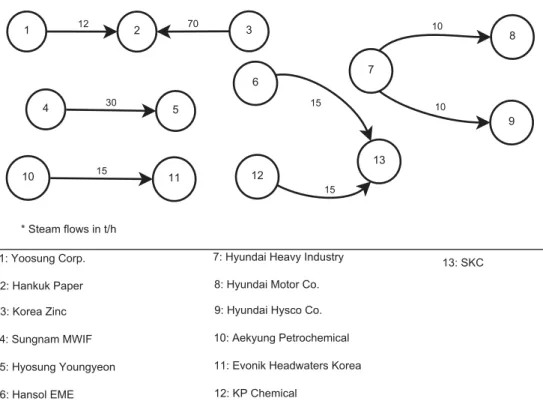
To study the applicability of the resilience indicator on networks with a unique layer, consider the Kalundborg and Ulsan networks. In Kalundborg, the focus of the analysis is on the water network (seeFig. 9); in Ulsan, the steam network is the subject of analysis (seeFig. 11). In the latter case, the steam network was considered as a conventional material network, with no constraints on the tem-perature requirements of the participants. It is worth remarking the base to calculate: the data used to describe the connections and flows depend on the available information. The first and second rows ofTable 2show a summary about the values obtained for the resilience indicator, NCI, and
f
in both networks. The plots inFig. 12a andFig. 12b show a comparison among the participants of the respective networks with focus on
f
.The main goal of the case studies is to illustrate the application of the Resilience Indicator. This exercise also shows a significant difference between these networks: the value of the Resilience Indicator is higher in the Kalundborgs water network, and the difference is mainly due to the network structure. The reader can appreciate the value of NCI for the Ulsans steam network, which is significantly lower than the NCI for Kalundborgs water network. The point is how these networks would been configured if the Resilience Indicator was applied at the design phase. To our un-derstanding, the Ulsans steam network can improve its resilience
with this consideration.
3.2. Case 2: application of the resilience indicator over an EIP with multiple layers
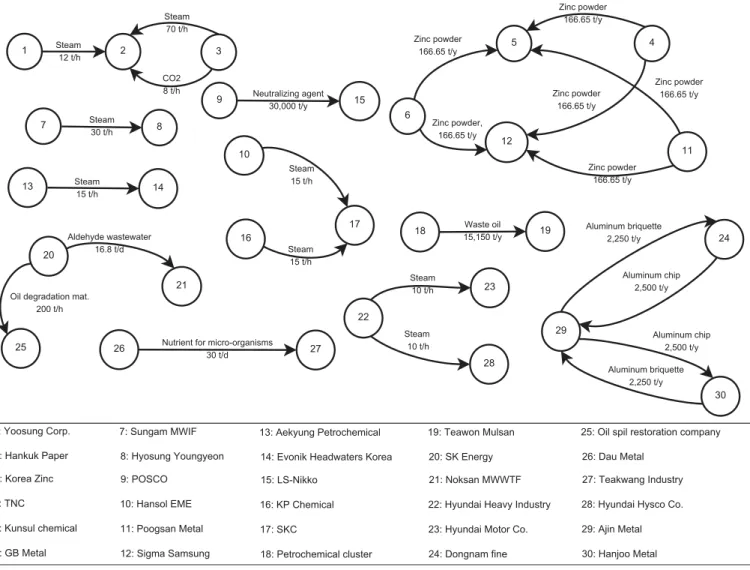
The variety of material exchanges in Ulsan EIP (seeFig. 10) were considered to study the application of the resilience indicator over an EIP with multiple layers. Regarding the information available on the literature, the analysis take into account 8 material exchanges among the firms in the park: steam, zinc powder, oil, neutralizing agents, aldehyde, nutrients for microorganism, aluminum, and carbon dioxide. Each of them forms a layer in the EIP. The third row ofTable 2shows the results obtained for the resilience indicator, and the respective values for NCI and
f
.Table 3shows a comparison among the participants of each layer, with focus on their Flows Adaptability Index.Extending the analysis of the Ulsan steam network in the pre-vious section to the whole Ulsan EIP, the Resilience is low mainly because of the value of NCI. The structure of the Ulsan EIP has many subsystems: non-connected sub-parks. Although this structure is functional to share materials and energy among neighbors, the concept of EIP is not fully developed in the sense of connectivity, and the structure of the park is not as safer as highly connected parks (e.g. Kalundborg). An early application of the Resilience In-dicator at the design phase can improve the capacity of the whole
park to overcome disruptions, and allow decision-makers to mea-sure and compare different alternatives in this field.
4. Discussions
This paper presents an indicator to measure the resilience of an eco-industrial park. This index considers the connectivity of a network and the capacity of the participants to endure a disruptive event. These aspects have been quantified with two sub-indicators: the Network Connectivity Index (NCI) and the Flows Adaptability Index (
f
), respectively. The resilience indicator has been applied to real cases and after this exercise is possible to analyze the perfor-mance of the metric.As defined before, the resilience indicator depends on two in-dexes: the Network Connectivity Index (NCI) and the Flows Adaptability Index (
f
). The first one is a topologic measure of a network, measuring the number of connections among EIP par-ticipants. This characteristic is not exclusive to an industrial context since it is present in every network. The NCI reports the existence of a connection between two members of a network.If a network obtains a high NCI value (near to 1 or 100%) there are many connections among the network participants. If a participant interrupts its activity, other participants in the network will remain connected. It is possible to appreciate this behavior in the water network of Kalundborg (see Fig. 9). This network
obtained a NCI value of 39%, which is high compared with the other cases. In this case, by removing the most connected participant (plant 5: Asnaes Power Plant) the remaining participants will be
still connected through the remaining lines.
If NCI has a near-zero value the network is weakly connected. If a participant disappears from the network there will be isolated members. In the Ulsan steam network (seeFig. 11), a NCI value of 1% is obtained. This value means that if a participant disappears (e.g. participant 2), some members of the network will be unconnected and part of the network is lost.
One goal of a resilient network is to maintain the connectivity in the remaining network when a member interrupts its activity. In this sense, the NCI takes into account this property. The values obtained in both cases are consistent with the described reality.
The second index used to construct the resilience indicator,
f
, isFig. 11. Steam network of Ulsan (obtained fromBehera et al. (2012)). Table 2
Resilience Indicator applied over case studies. The values of NCI andfare also shown.
Case study NCI (%) f(%) Resilience (%) Kalundborg water network 39 86 62
Ulsan steam network 1 17 10 Ulsan EIP (multilayer) 1 18 10
a measure of the network performance. This index focuses on the magnitude of the sharing flows and the feasibility of their substi-tution during disruptions. This characteristic is fundamental in an industrial context and constitutes a difference with other kind of networks. If a network obtains a high value of
f
the participants can endure the absence of any member suffering a disruptive event. For example, a f ¼ 86% is obtained in the water network of Kalund-borg. This value means that if a network participant interrupts its activity (e.g. the Power Buffer Plant) (seeFig. 12a), other members can take over the lost inputs and outputs. This attribute allows the other members to maintain their operations.If the network obtains a low
f
the members within the network will not be able to supply the lost flows. The park could not continue its operation. For example, a f ¼ 17% is obtained in the Ulsan steam network. In this case, if the network loses a participant, for instance Korea Zinc (seeFig. 12b), a participant as Yoosung Corp. cannot change the magnitude of its flows because the defined ca-pacity is not enough to completely endure this event.Another goal of a resilient network is to endure any disruptive event by modifying the magnitude of its flows. The values obtained for
f
are fair with the described cases.An assumption considered over this sub-indicator is regard to the quality (composition) of the substituted flows. To simplify the calculation, consider that all the flows can be substituted by others in a layer of a network no matter the different compositions of them. Since in the reality the quality of the flows is important in order to comply with the requirements of the participants, this aspect can be considered in
f
through the use of different layers. If a set of firms need to comply with certain requirements about flow composition, they can be separated in a different layer and to obtain an additional flayerr. In this way, the quality of the flows isconsidered in the flow adaptability index.
It is worth noting that the value of
f
will depend on the capacity of each firm to change the magnitude of its inputs and outputs.f
also depends on the connectivity. For instance, in the last example, if Hankuk Plant interrupts its activity the remaining participants will not be able to endure this event, because the affected members do not have more connections than the lost ones (seeFig. 11).
The question is whether both factors are independent. As noticed before,
f
depends on the connections.f
depends on NCI. This dependence is sustained on a physical fact: every flow of a certain material requires an existing connection in the network. The aforementioned idea is not reversible, and the existence of a connection does not imply a specific material sharing. The exis-tence of a connection allows the sharing of one material or more. Nevertheless, it is possible to have a physical connection with no sharing flow. NCI does not depend onf
.The proposed resilience indicator is a weighted sum of both
indexes: NCI and
f
. If one of them has a higher influence over the reality it should have more importance in the equation. The same weights were assumed as a first approximation. NCI includes to-pological characteristics of a network, whilef
is related to opera-tive aspects which is supported by its topology. A pending issue is to define specific weights to represent the global resilience in an industrial network. This definition could be constructed on the basis of a comparative analysis of many application cases. An idea to guide this definition is to state what is more important to the resilience of an industrial network: topology or operation.The resilience indicator was created to be applied over EIPs sharing different materials, i.e. parks with multiple layers. This characteristic is captured by
f
through the weighted sum of single layers (flayerr). To simplify the notation, it was assumed that eachlayer had the same specific weight (see Eq.(19)). In other words, all these layers have the same importance for the EIP. As can be seen in the second illustrative case, Ulsan EIP, there is a subset of layers with flayerr equal to 0 (seeTable 3). This situation results in a low
value of
f
for the whole park (18%). Even though this assumption could be correct, it is a pending issue to properly describe the importance of each layer. To cover this point, the number of par-ticipants in a single layer or the criticality of a shared material could indicate the relative importance of a layer. As illustrated inFig. 10, there are many layers with different number of participants.Regarding the resilience indicator, even though it was created with the goal to measure resilience over eco-industrial parks, it can be applied over any system where the participants share materials, e.g. industrial parks, regional integrations, and eco-cities.
The adopted definition of resilience considers the withstanding capacity to undergo a disruptive event. During this work, a disruptive event was assumed as a complete interruption in the activity of a network participant. However, when an industrial plant suffers a disruptive event, it is not always complete. Some-times this event is partial. Even though the proposed indicator does not consider this aspect, it could be modified so as to consider the partial activity interruption of a participant. Since this character-istic is related with the operation of a participant, the flows adaptability index has to be modified. In Eqs.(7) and (10) it is possible to add a term representing this partial activity interruption as follows:
Lin
j$k¼ max n
0; Fj;k$ pinkQj$kouto where j2INkand k2N (22)
Lout i$k¼ max
n
0; Qimin;in$ poutk Qi$kin o where i2OUTkand k2N (23) In this equation, pin
k and poutk 2½0; 1. are the factors representing
Table 3
Flows adaptability index for participants into each layer of Ulsan EIP. Steam Network Zinc Powder Network Oil Network Neutralizing Agents Network Aldehyde Wastewater Network
Nutrient for Micro-organism Network Aluminum Network Carbon Dioxide Network f1¼ 1 f2¼ 0 f3¼ 0:73 f7¼ 0 f8¼ 0 f10¼ 0 f13¼ 0 f14¼ 0 f16¼ 0 f17¼ 0 f22¼ 0 f23¼ 0:25 f28¼ 0:25 f4¼ 1 f5¼ 0:75 f6¼ 1 f11¼ 1 f12¼ 0:75 f18¼ 0 f19¼ 0 f20¼ 0 f25¼ 0 f9¼ 0 f15¼ 0 f20¼ 0 f21¼ 0 f26¼ 0 f27¼ 0 f24¼ 0:52 f29¼ 0 f30¼ 0:52 f2¼ 0 f3¼ 0
the partial stop of a firm for its input and output flows, respectively. These factors are defined as 1 when a firm completely stops its operation.
Another aspect to discuss is the probability of disruptions. The definition of resilience considers that every participant has the same risk to suffer a disruptive event. However, the reality is different: there are firms with highly effective prevention programs to avoid stops in production while other ones are unstable. This fact can be translate into a probability of suffering a disruptive event. This value could be estimated taking into account the history of each participant. To consider this probability in the resilience in-dicator, the flows adaptability index should be modified since the disruption probability is an operative characteristic of each firm. As shown in Eq.(17), this index is applied over each firm and averaged to calculate flayerr. This average can be replaced by a weighted sum,
where the weights are calculated over respective disruption probabilities.
The configuration of an EIP can be based on sharing material or energy in a network. For example, in the steam network of Ulsan (seeFig. 11), even though the main focus is material sharing, it is also important the temperature since the participants could need to comply with certain operational requirements to work. The resil-ience indicator should also consider the case of energy networks. In this work the resilience indicator is conceived for material net-works, based on its connections and sharing flows. Beside analo-gous characteristics from energy networks, it is deemed necessary to include the temperature of each flow as a constraint to sharing and substitution of flows during disruptions. These constraints come from heat transfer gradients. Since the indicator herein pro-posed has considered the connections and the flows of a network, it is adapted to measure the resilience of material networks. The extension of this indicator to consider temperatures, or the devel-opment of a new resilience indicator for heat transfer networks, can be addressed in further work.
5. Conclusions
The previous sections have proposed a resilience indicator to assess EIPs. This indicator is based on two important aspects of an industrial network: its topology and its operation. These main ideas sustain the creation of two sub-indicators oriented to measure the connectivity and flexibility of flows, respectively.
The novelty of the proposed indicator lies into consider the dynamic of the assessed eco-industrial park after one of their participants suffers a disruptive event, taking into account the de-cision of the remaining firms to modify their input and output flows to absorb this perturbation and to prevent the fault propagation on the park. The resilience indicator is constructed to support the evaluation of multi-layer park, where more than one material is shared.
The resilience indicator has been created for both assessing and designing eco-industrial parks. The design phase can be addressed with optimization tools. In this context, the resilience indicator can be included in a multi-objective formulation. The objectives of this formulation can also cover environmental, social, and economic dimensions of the sustainability, so as to improve the performance of the whole park by design.
The proposed indicator has been applied over two illustrative cases based on two known EIPs: Kalundborg, in Denmark; and Ulsan, in South Korea. The application over these parks shows a significant potential in Ulsan EIP to improve its resilience, which is conditioned by the structure of the park.
There is a possible improvement in this development: the defined sub-indicators are not independent. This dependence is
sustained on physics, because the existence of a flow requires a connection. This idea backs up the dependence of
f
on NCI. This limitation can be overcome in the future by calculating the resil-ience indicator through a weighted sum of NCI andf
. The specific weighs must be properly defined taking into account the afore-mentioned dependence, since one of them may be overestimated. Industrial stakeholders should define which aspect is more important in the network: topology or operation.In the future, the resilience indicator can be modified in order to capture a more realistic behavior of an EIP, where some firms are most likely to suffer a disruptive event or they have contingency plans in this situations. For example, the indicator can consider partial disruptive events over the participants of the park. It is also possible to include the probability of each firm to suffer a disruptive event. Since both of them are related to operative aspects, these changes could be addressed by modifying
f
.The proposed indicator measures the resilience of material network, taking into account connections and flows among the participants. Since an EIP can be configured to share material or / and energy, the extension of this indicator to heat transfer net-works is proposed for further work.
Acknowledgments
Felipe A. Díaz-Alvarado wants to thank the FCFM grant Apoyo a
la Inserci!on Acad!emica 2016; University of Chile. This project was
financed by CONICYT/FONDECYT de Iniciaci!on en
Investigaci!on/2017-11170042.
Guillermo Valenzuela-Venegas: This work was funded by the
CONICYT-PCHA/Doctorado Nacional/2014-21140400.
References
Behera, S.K., Kim, J.H., Lee, S.Y., Suh, S., Park, H.S., 2012. Evolution of ‘designed’ industrial symbiosis networks in the Ulsan Eco-industrial Park: ‘research and development into business’ as the enabling framework. J. Clean. Prod. 29e30, 103e112. https://doi.org/10.1016/j.jclepro.2012.02.009. www.sciencedirect. com/science/article/pii/S0959652612000832.
Biegler, L.T., Grossmann, I.E., 2004. Retrospective on optimization. Comput. Chem. Eng. 28, 1169e1192.https://doi.org/10.1016/j.compchemeng.2003.11.003.www. sciencedirect.com/science/article/pii/S0098135403003089.
Boix, M., Montastruc, L., Azzaro-Pantel, C., Domenech, S., 2015. Optimization methods applied to the design of eco-industrial parks: a literature review. J. Clean. Prod. 87, 303e317.https://doi.org/10.1016/j.jclepro.2014.09.032.www. sciencedirect.com/science/article/pii/S0959652614009627.
Boix, M., Montastruc, L., Pibouleau, L., Azzaro-Pantel, C., Domenech, S., 2011. A multiobjective optimization framework for multicontaminant industrial water network design. J. Environ. Manag. 92, 1802e1808. https://doi.org/ 10.1016/j.jenvman.2011.02.016. www.sciencedirect.com/science/article/pii/ S030147971100065X.
Boix, M., Montastruc, L., Pibouleau, L., Azzaro-Pantel, C., Domenech, S., 2012. In-dustrial water management by multiobjective optimization: from individual to collective solution through eco-industrial parks. J. Clean. Prod. 22, 85e97.
https://doi.org/10.1016/j.jclepro.2011.09.011. www.sciencedirect.com/science/ article/pii/S0959652611003428.
Chae, S.H., Kim, S.H., Yoon, S.G., Park, S., 2010. Optimization of a waste heat utili-zation network in an eco-industrial park. Appl. Energy 87, 1978e1988.https:// doi.org/10.1016/j.apenergy.2009.12.003. www.sciencedirect.com/science/ article/pii/S0306261909005261.
Chertow, M., 2008. Industrial ecology in a developing context. In: Clini, C., Musu, I., Gullino, M. (Eds.), Sustainable Development and Environmental Management SE - 24. Springer Netherlands, pp. 335e349. https://doi.org/10.1007/978-1-4020-8229-0_24.
Chertow, M.R., 2000. INDUSTRIAL SYMBIOSIS: literature and taxonomy. Annu. Rev. Energy Environ. 25, 313e337.https://doi.org/10.1146/annurev.energy.25.1.313.
www.annualreviews.org/doi/full/10.1146/annurev.energy.25.1.313.
Chopra, S.S., Khanna, V., 2012. Toward a network perspective for understanding resilience and sustainability in industrial symbiotic networks. In: IEEE Inter-national Symposium on Sustainable Systems and Technology.https://doi.org/ 10.1109/ISSST.2012.6227987.
Chopra, S.S., Khanna, V., 2014. Understanding resilience in industrial symbiosis networks: insights from network analysis. J. Environ. Manag. 141, 86e94.
https://doi.org/10.1016/j.jenvman.2013.12.038.
by-product synergy networks. J. Ind. Ecol. 15, 315e332.https://doi.org/10.1111/ j.1530-9290.2010.00310.x.
Fiksel, J., 2003. Designing resilient, sustainable systems. Environ. Sci. Technol. 37, 5330e5339.https://doi.org/10.1021/es0344819.
Goel, S., Belardo, S., Iwan, L., 2004. A Resilient Network that Can Operate under Duress: to Support Communication between Government Agencies during Crisis Situations.https://doi.org/10.1109/HICSS.2004.1265312.
Haslenda, H., Jamaludin, M., 2011. Industry to Industry By-products Exchange Network towards zero waste in palm oil refining processes. Resour. Conserv. Recycl. 55, 713e718. https://doi.org/10.1016/j.resconrec.2011.02.004. www. sciencedirect.com/science/article/pii/S092134491100036X.
Jacobsen, N.B., 2006. Industrial symbiosis in Kalundborg, Denmark - a quantitative assessment of economic and environmental aspects. J. Ind. Ecol. 10, 239e255.
https://doi.org/10.1162/108819806775545411.
Kalundborg Symbiosis, 2015. Kalundborg Symbiosis Is the World's First Working Industrial Symbiosis.www.symbiosis.dk/en.
Knight, P., 1990. A rebirth of the pioneering spirit. Financ. Times 14, 15.
Kuznetsova, E., Zio, E., Farel, R., 2016. A methodological framework for Eco-Industrial Park design and optimization. J. Clean. Prod. 126, 308e324.https:// doi.org/10.1016/j.jclepro.2016.03.025. www.sciencedirect.com/science/article/ pii/S0959652616300853.
Li, X., Xiao, R., 2017. Analyzing network topological characteristics of eco-industrial parks from the perspective of resilience: a case study. Ecol. Indic. 74, 403e413.
https://doi.org/10.1016/j.ecolind.2016.11.031. linkinghub.elsevier.com/retrieve/ pii/S1470160X16306689.
Liew, P.Y., Wan Alwi, S.R., Varbanov, P.S., Manan, Z.A., Kleme$s, J.J., 2013. Centralised utility system planning for a total site heat integration network. Comput. Chem. Eng. 57, 104e111. https://doi.org/10.1016/j.compchemeng.2013.02.007. www. sciencedirect.com/science/article/pii/S0098135413000549.
Lovelady, E.M., El-Halwagi, M.M., 2009. Design and integration of eco-industrial parks for managing water resources. Environ. Prog. Sustain. Energy 28, 265e272.https://doi.org/10.1002/ep.10326.
Lowe, E.A., 2001. Eco-industrial Park Handbook for Asian Developing Countries. Technical Report. Asian Development Bank.indigodev.com/ADBHBdownloads. html.
Matta, J., Borwey, J., Ercal, G., 2014. Comparative Resilience Notions and Vertex Attack Tolerance of Scale-free Networks. CoRR abs/1404.0103, pp. 1e9. arXiv: arXiv:1404.0103v1.arxiv.org/abs/1404.0103.
Montastruc, L., Boix, M., Pibouleau, L., Azzaro-Pantel, C., Domenech, S., 2013. On the flexibility of an eco-industrial park (EIP) for managing industrial water. J. Clean.
Prod. 43, 1e11. https://doi.org/10.1016/j.jclepro.2012.12.039. www. sciencedirect.com/science/article/pii/S0959652612006956.
Ramos, M.A., Boix, M., Aussel, D., Montastruc, L., Domenech, S., 2016. Water inte-gration in eco-industrial parks using a multi-leader-follower approach. Comput. Chem. Eng. 87, 190e207.https://doi.org/10.1016/j.compchemeng.2016.01.005. Rubio-Castro, E., Ponce-Ortega, J.M., Serna-Gonz!alez, M., Jim!enez-Guti!errez, A.,
El-Halwagi, M.M., 2011. A global optimal formulation for the water integration in eco-industrial parks considering multiple pollutants. Comput. Chem. Eng. 35, 1558e1574. https://doi.org/10.1016/j.compchemeng.2011.03.010. www. sciencedirect.com/science/article/pii/S0098135411001001.
Tietze-St€ockinger, I., Fichtner, W., Rentz, O., 2004. A model to minimize joint total costs for industrial waste producers and waste management companies. Waste Manag. Res. 22, 466e476.https://doi.org/10.1177/0734242X04048522. wmr. sagepub.com/content/22/6/466.abstract.
Tiu, B.T.C., Cruz, D.E., 2017. An MILP model for optimizing water exchanges in eco-industrial parks considering water quality. Resources. Conserv. Recycl. 119, 89e96. https://doi.org/10.1016/j.resconrec.2016.06.005. linkinghub.elsevier. com/retrieve/pii/S0921344916301422.
Tudor, T., Adam, E., Bates, M., 2007. Drivers and limitations for the successful development and functioning of EIPs (eco-industrial parks): a literature review. Ecol. Econ. 61, 199e207.https://doi.org/10.1016/j.ecolecon.2006.10.010.www. sciencedirect.com/science/article/pii/S0921800906005453.
Valenzuela-Venegas, G., Salgado, J.C., Díaz-Alvarado, F.A., 2016. Sustainability in-dicators for the assessment of eco-industrial parks: classification and criteria for selection. J. Clean. Prod. 133, 99e116. https://doi.org/10.1016/j.jcle-pro.2016.05.113.linkinghub.elsevier.com/retrieve/pii/S0959652616305856. Xiao, Z., Cao, B., Sun, J., Zhou, G., 2016. Culture of the stability in an eco-industrial
system centered on complex network theory. J. Clean. Prod. 113, 730e742.
https://doi.org/10.1016/j.jclepro.2015.11.096. linkinghub.elsevier.com/retrieve/ pii/S0959652615018272.
Zeng, Y., Xiao, R., Li, X., 2013. A resilience approach to symbiosis networks of ecoindustrial parks based on cascading failure model. Math. Problems Eng. 2013, 1e11.https://doi.org/10.1155/2013/372368.
Zhang, B.J., Xu, T., He, C., Chen, Q.L., Luo, X.L., 2017. Material stream network modeling, retrofit and optimization for raw natural gas refining systems. J. Clean. Prod. 142, 3419e3436. https://doi.org/10.1016/j.jclepro.2016.10.124.
linkinghub.elsevier.com/retrieve/pii/S0959652616317553.
Zhu, J., Ruth, M., 2013. Exploring the resilience of industrial ecosystems. J. Environ. Manag. 122, 65e75.https://doi.org/10.1016/j.jenvman.2013.02.052.linkinghub. elsevier.com/retrieve/pii/S0301479713001503.