Any correspondence concerning
this service should be sent
to the repository administrator: tech-oatao@listes-diff.inp-toulouse.fr
This is an author’s version published in:
http://oatao.univ-toulouse.fr/23150
To cite this version:
Fraslin, Clémence and Dechamp, Nicolas and Bernard, Maria
[et al.]
Quantitative trait loci for resistance to Flavobacterium
psychrophilum in rainbow trout: effect of the mode of infection
and evidence of epistatic interactions.
(2018) Genetics
Selection Evolution, 50 (1). 50-60. ISSN 0999-193X
Official URL:
https://doi.org/10.1186/s12711-018-0431-9
Open Archive Toulouse Archive Ouverte
OATAO is an open access repository that collects the work of Toulouse
researchers and makes it freely available over the web where possible
RESEARCH ARTICLE
Quantitative trait loci for resistance
to Flavobacterium psychrophilum in rainbow
trout: effect of the mode of infection
and evidence of epistatic interactions
Clémence Fraslin
1,2, Nicolas Dechamp
1, Maria Bernard
3, Francine Krieg
1, Caroline Hervet
1,6, René Guyomard
1,
Diane Esquerré
4, Johanna Barbieri
4, Claire Kuchly
4, Eric Duchaud
5, Pierre Boudinot
5, Tatiana Rochat
5,
Jean‑François Bernardet
5and Edwige Quillet
1*Abstract
Background: Bacterial cold‑water disease, which is caused by Flavobacterium psychrophilum, is one of the major diseases that affect rainbow trout (Oncorhynchus mykiss) and a primary concern for trout farming. Better knowledge of the genetic basis of resistance to F. psychrophilum would help to implement this trait in selection schemes and to investigate the immune mechanisms associated with resistance. Various studies have revealed that skin and mucus may contribute to response to infection. However, previous quantitative trait loci (QTL) studies were conducted by using injection as the route of infection. Immersion challenge, which is assumed to mimic natural infection by F.
psy-chrophilum more closely, may reveal different defence mechanisms.
Results: Two isogenic lines of rainbow trout with contrasting susceptibilities to F. psychrophilum were crossed to produce doubled haploid F2 progeny. Fish were infected with F. psychrophilum either by intramuscular injection (115 individuals) or by immersion (195 individuals), and genotyped for 9654 markers using RAD‑sequencing. Fifteen QTL associated with resistance traits were detected and only three QTL were common between the injection and immer‑ sion. Using a model that accounted for epistatic interactions between QTL, two main types of interactions were revealed. A “compensation‑like” effect was detected between several pairs of QTL for the two modes of infection. An “enhancing‑like” interaction effect was detected between four pairs of QTL. Integration of the QTL results with results of a previous transcriptomic analysis of response to F. psychrophilum infection resulted in a list of potential candidate immune genes that belong to four relevant functional categories (bacterial sensors, effectors of antibacterial immu‑ nity, inflammatory factors and interferon‑stimulated genes).
Conclusions: These results provide new insights into the genetic determinism of rainbow trout resistance to F.
psychrophilum and confirm that some QTL with large effects are involved in this trait. For the first time, the role of epi‑
static interactions between resistance‑associated QTL was evidenced. We found that the infection protocol used had an effect on the modulation of defence mechanisms and also identified relevant immune functional candidate genes.
© The Author(s) 2018. This article is distributed under the terms of the Creative Commons Attribution 4.0 International License (http://creat iveco mmons .org/licen ses/by/4.0/), which permits unrestricted use, distribution, and reproduction in any medium, provided you give appropriate credit to the original author(s) and the source, provide a link to the Creative Commons license, and indicate if changes were made. The Creative Commons Public Domain Dedication waiver (http://creat iveco mmons .org/ publi cdoma in/zero/1.0/) applies to the data made available in this article, unless otherwise stated.
Open Access
*Correspondence: edwige.quillet@inra.fr
1 GABI, INRA, AgroParisTech, Université Paris‑Saclay, 78350 Jouy‑en‑Josas,
France
Background
Rainbow trout (Oncorhynchus mykiss) is a freshwater fish farmed in almost every continent, with production estimated at around 813,000 tons in 2014 (FAO). With the increase in production, resistance to diseases has become a major field of research in order to limit eco-nomic losses associated with diseases. Flavobacterium psychrophilum is the causative agent of bacterial cold-water disease (BCWD) also called rainbow trout fry syn-drome in small fish [1, 2]. BCWD occurs worldwide and, according to [3], it is the second most important trout disease that affects French farms. It causes high mortali-ties (up to 70%) and deformimortali-ties may occur in surviving fish [1, 2, 4], with important economic impacts. In spite of intensive research to develop efficient vaccines [5–7] and the recent commercialisation of a vaccine in some
countries (ALPHA JECT ® IPNV-Flavo 0.025
PHAR-MAQ), the usual way to combat the disease remains the use of antibiotic treatments, which raises environmental concerns and issues about the emergence of antibiotic resistance [8–10]. Therefore, there is a crucial need for other methods to control the disease. Selective breed-ing for natural genetic resistance to F. psychrophilum is a promising approach since previous studies have revealed the existence of genetic variation for this trait. Moder-ate heritabilities were estimModer-ated in European and North American domestic broodstocks [11–13], and Leeds et al. [14] demonstrated that genetic gain could be obtained in experimental conditions after two generations of selec-tion. Quantitative trait loci (QTL) associated with resist-ance measured as time to death or survival have been detected using linkage or association studies [15–20] in which resistance to F. psychrophilum was assessed using injection protocols for experimental infection.
Madsen and Dalsgaard [21] and Garcia et al. [22] compared injection (intraperitoneal or intramuscu-lar), immersion, immersion combined with stress (skin lesion or formalin treatment) and cohabitation with infected fish as infection challenge methods with F. psy-chrophilum. They concluded that the injection method was more reproducible than immersion and observed a higher mortality rate after injection challenge (70– 90%), than after immersion challenge (30–55%). How-ever, injection is a route of infection that bypasses the physical and immune barriers of skin and mucosa, and likely modifies the tissues that are targeted by the pri-mary infection within the host. Similar differences between infection routes were also reported for other bacterial and viral pathogens that affect rainbow trout, such as Yersinia ruckeri [23], the infectious hematopoi-etic necrosis virus [24], and the viral haemorrhagic septicaemia virus [25]. Infection with F. psychrophilum seemed to be more efficient when fish were stressed
by formalin treatment or when the skin was damaged prior to immersion [21, 22, 26, 27], which suggests that external barriers hinder entry of the bacteria. F. psy-chrophilum has been observed in the skin mucus, in gills, and in connective tissue of the fins and operculum of salmonid fish [28, 29], but the precise sites of entry of the pathogen remain unknown. Epithelia (skin, gills, nasopharynx and gut) are considered important portals of entry of pathogens [25, 30], even if the mucus layer constitutes an efficient barrier. Mucus contains multi-ple antimicrobial factors, such as lysozyme, proteins of the complement system, heat shock proteins or immu-noglobulins, which are involved in specific or non-specific defence mechanisms [31–34]. In fact, many bacteria, both commensal and pathogenic, are com-monly found in the mucus, and adhesion to mucus is a classical virulence factor [35, 36]. Composition of the skin microbiota, which plays a protective role against infection [37, 38], is partly under genetic control, and QTL that are associated with abundance of some bacte-rial genera that are known to provide protection against pathogens have been identified [37].
Immersion challenge with F. psychrophilum prob-ably reflects natural infection of rainbow trout bet-ter than injection. Thus, we developed a reproducible immersion challenge that does not involve preliminary stress [39] and used it to investigate the genetic varia-tion of trout resistance to F. psychrophilum. Compared to injection challenge, immersion challenge may reveal QTL that drive defence mechanisms associated either with the entry of the bacterium into the host or with the host response once the pathogen has entered via the “natural” route, expanding the possibility of inves-tigation of host antibacterial response. In this study, we took advantage of homozygous doubled haploid (DH) trout lines with contrasting susceptibilities to F. psy-chrophilum to search for resistance-associated QTL, using both routes of infection, as a first step towards a better understanding of the host response to infec-tion and the identificainfec-tion of candidate (causative) genes. Investigating the resistance to F. psychrophi-lum is difficult since the establishment of reproducible experimental challenges, especially with immersion protocols, is very complicated. DH isogenic lines with contrasting resistance levels to F. psychrophilum rep-resent a very useful resource to perform such experi-mental challenges and to identify susceptible versus resistant genetic backgrounds. Moreover, the use of DH lines allows powerful and simple genetic analyses [40, 41] with designs that are relevant to investigate inter-actions between QTL. Such interinter-actions likely contrib-ute to the variability of complex traits [42] but, to date, have been scarcely investigated.
Methods
Experimental QTL family
At INRA, we have established a collection of 16 isogenic homozygous rainbow trout lines that were derived from the INRA SY rainbow trout population after two gen-erations of gynogenetic reproduction and further prop-agated by within-line single pair mating [43]. The lines have been screened for resistance to various diseases including several viruses [43–45] and more recently, for resistance to F. psychrophilum, using either injection or immersion as routes of infection [46, and unpublished results].
In this study, we selected two lines (B57 and AP2) with contrasting resistance to F. psychrophilum as F0 grand-parents to produce the QTL family. Overall, line AP2 ranked among the most resistant of the 16 lines whereas B57 was consistently more susceptible (see Additional file 1: Figure S1).
One B57 female was mated to one AP2 sex-reversed male to produce a F1 isogenic family, consisting of all females that share the same genetic background and that are heterozygous at loci for which different alleles were fixed in the two F0 isogenic lines. One single F1 female was reproduced using mitotic gynogenesis in order to produce the QTL mapping family. Eggs were fertilized with UV-genetically inactivated milt and heat-shocked soon after fertilization in order to produce DH progeny by inhibition of the first embryonic mitosis [47]. Thus, the resulting offspring carried only one grandparental allelic variant at each locus. Males that were homozy-gous for a dominant body colour variant (golden pheno-type) were used as milt donors for gynogenesis. The lack of golden fry in the progeny and of surviving fry in the haploid control (no heat-shock after fertilization with irradiated milt) served as control of the efficiency of the irradiation process.
Since DH progeny are homozygous, the power of QTL detection is increased by accurate evaluation of the effect of allelic substitution [40, 41, 48]. In the context of the recent whole-genome duplication event that occurred in the salmonid ancestor, DH individuals can also facilitate single nucleotide polymorphism (SNP) calling and geno-typing in rainbow trout, and decrease the false discovery rate of paralogous sequence variants (PSV) as putative true allelic SNP variants [49].
F0 and F1 breeders were reared and spawned at the INRA PEIMA experimental farm (Sizun, France). The F2 progeny were incubated at the PEIMA farm. Eyed eggs were transported to the INRA IERP facilities (Jouy-en-Josas, France), iodine disinfected, and placed into rearing units that were supplied with recirculated, de-chlorinated tap water at a constant temperature of 10 °C. In total, 558 F2 progeny were produced, among which 372 were
used for QTL detection (genotyping and phenotyping in infectious challenge). The 186 remaining un-phenotyped progeny were added to the genotype dataset in order to construct a more precise linkage map. At about three months post-hatching, the 372 QTL progeny were anaes-thetized with 2-phenoxyethanol (0.2 mL/L), individu-ally tagged (intraperitoneal implantation of a micro chip “Biolog-Tiny ID”) and reared under standard conditions (constant 10 °C and a commercial diet) until infectious challenges.
Phenotyping for resistance to F. psychrophilum
Two different routes of infection, i.e. immersion and intramuscular injection, were compared. In both cases, fish were inoculated with F. psychrophilum FRGDSA 1882/11, a strain that was isolated in 2011 from a dis-eased rainbow trout during a severe outbreak in a trout farm in the South-West of France and belonging to the clonal complex CC-ST90 [50]. For both immersion and injection challenges, F. psychrophilum was grown at 18 °C in TYES broth on a rotatory shaker at 200 rpm until late exponential phase (OD600 approximately 1). Broth
cul-tures were used for infection experiments following a posteriori bacteria counting by inoculation of serial dilu-tions on agar and counting of visible colonies after 48 h of incubation at 18 °C.
The immersion challenge was carried out when fish were about 5 months old, with a mean body weight of 4.7 ± 1.3 g. Prior to infection, 225 fish were randomly sampled from the QTL progeny and equally distributed into three 10-L aquaria. Each fish was weighed and its individual tag was recorded. After a few days of acclima-tion, fish were infected by immersion for 4 h in a bacte-rial suspension (approximately 8.107 cfu/mL) in static
water maintained at 10 °C with vigorous aeration. Bacte-ria were counted in water as above. Preliminary tests had revealed that F. psychrophilum strain FRGDSA 1882/11 is highly virulent when inoculated by injection and causes extremely high mortality in young fish. In order to fine-tune the level of the infectious dose and to be able to dis-criminate between susceptible and resistant fish for QTL detection, the injection challenge was performed when fish reached a larger size (around 8 months old with a mean body weight of 21.5 ± 6.9 g).
For the injection challenge, the broth culture was cen-trifuged and bacterial cells were rinsed once in saline buffer. Drops (25 µL) of serial dilutions of bacterial sus-pension were inoculated on agar for counting. As for immersion, 147 F2 progeny were randomly distributed into three 10-L aquaria (47–50 fish per aquarium). After a few days of acclimation, fish were anaesthetized and received an intramuscular injection of 50 µL of bacterial
suspension, corresponding to approximately 145 CFU/ fish, close to the dorsal fin.
After infection (immersion or injection), fish were kept at 10 °C with adequate water flow. Two fish that died within the first 2 days after infection were discarded (one for each challenge). Mortality was monitored twice a day. Dead fish were identified individually by tag recording. When mortality reached a plateau (49 and 35 days for the immersion and injection challenge, respectively), surviv-ing fish were sacrificed by anaesthetic overdose, weighed and identified. A piece of caudal fin was clipped from all individuals at the time of identification and stored in 100% ethanol for DNA extraction. Two fish from the immersion challenge and three fish from the injection challenge were discarded because tag recording was not possible. For each challenge, the post-challenge dataset included body weight at the time of challenge, survival status of each fish (dead or alive at the end of the chal-lenge) and time to death (in days after infection, for dead fish only).
SNP genotyping
RAD sequencing and library preparation
In total, DNA was extracted from 555 fin samples using the Wizard Genomic DNA purification kit (Promega) with an RNAse step. Total DNA was quantified by meas-uring optical density at 260 nm (OD260) with a Qubit
fluorometer. DNA quality was assessed by the OD260/
OD280 ratio and by visual control on gel
electrophore-sis. All samples were diluted to 100 ng/µL before they were sent for RAD sequencing. Samples included the two F0 grandparents (AP2 and B57), the F1 female par-ent (and another isogenic F1 individual as backup) and 551 F2 DH progeny, among which the 365 progeny used for QTL detection (222 for immersion and 143 for injec-tion, respectively) and the 186 additional F2 progeny that were genotyped only to strengthen SNP calling and the linkage map. To ensure sufficient sequencing depth of breeders, samples of the F0 and F1 parents were repli-cated (four replicates for F0 and eight replicates for F1). DNA samples were sent to the GeT-PlaGe sequencing platform ([51], Toulouse, France,) for restriction-site-associated DNA sequencing (RADseq) according to the protocol in [52]. Each DNA sample was digested with the SbfI restriction enzyme and then barcoded by adding P1 adaptors, which contained a 5-bp nucleotide barcode that differed by at least three nucleotides. Twelve sequencing libraries were generated with 48 pooled samples. Librar-ies were subsequently cut to a size of less than 800 bp by sonication. After size selection (250 bp on average) on agarose gel, the pooled libraries were purified, ligated to a P2 adaptor, and amplified by PCR. RAD libraries were paired-end sequenced (100 bp paired-end reads)
on an Illumina HiSeq 2500 sequencer at the GeT-PlaGe sequencing platform.
Single nucleotide polymorphism discovery and genotyping
First, sequencing reads were demultiplexed and assigned to a single individual allowing no mismatch in the P1 bar-code and one mismatch in the restriction site. Data from seven samples from F2 progeny that had less than one million reads were removed from the analysis. In order to facilitate detection of PSV [49], the dataset was supple-mented with 20 DH individuals that were used as exter-nal controls. These DH individuals were sequenced in previous projects using the same RAD-sequencing meth-odology and restriction enzyme (unpublished data).
For SNP calling, sequence reads were processed through a de novo analysis using the core pipeline of the software Stacks version 1.19 [53, 54]. PCR duplicates were removed using the Stacks clone-filter program. Reads from replicates of the F0, F1 and F2 individuals were merged into a single sequence file per individual. In a first step, the ustacks program was used to iden-tify putative loci for each sample. The minimum depth of coverage required to create a stack (group of iden-tical reads or putative allele) was set at 3 (-m option), while the maximum distance allowed between stacks, was set at 2 nucleotides (-M option). These nucleotide differences take potential SNP and sequencing errors into account. Only primary reads were used (-N option equal to 0). The maximum number of stacks (i.e. maxi-mum number of alleles) at a single de novo locus was set at 2 (max_locus_stacks option) in order to allow detec-tion of putative duplicated loci. Next, the cstacks pro-gram was used to create a catalogue of loci by setting the number of mismatches allowed between samples to 1 (-n option). Finally, genotypes of all individuals (F0, F1, F2 and DH controls) were called using the sstacks program that matches individual stacks against the catalogue. The Stacks population program was used to calculate the fre-quency of genotypes at each locus.
Quality control of SNPs and removal of duplicated loci
Sequence data from the two F1 individuals were used to identify polymorphic and monomorphic loci. To be con-sistent with the pedigree of the QTL family (DH progeny of a cross between two DH homozygous grandparents), only bi-allelic loci were considered (17,460 out of 20,305 polymorphic loci identified in the Stacks catalogue).
DH control population The two F0 grandparents and the 20 external DH individuals served as controls to detect putative duplicated loci. Since all DH individuals are expected to be homozygous, a heterozygous genotype at a given locus indicates a PSV rather than a true allelic variant. Therefore, all loci that appeared heterozygous in
at least two DH control individuals were discarded (list provided in Additional file 2: Table S1).
Filtering of loci and individuals Sequence data from 37 individuals were removed because of technical prob-lems. Filtering of loci and individuals was based on call rate and call frequency as follows: F2 individuals with genotype calls for less than 20% of genotyped loci and loci with genotype calls for less than 70% of F2 individu-als were discarded. Homozygosity for each F2 individual was checked on the 11,570 remaining loci and 24 fish were found to have a heterozygosity rate higher than 1%. Previous studies performed on isogenic lines [45, 49] assumed that residual heterozygous loci may be due to unreduced ova, donor milt contamination, mutation or sequencing errors. We did not find any F2 individual that was heterozygous at loci where the two grandpar-ents shared the same allele, so contamination by donor milt was excluded. Spontaneous retention of a sec-ond polar body is suspected to be at the origin of unre-duced ova. Under this hypothesis, a number of loci will retain the heterozygosity of the mother, at a frequency that depends on recombination during meiosis [40, 55]. Since recombination rates are higher in telomeric than centrometric regions of chromosomes [56, 57], a higher residual heterozygosity level is expected in telomeric regions. For the 24 fish that had an overall heterozygous rate higher than 1% (min: 1.12%; max: 65.04%), a gradi-ent of heterozygosity rate was observed along the chro-mosome arms, which was consistent with the proportion of heterozygous loci being higher in telomeric regions than around the centromere (see Additional file 3: Figure S2). This supports the hypothesis that the 24 F2 prog-eny that exhibited a high frequency of heterozygous loci probably originated from spontaneously unreduced ova. Those individuals were discarded from the analysis. The remaining F2 fish had a heterozygosity rate lower than 1% and were considered as true doubled haploids. The remaining heterozygous loci were considered to result from sequencing errors or mutations and were set to missing genotypes before the last filtering step based on minor allele frequency (MAF) and individual coverage. Since the F2 fish were produced by mitotic gynogen-esis from a single F1 female, a 1:1 ratio was expected for the alternative F0 alleles (AP2 and B57). Therefore, the remaining loci with a MAF lower than 0.30 were filtered out. In the end, only fish with more than 90% of called genotypes were kept for further analysis.
Construction of the linkage map
The 1.2 version of the CarthaGène software [58, 59] was used to build the F2 family linkage map. The DH progeny were described as a backcross in the CarthaGène soft-ware. The group command was used, with the thresholds
for two-point distance (Haldane/Ray) and logarithm of odds (LOD) set at 0.3 and 15, respectively. Linkage groups were assigned to trout chromosomes by blasting the sequences of RAD markers on the most recent pub-lished reference trout genome, Omyk_1.0 [60].
QTL detection
QTL mapping was performed by chromosome with the QTLMap software [61] (version 0.9.8). For each chromo-some, the hypothesis that one QTL (H1) versus no QTL (H0) affects the trait of interest was tested with the inter-val mapping method described in [62], using an approxi-mate likelihood ratio test (LRT [63]) and scanning the chromosome in intervals of 1 cM. To take into account the fact that the F2 individuals are gynogenetic dou-bled haploids, they were coded as half-sib from a single sire (F1) and an unknown virtual dam that was different for each F2 fish [41]. The two challenges, injection and immersion, were analysed separately. The effects of body weight at challenge and aquarium on survival were tested with the average-to-average method (ANOVA) model on time to death and the logistic regression on the status as the end of the challenge with the R software, version 3.4.2 [64]. The effect of body weight was never significant but the aquarium effect was significant in all cases.
Using a model M1 that included aquarium as the only fixed effect, RESISTANCE was assessed using the uni-trait Cox model option (calcul = 7; [61]) in QTLMap. Cox model fits a survival analysis model that makes no assumption on the trait distribution and that takes time to death and censoring into account [65, 66]. Surviving fish at the end of the period of survey corresponded to ‘censored’ observations, i.e. the expected event (death) was not observed during the observation period. In this analysis, the QTL effect is calculated for each genotype (allele) as a relative risk, with the B57 line origin taken as the reference (relative risk = 1). STATUS (dead/alive) was also analysed as a trait of practical interest for breeders, using the unitrait discrete distribution option of QTL-Map (calcul = 2; [61]) with value 1 for survivors and 0 for dead fish. Using the variable STATUS, it was also possi-ble to refine the model to search for additional QTL that might have been masked by effects of the main QTL and/ or by epistatic interactions between QTL. A new model ( M2 ) was applied, in which aquarium and the QTL detected for STATUS with model M1 were considered as fixed effects, along with interactions between the QTL used as co-factor and the newly detected QTL. To control the false discovery rate due to multiple-testing, the P val-ues associated with interactions were corrected with the Benjamini–Hochberg method (BH) [67] implemented in the R software, version 3.4.2 [64] (stat package version 3.6.0, option p.adjust). Finally, ENDURANCE, which was
defined as the time until death for fish that died during the experimental period [68], was investigated as a com-plementary description of possible host–pathogen inter-action during infection. ENDURANCE was measured in dead fish only and was analysed using the unitrait Gauss-ian distribution option of QTLMap with model M1.
For each chromosome, when a QTL was suspected, the empirical distribution of the LRT was obtained with QTLMap from 1000 simulations (for STATUS and ENDURANCE) or permutations (for RESISTANCE) under the null hypothesis with trait heritability fixed at 0.5 for each chromosome. Then, we estimated the type-I error rejection threshold of H0 at the chromosome-wide level using the method described by Harrell and Davis [69]. A QTL with a chromosome-wide P ≤ 0.01 was considered significant. For each QTL that was chromosome-wide significant at P ≤ 0.001, the genome-wide level significance threshold was tested with 10,000 simulations/permutations under H0 and a Bonferroni correction to adjust the type-I error for number of chro-mosomes. Under H1, the QTL effect was estimated as the allelic substitution effect in a standard F2 progeny. Because progeny were doubled haploids, this effect cor-responds to half the difference between the mean values of the trait in the two alternative homozygous progeny. The 95% confidence intervals (95% CI) of the QTL were obtained using the method of Li [70], in which the distri-bution of QTL locations is approximated from likelihood. For each significant QTL and each trait, we identified the grandparental origin of the allele at the QTL posi-tion, and thus determined the line origin of resistance/ susceptibility. For all traits and each QTL, the maximum likelihood ratio test (LRTmax) curves were inspected vis-ually. When the LRTmax curves showed two peaks, the hypothesis of two QTL (H2) versus one QTL (H1) was tested. Because the test was available only for the unitrait model for the time to death, fish that survived were given a time of death at d + 1, with d the day of death of the last fish that died, but it never reached the chromosome-wide significance level.
The percentage of phenotypic variance explained by a QTL in the DH progeny was calculated with the R soft-ware [64], using ANOVA for ENDURANCE and logistic regression for STATUS.
Results
Average performance after immersion and injection infectious challenges
Fish from the QTL family were challenged with F. psy-chrophilum via two modes of infection: after the immer-sion challenge, the overall survival rate was 77% at day 48 (out of 225 infected fish) whereas after the injection challenge, it was 55% at day 34 (out of 147 infected fish)
(Fig. 1). These values were in the range of survival rates recorded in previous challenges with the F. psychrophi-lum strain FRGDSA 1882/11. Regardless of the route of infection, individual body weight at the time of infection had no significant effect on time to death or on the final survival rate (STATUS). Fish that survived and died fol-lowing the immersion protocol had the same mean body weight at the time of challenge (4.6 g). Accordingly, the mean body weight at the time of infection using injection was 20.9 g and 22.6 g (not significant) for surviving and dead fish, respectively (see Additional file 2: Table S2). Genotypes calls and linkage map
The catalogue of polymorphic loci, established with 511 individuals (507 unique F2’s, 2 F1’s and 2 F0’s), contained 17,460 bi-allelic loci of which 2867 were discarded from further analysis since they were putative duplicated loci (i.e. they were heterozygous in at least two DH controls, see list in Additional file 2: Table S1). After removing fish with a genotype call rate lower than 20% (n = 444) and markers with more than 70% missing genotypes (n = 11,570), 24 additional individuals that exhibited a rate of heterozygous loci higher than 1% were removed before the last filtering step based on MAF (> 0.30) and marker call rate (> 90%). The final dataset was composed of 9715 polymorphic loci and 427 F2 progeny (including 310 QTL progeny that were challenged with F. psychro-philum and 117 individuals with no phenotypic record). Of the 9715 markers, 9654 were mapped to 30 linkage groups (see Additional file 2: Table S3). The total length of the linkage map was 2645.2 cM. Linkage groups were successfully assigned to chromosomes using the genome assembly Omyk_1.0 [60]. As previously described [71,
72], chromosome 25 (Omy25) is separated into two
chromosomes in the INRA SY population. In this paper, Omy25a corresponds to the short arm of Omy25 and Omy25b to its long arm. The 9654 markers accounted for 2130 distinct positions on the genetic map (see Addi-tional file 2: Table S4). At each position, only the marker with the best call rate was kept for further QTL detection (see Additional file 2: Table S3). The final dataset for QTL detection included 310 F2 progeny, one F1 and the two F0 individuals, and 2130 markers.
QTL detected following injection challenge
Using the M1 model, survival analysis with the Cox model revealed two genome-wide significant QTL associated with RESISTANCE after the injection chal-lenge (P ≤ 0.005 at the genome-wide level) on Omy3 and Omy29 (named Omy3-QTL and Omy29-QTL, respectively). Two other QTL were chromosome-wide significant (P ≤ 0.01) on Omy10 and Omy26. For all QTL, the risk ratio was less than 1 (0.22–0.38, Table 1),
which indicates that the allele for resistance originated from the AP2 (resistant) grandparent. The final sur-vival rate ranged from 67 to 76% for individuals that were homozygous for the resistance (AP2) allele at all four QTL versus 34 to 50% for individuals that were homozygous for the susceptibility (B57) allele. Omy3-QTL and Omy29-Omy3-QTL had the strongest effects (see Table 1). For STATUS (analysed as a binary trait), one chromosome-wide significant QTL was found on Omy25a and two genome-wide significant QTL on Omy3 and Omy29. These two QTL were the same as those detected for RESISTANCE (same location, same favourable (resistance) allele transmitted by AP2). They explained 14 and 12% of the phenotypic variation of the trait in the DH progeny, respectively, whereas Omy25a-QTL explained 7% of the phenotypic variation. Strik-ingly for this QTL, the susceptible grandparent (B57)
transmitted the favourable allele. Likelihood ratio thresholds and flanking markers at each QTL are in Table S5 (see Additional file 2: Table S5). Figure S3 (see Additional file 4: Figure S3) presents the likelihood ratio profiles for each chromosome (1 cM interval) for the two resistance traits after the two types of infec-tious challenges.
For ENDURANCE, which was measured as time to death (hence, using only fish that died), two chromo-some-wide significant QTL were detected on Omy15 and Omy29. Omy29-QTL explained 11% of the phenotypic variance of the trait in the DH progeny. Omy15-QTL is a new QTL, whereas Omy29-QTL is likely the same as that detected for RESISTANCE (close location, over-lapping 95% confidence intervals, one flanking marker in common). For both QTL, the favourable allele origi-nated from the resistant grandparent (AP2), and fish that Fig. 1 Survival curves after Flavobacterium psychrophilum infection of DH fish used for QTL detection. Kaplan–Meier estimation of survival functions
after infectious challenges for the QTL family. The pink curve corresponds to the hazard function of DH progeny challenged by immersion (225 fish, 3 aquaria, 49 days) and the blue curve corresponds to the Hazard function of DH progeny challenge by intramuscular injection (147 fish, 3 aquaria, 35 days)
carried the favourable allele at both QTL died on average 5 days later than fish with the unfavourable allele.
QTL detected following immersion challenge
For the immersion challenge and with model M1 , sur-vival analysis with the Cox model revealed three QTL associated with RESISTANCE (Table 2). Two new chro-mosome-wide significant QTL located on Omy2 and Omy21, respectively. One genome-wide significant QTL on Omy3 matched the QTL that was detected in the
injection challenge analysis (similar position, i.e. 88 and 89 cM for the immersion and injection challenge analy-ses, respectively, and resistance transmitted by AP2 in both cases). The risk ratios of the two newly detected QTL (3.73 for Omy2-QTL and 3.08 for Omy21-QTL, respectively) indicated that the favourable (resistance) allele originated from the susceptible grandparent (B57). Omy3-QTL had the largest effect, with 94 versus 53% survival for individuals that were homozygous for the AP2 and B57 allele, respectively. For Omy2-QTL and Table 1 Results of QTL analyses for resistance traits after an injection challenge with F. psychrophilum
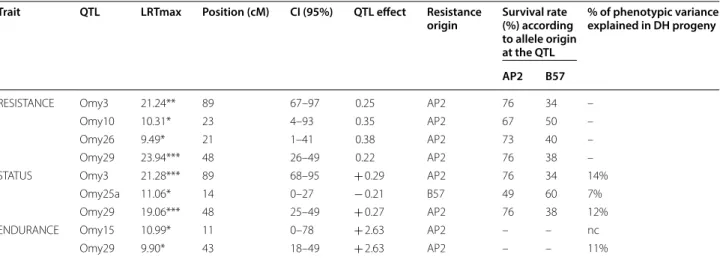
RESISTANCE: overall resistance, analysed with a Cox model survival analysis that takes failure, time to death and final survival (censored observations) into account; STATUS: (dead/surviving) phenotype at the end of the challenge, analysed as a binary trait; ENDURANCE: time to death in days after infection for dead fish only, analysed as a Gaussian trait; LRTmax = maximum of likelihood ratio test; Position in the genetic map in centimorgans (cM); CI = confidence interval; Chromosome-wide significant at *P ≤ 0.01; Genome-Chromosome-wide significant at **P ≤ 0.05 or ***P ≤ 0.01; The QTL effect was measured as the relative risk for RESISTANCE (B57 as the reference, risk = 1), as half the difference between the mean values of the two classes of homozygous progeny (individual values fixed as 1 for survivors and 0 for dead fish) for STATUS and as half the difference (in days) between the mean date of death of the two classes of homozygous progeny for ENDURANCE
Trait QTL LRTmax Position (cM) CI (95%) QTL effect Resistance
origin Survival rate (%) according to allele origin at the QTL
% of phenotypic variance explained in DH progeny
AP2 B57
RESISTANCE Omy3 21.24** 89 67–97 0.25 AP2 76 34 –
Omy10 10.31* 23 4–93 0.35 AP2 67 50 –
Omy26 9.49* 21 1–41 0.38 AP2 73 40 –
Omy29 23.94*** 48 26–49 0.22 AP2 76 38 –
STATUS Omy3 21.28*** 89 68–95 + 0.29 AP2 76 34 14%
Omy25a 11.06* 14 0–27 − 0.21 B57 49 60 7%
Omy29 19.06*** 48 25–49 + 0.27 AP2 76 38 12%
ENDURANCE Omy15 10.99* 11 0–78 + 2.63 AP2 – – nc
Omy29 9.90* 43 18–49 + 2.63 AP2 – – 11%
Table 2 Results of QTL analyses for resistance traits after an immersion challenge with F. psychrophilum
RESISTANCE: overall resistance, analysed with a Cox model survival analysis that takes failure time to death and final survival (censored observations) into account; STATUS: (dead/surviving) phenotype at the end of the challenge, analysed as a binary trait; ENDURANCE: time to death in days after infection for dead fish only, analysed as a Gaussian trait; LRTmax = maximum of likelihood ratio test; Position in the genetic map in centimorgans (cM); CI = confidence interval; Chromosome-wide significant at *P ≤ 0.01; Genome-Chromosome-wide significant at ***P ≤ 0.01; The QTL effect was measured as the relative risk for RESISTANCE (B57 as the reference, risk = 1), as half the difference between the mean values of the two classes of homozygous progeny (individual values fixed as 1 for survivors and 0 for dead fish) for STATUS and as half the difference (in days) between the mean date of death of the two classes of homozygous progeny for ENDURANCE
Trait QTL LRTmax Position (cM) CI (95%) QTL effect Resistance
origin Survival rate (%) according to allele origin at the QTL % phenotypic variance explained in DH progeny AP2 B57 RESISTANCE Omy2 14.04* 14 3–32 3.73 B57 69 89 – Omy3 39.87*** 88 82–93 0.09 AP2 94 53 – Omy21 12.65* 99 64–103 3.08 B57 66 87 – STATUS Omy2 13.17* 14 2–36 − 0.19 B57 69 89 6% Omy3 39.47*** 88 81–93 + 0.33 AP2 94 53 18% Omy21 12.36* 99 63–104 − 0.18 B57 66 87 7% ENDURANCE Omy20 12.54* 28 5–37 + 4.93 B57 – – nc Omy27 13.56* 26 10–47 + 5.65 B57 – – nc
Omy21-QTL, the absolute difference in survival between alternative homozygotes was around 20% (Table 2). The QTL detected for STATUS (binary trait) provided results that are fully consistent with the results obtained for RESISTANCE. Omy3-QTL had the largest effect (explaining 18% of phenotypic variance in DH progeny), whereas Omy2-QTL and Omy21-QTL had the smallest effects (6 and 7% of phenotypic variance in DH progeny, respectively).
For ENDURANCE after the immersion challenge, two new chromosome-wide significant QTL were detected on Omy20 and Omy27. Fish that carried the B57 allele at the two ENDURANCE QTL survived longer (about 10–11 days more) than those that carried the AP2 allele. The immersion or injection challenge had no common QTL associated with ENDURANCE.
Detection of additional QTL based on co‑factor analyses Since QTL may have been masked by the major QTL described above and/or by possible epistatic interac-tions between them, analyses were refined using STA-TUS as the resistance trait. Model M2 was used, in which QTL detection was computed with the effect of
each chromosome-wide and genome-wide significant QTL detected for STATUS with model M1 being fixed as co-factors alternatively. As shown in Table 3, use of model M2 revealed five additional chromosome-wide or genome-wide significant QTL (absolute effects of QTL on survival rates are in Additional file 5: Figure S4).
In the analysis of the injection challenge, includ-ing the effect of Omy3-QTL as co-factor in model M2 allowed identification of an additional QTL on Omy29
(named Omy29.2Omy3-QTL). This Omy29.2Omy3-QTL
was located at 23 cM, just at the limit of the confidence interval of the first QTL on Omy29 detected for
RESIST-ANCE and STATUS with model M1 (see Table 1) for
the injection challenge. The hypothesis that there were two QTL for STATUS was tested by fitting both
Omy3-QTL and Omy29-Omy3-QTL in the model; Omy29.2Omy3-QTL
remained chromosome-wide significant (P < 0.01), which supports the existence of two different QTL on Omy29. Including Omy29-QTL in the model allowed the role of Omy26-QTL to be extended to STATUS (previously chromosome-wide significant for RESISTANCE only). Finally, new QTL were detected on Omy17 by fitting Omy25a-QTL or Omy29-QTL, respectively. Because Table 3 Results of QTL analysis using the model M2 for resistance trait following injection or immersion challenges
The table presents chromosome-wide or genome-wide significant QTL detected for STATUS using model M2 ; Reciprocal interactions could be tested only for QTL detected in the first STATUS analysis (model M1 ); LRTmax = maximum of likelihood ratio test; Position in the genetic map in centimorgans (cM); CI = confidence interval; Chromosome-wide significant = *P ≤ 0.01; Genome-wide significant = **P ≤ 0.05 or ***P ≤ 0.01; P values for fixed effect and interaction corrected with Benjamini–Hochberg method: Non-significant = NS; *P value ≤ 0.05; ***P value ≤ 0.001
a The reciprocal interaction could not be tested as a new QTL (Omy29.2
Omy3-QTL) was detected with the reciprocal model
b,d Reciprocal models for QTL pairs c The QTL in the reciprocal model (Omy2
Omy3-QTL) was only suggestive (P ≤ 0.05) at the chromosome wide level
Infection route QTL LRTmax Position (cM) CI (95%) Increase in survival rate Resistance origin P value
fixed effect
P value
interaction Fixed_R (%) Fixed_S (%) Fixed_R Fixed_S
IMMERSION Omy17Omy3 13.97* 61 0–92 38 7 AP2 AP2 *** NS
Omy25aOmy3 10.41* 4 0–35 10 18 B57 B57 *** NS
Type 1 interaction
INJECTION aOmy3
Omy29 15.27** 89 46–105 16 47 AP2 AP2 *** ***
IMMERSION bOmy2
Omy3 15.35** 97 63–104 4 39 B57 B57 *** ***
bOmy3
Omy21 40.73*** 87 82–93 20 55 AP2 AP2 *** ***
cOmy3
Omy2 35.66*** 87 81–94 17 44 AP2 AP2 *** ***
INJECTION aOmy29.2
Omy3 14.85* 23 8–49 5 48 B57 AP2 *** *
Omy17Omy25a 15.85** 73 53–79 11 53 AP2 B57 *** ***
IMMERSION Omy7.2Omy21 11.48* 7 0–103 5 31 AP2 B57 *** ***
Type 2 interaction
INJECTION dOmy25a
Omy3 25.49*** 14 10–18 53 16 B57 B57 *** *
dOmy3
Omy25a 35.35*** 89 86–92 59 22 AP2 AP2 *** ***
Omy26Omy29 11.75* 18 0–34 30 26 AP2 AP2 *** ***
INJECTION Omy17Omy29 18.29*** 74 58–92 47 11 AP2 B57 *** ***
IMMERSION Omy24Omy2 12.71* 4 0–19 20 1 B57 AP2 *** ***
Type 3 interaction
Omy17Omy25a-QTL and Omy17Omy29-QTL were very
close to each other, they were considered as a single QTL. For the immersion challenge, fitting the effect of the
Omy2-QTL revealed two new QTL (Omy7.1Omy2-QTL
and Omy24Omy2-QTL). Fitting the effect of Omy3-QTL
revealed a new QTL on Omy17 (Omy17Omy3-QTL) and a
QTL on Omy25a (Omy25aOmy3-QTL). Interestingly these
two QTL were detected on the same two chromosomes in the injection challenge analysis. Although their posi-tions in each challenge were distinct, confidence inter-vals overlapped largely. Hence, we favour the hypothesis of a single QTL on each of these chromosomes. Taken together, these results support the idea that the functions encoded by the genes represented by the QTL on Omy17 and Omy25a could play a role in resistance regardless of the route of infection. Finally, fitting Omy21-QTL
revealed another QTL on Omy7 (Omy7.2Omy21-QTL).
This QTL was considered as distinct from Omy7.1Omy2
-QTL since it was located far away (7 vs. 61 cM) and out-side its confidence interval.
Evidence for interactions between resistance‑associated QTL
Most of the newly detected QTL defined above were detected only after the interactions between QTL were taken into account in the analysis with model M2 . As shown in Table 3, interactions were suggestive (P ≤ 0.05) for two pairs of QTL and highly significant (P ≤ 0.001) for 11 other pairs of QTL. Since both grandparents (AP2 and B57) can transmit the allele for resistance depending on the QTL, the resistance/susceptibility alleles at QTL will be referred to as the R/S allele for the discussion of inter-actions between QTL, irrespective of their AP2 or B57 origin. The detected interactions could be classified into two main types and a third type that contained only one pair of epistatic QTL, as described in the following.
Type1 interaction: interacting QTL alternatively contribute to resistance
The first type of interaction, which was recorded for six pairs of QTL, was associated with a larger effect of one QTL when the other QTL was fixed at the S allele (see Table 3 for details). For these six pairs of epistatic QTL, the survival rate was significantly lower when both QTL carried the S allele than when at least one QTL carried the R allele (see Additional file 5: Figure S4). Therefore, each QTL alternatively contributes to resistance, depend-ing on the allelic status at the other QTL. A typical case for such interaction is the Omy21_Omy3 QTL pair in the immersion challenge. Indeed, when one QTL was fixed at the S allele and the other QTL changed from S to R, the survival rate increased by 39 and 55%, respectively for Omy21Omy3_S-QTL and Omy3Omy21_S-QTL. In contrast,
when one QTL was fixed at R allele, changing the allele of the other QTL from S to R resulted in an increase in survival of only of 4 and 20%, respectively. An intriguing feature was that for three epistatic QTL, Omy29.2Omy3
-QTL and Omy17Omy25a-QTL in the injection challenge
and Omy7.2Omy21-QTL in the immersion challenge, the
origin of the favourable allele changed depending on the allele fixed for the QTL used as co-factor. For instance, origin of the favourable allele at Omy7.2Omy21-QTL
was AP2 or B57, depending on the allele at the QTL on Omy21 (R or S).
Type 2 interaction: resistance at one QTL enhances the effect of the other QTL
The second type of interaction, detected for four pairs of QTL, resulted in a larger increase in survival rate when one of the two QTL was fixed at the R allele (see Table 3 for details). This interaction can be illustrated by the sig-nificantly greater survival rate when both QTL of a pair carried the R allele compared to any other combination of alleles (see Additional file 5: Figure S4).
The Omy3_Omy25a QTL pair in the injection chal-lenge is an example of such an interaction, with an abso-lute increase in survival rate by 53 and 59%, respectively,
when Omy25aOmy3_R-QTL and Omy3Omy25a_R-QTL
changed from S to R. For Omy17Omy29-QTL in the
injec-tion challenge and Omy24Omy2-QTL in the immersion
challenge, the large increase in survival rate was com-bined with an inversion of the origin of the favourable allele at the QTL when the QTL fitted in the model M2 carried the R versus the S allele.
Type 3 interaction: inversion of origin of the favourable allele
In the immersion challenge, the absolute effect of
Omy7.1Omy2-QTL on survival did not depend on the
allele at Omy2-QTL (+ 19%) but the origin of the favour-able allele changed from B57 to AP2 depending on the R/S allele at Omy2-QTL.
Key immune genes induced by F. psychrophilum infection co‑located with resistance‑associated QTL
In a previous study [46], we analysed the transcriptome response to F. psychrophilum in the pronephros of two trout isogenic lines (B57 and A3) with contrasting sus-ceptibilities to F. psychrophilum, using micro-arrays. A list of 571 differentially-expressed genes after F. psychro-philum injection in at least one of these lines was gener-ated ([46] and supplementary material in [73, 74]). All probes corresponding to these genes were mapped on the rainbow trout genome [60], to test whether the differen-tially-expressed genes are located close to a QTL. Probe positions were compared to the rainbow trout annota-tion [75] to name the corresponding proteins. Sixty-four
probes (corresponding to 49 genes) were located within or close to the 95% confidence intervals of the QTL detected in the current study (see Additional file 2: Tables S5 and S6). Among these 49 genes, 14 had functions that suggest that they may be involved in the resistance con-trolled by the respective QTL. These genes can be classi-fied into four functional categories: (1) bacterial sensors and damage associated molecular pattern (DAMP) mol-ecules (cd209 and other c-type Lectin-4, tlr2; and hmgb3); (2) inflammatory factors (steap4; il1r2; and drtp1); (3) effectors killing bacteria (c3; hamp) or affecting the host (collagenase/mmp13); and (4) interferon stimulated genes (ISG) (vig2, ifi44, and ifitm). A detailed description of these genes and their function is in Additional file 6.
Discussion
In this study, we investigated the genetic architecture of resistance to Flavobacterium psychrophilum in rainbow trout using a cross between two isogenic grandparental lines with contrasting susceptibilities to the bacterium. Two different infection modes, immersion and injection were used to detect QTL that were in segregation in the two grandparent isogenic lines. Although injection is commonly used in protocols of experimental infection with F psychrophilum, immersion is more relevant since it likely mimics the natural infection more closely. How-ever, reliable and reproducible immersion challenges are more difficult to establish than injection challenges, espe-cially if a large number of fish are to be infected. Using
a DH QTL family produced from isogenic lines with well-established susceptibility was a unique way to facili-tate the genetic analysis. Interestingly, QTL detected in both infection models overlapped partly, which supports the hypothesis that a core set of immune mechanisms is recruited, while others can be specific to the infec-tion route. This study also provides the first evidence of epistasis among QTL associated with resistance to F. psy-chrophilum. Finally, we also investigated endurance of the fish (i.e., time to death after infection) and detected four QTL associated with this trait. It should be noted that only one endurance QTL was also defined as a resistance QTL (Omy29-QTL), which indicates that these two traits are partly driven by different mechanisms.
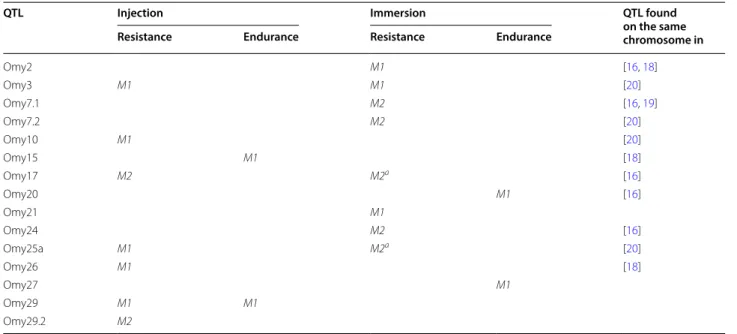
Altogether, we detected 12 QTL associated with resist-ance to F. psychrophilum (see Table 4 for a summary). Three QTL were common to both routes of infection (Omy3-QTL, Omy17-QTL and Omy25a-QTL), four were detected after injection only (Omy10-QTL, Omy26-QTL, Omy29-QTL and Omy29.2-QTL) and five after immer-sion only (Omy2-QTL, Omy7.1-QTL, Omy7.2-QTL, Omy21-QTL and Omy24-QTL). Three of these QTL (Omy21-QTL, Omy29-QTL and Omy29.2-QTL) had not been detected in previously published studies [16, 18, 19, 49]. Some QTL could be detected only after tak-ing the effect of—or the interaction with—another QTL with strong effect into account. Among the QTL that govern resistance for both types of challenge, Omy3-QTL was the most significant and explained 14 and 18% of the
Table 4 Summary of all QTL associated with resistance and endurance
In this table, the term “Resistance” combines the QTL detected for STATUS and/or RESISTANCE traits
M1: QTL detected using the M1 model, M2: QTL detected using the M2 model with fixed effect and interactions, M2a interaction non-significant or suggestive (5%)
QTL Injection Immersion QTL found
on the same chromosome in
Resistance Endurance Resistance Endurance
Omy2 M1 [16, 18] Omy3 M1 M1 [20] Omy7.1 M2 [16, 19] Omy7.2 M2 [20] Omy10 M1 [20] Omy15 M1 [18] Omy17 M2 M2a [16] Omy20 M1 [16] Omy21 M1 Omy24 M2 [16] Omy25a M1 M2a [20] Omy26 M1 [18] Omy27 M1 Omy29 M1 M1 Omy29.2 M2
phenotypic variation in survival rate of the DH progeny following injection and immersion, respectively.
We identified several QTL that seem specific to a given route of infection. One cannot exclude that these QTL contribute to resistance regardless of the mode of infec-tion but that they were not detected in one challenge because of lack of power of the experiment. However, the observation of QTL specific to the route of infec-tion is consistent with our unpublished results, that show a moderate genetic correlation between the survival of standard trout families after immersion or injection challenge. The five QTL that were detected only after immersion could drive protective mechanisms that are related to entry of the bacterium into the host at the skin or mucosa level, or mechanisms that would be triggered significantly only when the bacterium has entered the host after an immersion challenge. For example, resident phagocytes that are located close to the « natural » entry sites could mediate such mechanisms. These cells can sense the pathogens, become activated, mediate a local innate response and/or migrate to the spleen or to other sites where the immune responses take place. In contrast, QTL detected only after injection could correspond to resistance mechanisms that become more critical when the first line of natural defence has been by-passed.
Age of the fish at the time of immersion and injection challenges may also have influenced the relative effect of the QTL. Because the F. psychrophilum strain used is highly virulent, it can induce very high mortality rates when injected to small fish even at low doses, which may prevent detection of QTL. Hence, we chose to carry out the injection challenge on 8-month-old fish, while the immersion challenge was performed on younger fish (5-month-old, to better simulate the natural infec-tion at early stages), having a potentially more immature immune system. Importantly, 5-month-old fish already have a rather mature immune system. For example, they already have B and T lymphocytes, and can mount adap-tive immune responses [76]. The same study showed that a strong transcriptional response to bacterial infection can be detected since the eyed egg stage. While drastic changes of this response were observed before the first feeding stage, fewer changes occur from first feeding and 3 weeks later. Thus, age-dependent changes in immune response that take place in trout after several months of independent feeding life correspond to maturation of an established immune system, rather than to a dra-matic change, and we do not expect drastic differences in immune responses for 5- versus 8-month-old fish. More-over, our experience with isogenic lines indicates that lines that are highly susceptible to F. psychrophilum infec-tion remain susceptible during their first year of life and often throughout life (unpublished). Along the same line,
the general conclusion of comparisons of susceptible ver-sus resistant lines across a range of sizes is that lines rank consistently regarding susceptibility to F. psychrophilum ([46] and unpublished results), supporting the hypothesis that maturation of the immune system does not lead to drastic changes in the susceptibility/resistance status of the fish in this study. However, some pathways that are critical at young stages may become less critical as adap-tive defence mechanisms get more effecadap-tive at later ages.
To get further insight into the mechanisms involved in host response, we combined the positional information obtained from QTL mapping with results of our previ-ous functional study. This pointed to several key genes involved in antibacterial immunity, which are induced in the pronephros of fish injected with F. psychrophilum, and are located in the vicinity of the resistance QTL. These genes are potentially interesting for the validation of a repertoire of candidate genes in more restricted QTL regions.
Few studies have addressed interactions between QTL, although it has been shown that epistasis may play an important role in the genetic variation of complex traits [42, 77] and that taking epistasis into account allows more QTL to be detected [42, 78, 79]. In the current study, five of 15 QTL were detected only after epistasis was taken into account, which provides further insights into the genetic architecture of resistance to F. psychrophilum and the complexity of the underlying mechanisms.
Two major types of interactions were identified. In the first type, the effect of each QTL was present or enhanced only when the other QTL was fixed at the susceptibility allele. Consequently, each QTL alterna-tively contributes to the resistance (“compensation-like” effect). This phenomenon occurred between the three most significant immersion QTL and between two of the most significant QTL that were identified following injection. In particular, “compensation-like” interaction was detected between Omy2-QTL and Omy3-QTL that carry candidate genes coding for anti (steap4) and pro (il1r2) inflammatory factors. The second type of interac-tion results in an “enhancing-like” effect of the resistance allele of one QTL on the effect of other QTL, resulting in a gain in resistance only when both QTL carry their resistance allele. Therefore, mechanisms associated with the R alleles at the two QTL may be synergetic or, alter-natively, the presence of the S allele at one QTL may hin-der the efficiency of the resistance mechanisms encoded at the other. This interaction was detected between Omy29-QTL and two other QTL (Omy26-QTL and Omy17-QTL). In other cases, as for the Omy2_Omy7.1 pair of QTL or in some cases among type 1 and 2 inter-actions, there was what may be called a “counter-acting interaction” with an inversion of the favourable allele
at one QTL when switching the allele at the alternative QTL. Such a type of interaction was described in stud-ies on lung [80] or colon [81] cancer in recombinant con-genic strains of mouse for which QTL were expected to be important components of tumour susceptibility. Fur-ther investigations are needed in order to better under-stand the underlying immune pathways, which might correspond to negative feedback loops.
Several QTL associated with resistance to F. psychro-philum had a strong effect on resistance in the QTL fam-ily used in this study. Among those, the QTL on Omy3 is of particular interest because it controls resistance fol-lowing both routes of infection. This QTL has also been detected in two American trout populations [20] and might be relevant in other populations. Our study also confirms the role of several other QTL that were previ-ously detected in American trout populations in response to infection with a different strain of F. psychrophilum (CSF-259-93) [16, 18–20]. Hence, these QTL are not specific to a particular strain of F. psychrophilum nor to a particular host population, which strengthens their potential interest for breeding purposes. It is noteworthy that the FRGDSA 1882/11 and CSF-259-93 strains both belong to the same mPCR type 2, which is one of the major types identified in F. psychrophilum isolates from worldwide origins [50, 82].
Our results also suggested that a given type of infec-tion challenge (route of infecinfec-tion and/or age of fish) may select for specific resistance mechanisms that may not be as relevant in other contexts. The challenge model used to select candidates may result in gene-environment interactions with less genetic progress than expected in the context of natural infection in farms. However, choosing the ‘best’ infection challenge for a selection programme should take into account not only genetic, but also practical and economic issues. From a practical point of view, an encouraging result of this study is that, within the range of fish size we investigated, individual body weight at the time of challenge had no or little effect on resistance, meaning that individual tagging to record fish weight may not be necessary when implementing an infection challenge.
Conclusions
In this paper, we confirmed the complex genetic deter-minism of resistance to Flavobacterium psychrophilum in rainbow trout. Some QTL that drive a significant part of the phenotypic variance in different infectious contexts were detected and deserve further confirmation in stand-ard trout families. Several genes involved in response to F. psychrophilum infection were associated with the detected QTL, providing a preliminary list of relevant candidate genes. Finally, this study highlighted the role of
epistatic interactions between resistance QTL (and thus between the underlying mechanisms) and for the first time, evidenced the effect of the type of infection proto-col with F. psychrophilum on the balance between differ-ent resistance mechanisms.
Additional files
Additional file 1: Figure S1. Cumulative survival curves of fish from AP2 and B57 grandparental isogenic lines infected with Flavobacterium
psychrophilum. Description: Fish were infected with the F. psychrophilum
FRGDSA 1882/11 strain and mortality was recorded for 29 days post‑ infection. For injection protocol (—), 100 fish (average weight of 10.3 g for AP2 and 12.2 g for B57) were infected with (a): 450 CFU/mL (replicate of 50 fish) or (b): 300–550 CFU/mL (replicate of 50 fish). For the immersion protocol (‑ ‑ ‑ ‑ ‑), 100 fish (average weight of 1.1 g for AP2 fish and 1.0 g for B57 fish) were infected by immersion for 4 h in a bacterial suspension (approximately 3.107 CFU/mL) in static water maintained at 10 °C with
vigorous aeration, in two replicates of 50 fish each (a) and (b).
Additional file 2: Table S1. List of putative duplicated loci: heterozygous RAD SNPs detected in at least two doubled haploid control individuals (DH controls), each from different rainbow trout isogenic lines. Table S2. Overall survival and weight of fish of the QTL family at the end of the immersion and injection infectious challenges. Description: Data were recorded for 49 and 35 days for the immersion and injection challenges, respectively. Table S3. Genetic linkage map constructed with the F2 prog‑ eny. Description: The marker at one position used in the QTL detection is shown in red bold. Tables S4. SNP allele and position for the 2130 markers used in the QTL detection. Description: SNP position is given in bp from the first bp of the read. Table S5. All significant (P ≤ 0.01 at the chromo‑ some wide level) detected QTL, error‑I rejection threshold at chromosome and genome‑wide levels calculated for each QTL, flanking markers at each QTL, with name and position on the linkage map (cM). Table S6. List of 49 up‑ and down‑ regulated genes after F. psychrophilum infection in two rainbow trout isogenic lines in [46] located in the QTL associated with resistance traits identified in this study. Table S7. Reads of the 9654 polymorphic loci used in the linkage map and QTL detection.
Additional file 3: Figure S2. Evolution of the rate of hererozygosity along chromosomes (mean values for the 24 individuals with an overall rate of heterozygosity higher than 1%). Description: Metacentric chromosomes (a): under the hypothesis of spontaneous retention of the second polar body during meiosis, the rate of heterozygosity is expected to be lower around the centromere (—) than in telomeric regions (‑ ‑ ‑ ‑). Acrocentric chromosomes (b): under the hypothesis of spontaneous retention of the second polar body during meiosis, the rate of heterozygosity is expected to increase along the chromosome from the centromeric region to the telomere. Data are illustrated for 15 chromosomes.
Additional file 4: Figure S3. Graphical compilation of likelihood ratio profiles calculated for each chromosome (1‑cM interval) for the two resist‑ ance traits after the two modes of infection challenges. Description: (a) RESISTANCE and (b) STATUS after injection challenge, (c) RESISTANCE and (d) STATUS after immersion challenge. For each chromosome, horizontal bars indicate the corresponding significance thresholds (green: P ≤ 0.01 at the chromosome‑wide level; red: P ≤ 0.05 at the genome‑wide level).
Additional file 5: Figure S4. Final survival rate according to the allele origin at pairs of epistatic QTL for resistance to infection with F.
psychrophi-lum. Description: For each figure, abscissa corresponds to the combina‑
tion of favourable (R) and unfavourable (S) alleles with the grandparent origin in colour (green for B57 and red for AP2) for each pair of epistatic QTL OmyA_OmyB. Survival rates (in ordinate) with similar letters are not significantly different (Fisher exact test P ≤ 0.05 and Benjamini–Hochberg correction for multiple testing of stat package from R software).
Additional file 6. Details on the immune genes induced by F.