HAL Id: pastel-00945367
https://pastel.archives-ouvertes.fr/pastel-00945367
Submitted on 12 Feb 2014
HAL is a multi-disciplinary open access archive for the deposit and dissemination of sci-entific research documents, whether they are pub-lished or not. The documents may come from teaching and research institutions in France or abroad, or from public or private research centers.
L’archive ouverte pluridisciplinaire HAL, est destinée au dépôt et à la diffusion de documents scientifiques de niveau recherche, publiés ou non, émanant des établissements d’enseignement et de recherche français ou étrangers, des laboratoires publics ou privés.
Etude expérimentale et numérique de la rupture ductile
sous chargement multiaxial
Jessica Papasidero
To cite this version:
Jessica Papasidero. Etude expérimentale et numérique de la rupture ductile sous chargement multi-axial. Mécanique [physics.med-ph]. Ecole Polytechnique X, 2014. Français. �pastel-00945367�
Manuscrit présenté par
Jessica PAPASIDERO
pour l’obtention du grade de
Docteur de l’École Polytechnique
Spécialité : MÉCANIQUE
Laboratoire de Mécanique des Solides Ecole Polytechnique
91120 Palaiseau, France
Étude expérimentale et numérique de la
rupture ductile sous chargement multiaxial
Soutenue le 16 janvier 2014 devant le jury composé de :
Tudor BALAN
Examinateur
Ahmed BENALLAL
Rapporteur
Jacques BESSON
Examinateur
Pierre-Olivier BOUCHARD
Examinateur
Véronique DOQUET
Co-directrice de thèse
André DRAGON
Rapporteur
Abstract
A stocky tubular tension-torsion specimen geometry was optimized to characterize the effect of the stress state (stress triaxiality and Lode angle parameter) on metals ductility, at low stress triaxialities. Biaxial tests (proportional and non-proportional) were performed on 36NiCrMo16 steel and 2024-T351 aluminum alloy. Strain fields were measured by stereo-correlation of digital images during the tests. Loading paths to fracture (evolution of the equivalent plastic strain, the stress triaxiality and the Lode angle parameter at the critical point) were determined. The evolution of aluminum ductility with respect to the stress triaxiality measured from tension-torsion tests differed substantially from that obtained by Bao and Wierzbicki in 2004. Indeed, the latter suggested a minimal ductility under shear, while the tension-torsion technique revealed a maximal ductility under shear. Non-proportional loading paths were shown to have an influence on ductility, by means of tests consisting in a pre-compression, pre-tension or pre-torsion, followed by a proportional loading sequence under combined tension-torsion. SEM observations of metallographic sections from biaxial interrupted tests, a real-time monitoring of the surface strain and damage during in-situ torsion tests in the SEM, and a crack propagation test coupled with in-situ X-ray synchrotron laminography brought evidences of localization phenomena at different scales, and of the growth of some cavities, even under pure shear, by contrast with the total collapse predicted by unit cell models. This growth may be due to the significant axial elongation measured under pure torsion (Swift effect). Shear localization was identified as the main coalescence mechanism, which justifies the choice of the Hosford-Coulomb fracture initiation criterion. Used in conjunction with a non-linear damage indicator, it accounts for the measured ductilities, even under possibly non-proportional loadings.
Acknowledgements
Je remercie le Laboratoire de Mécanique des Solides de m’avoir accueillie dans ses locaux.
Je tiens à exprimer ma gratitude envers mes directeurs de thèse, Véronique Doquet et Dirk Mohr, qui m’ont encadrée et guidée tout au long de ces trois années de doctorat.
Je remercie mes rapporteurs MM Benallal et Dragon, ainsi que MM Balan, Besson et Bouchard d’avoir accepté d’évaluer ce travail.
Je souhaite ensuite remercier Vincent De Greef et Erik Guimbretière, qui m’ont beaucoup appris et aidée dans l’utilisation des machines d’essais et la réalisation des montages. Un très grand merci également à Daniel Caldemaison qui m’a fait faire mes premiers pas avec le MEB, et à Alexandre Tanguy qui a partagé avec moi son savoir et son expérience en microscopie et en préparation métallographique.
Une mention spéciale pour Sébastien Lepeer, mon stagiaire, qui, par sa motivation, son efficacité, et son travail méticuleux, a largement contribué à certains résultats présentés dans le chapitre III de cette thèse. Merci, et bravo, Sébastien !
Je tiens également à remercier très chaleureusement Thilo Morgeneyer, chargé de recherche au Centre des Matériaux, qui m’a accueillie au sein de son équipe et m’a offert l’opportunité de réaliser des essais à l’ESRF de Grenoble, au cours des derniers mois de ma thèse.
J’en viens maintenant aux personnes avec qui je n’ai pas travaillé, mais dont la présence a grandement contribué à la bonne ambiance et qualité de vie nécessaires à la réalisation d’un travail dans les meilleures conditions. Merci aux doctorants et post-doctorants du LMS qui ont partagé mon quotidien. Merci à Camille, Fabien, Gauthier qui ont été parmi les premiers « jeunes » du laboratoire dont j’ai croisé le chemin ; à mes chers co-bureau JB, puis Chus ; à mon voisin de bureau Clément ; à Armel dont les anecdotes et la culture ne cessent de m’impressionner ; à Barbara et Aurélie ; à Matthieu et Mathieu, Christian, Gongyao, Borja, David, Dennis ; bien sûr, à nos dignes représentants, Dimitri et Gwen. Merci aussi à l’ensemble du secrétariat du LMS : Alexandra, Anna, Christiane, Valérie, Danielle, dont le
travail fantastique transforme les formalités administratives les plus fastidieuses en une promenade.
Merci à mes amis musiciens Laurent, Pierre et Alexandra, pour nos répétitions qui ont rythmé une grande partie de cette période.
Merci à mes amis Anne, Chloé et Charles.
Un grand merci à ma famille, à mes parents. Vingt-cinq ans après s’être assise sur son premier banc d’école, votre fille a enfin terminé ses études !
Table of Content
Introduction ... 13
1. Stress state definition ... 15
2. Macroscopic aspects of ductile fracture ... 18
3. Microscopic aspects of ductile fracture ... 22
4. Modeling of ductile damage ... 26
5. Goal of the study ... 32
I.
Determination of the Effect of Stress State on the Onset of Ductile Fracture
through Tension-Torsion Experiments ... 35
1. Specimen design ... 39
1.1. Specimen geometry ... 39
1.2. Analytical estimate of the achievable stress states ... 41
2. Experiments ... 42
2.1. Material ... 42
2.2. Experimental procedure ... 43
2.3. Displacement and strain measurement ... 45
2.4. Average Cauchy stress estimates ... 46
2.5. Experimental results ... 47
2.5.1. Overview ... 47
2.5.2. Surface strain fields and localization ... 48
3. Finite element analysis ... 50
3.1. Finite element model ... 51
3.2. Constitutive equations ... 52
3.3. Identification of the plasticity model parameters ... 53
4. Determination of the loading paths to fracture ... 54
4.1. Method I: Surface-strain based estimates ... 54
4.2. Method II: full FEA analysis ... 56
5. Fracture modeling ... 57
5.1. Hosford-Coulomb (HC) fracture initiation model ... 58
5.2. Fracture model parameter identification ... 59
6. Conclusions ... 60
II.
Bao-Wierzbicki revisited: Ductile Fracture of Al2024-T351 under
Proportional and Non-proportional Loading ... 63
1. Experiments ... 67
1.1. Material and specimen ... 67
1.2. Experimental procedure ... 67
1.3. Measured force-displacement curves ... 67
2. Hybrid experimental-numerical results ... 70
2.1. Finite element model ... 71
2.2. Identification of the plasticity model parameters ... 72
2.3. Location of onset of fracture ... 73
2.4. Loading paths to fracture ... 74
3. Hosford-Coulomb fracture initiation model ... 79
3.1. Effect of stress state ... 80
3.2. Modeling of the effect of loading path ... 81
3.2.1. Linear damage accumulation law ... 81
3.2.2. Non-linear damage accumulation law ... 83
3.3. Model calibration... 84
3.4. Model validation ... 84
4. Discussion ... 85
5. Conclusions ... 88
III.
Ductile damage mechanisms and strain localization in 2024-T351
aluminum alloy and 36NiCrMo16 steel at low stress triaxiality ... 91
1. Materials ... 95
1.1. Material #1: aluminum 2024-T351 (square bar stock, nearly isotropic) ... 95
1.2. Material #2: aluminum 2024-T351 (round bar stock, strongly anisotropic) ... 96
1.3. Material #3: 36NiCrMo16 steel (round bar stock, nearly isotropic) ... 97
2. Experimental procedures ... 98
2.1. 2024-T351 aluminum alloys (alu-1 and alu-2) ... 98
2.1.1. Combined tension and torsion notched tubular specimens (alu-1) ... 98
2.1.2. In-situ torsion test (alu-2) ... 99
2.2. 36NiCrMo16 steel ... 100
2.3. Post-processing ... 100
2.3.1. Combined tension and torsion tests on notched tubular specimens ... 100
2.3.2. In-situ torsion experiments ... 101
3. Experimental observations ... 102
3.1. Aluminum 2024-T351 (materials #1 and #2) ... 102
3.1.2. Strain localization ... 104
3.1.2.1. Suface strain measurements ... 104
3.1.2.2. At the grain scale ... 105
3.1.2.3. Subgrain localization ... 106
3.1.3. Damage ... 108
3.1.3.1. Fracture surfaces ... 108
3.1.3.2. Micrographs from interrupted tension-torsion tests on notched tubular specimens (alu-1) ... 108
3.1.3.3. In-situ torsion test (alu-2) ... 113
3.2. Experimental observations for steel (material #3) ... 114
3.2.1. Macroscopic Overview ... 114
3.2.2. Strain localization ... 115
3.2.3. Damage ... 116
3.2.3.1. Fracture surfaces ... 116
3.2.3.2. Micrographs from fracture tests on tension-torsion notched tubular specimens .... 116
3.2.3.3. In-situ torsion test ... 117
4. Discussion ... 118
4.1. Void evolution ... 118
4.2. Void interaction. ... 119
5. Conclusion ... 120
IV.
Crack initiation and propagation in aluminum 2024-T351 via in-situ
synchrotron radiation computed laminography ... 123
1. Material ... 125 2. Experimental procedure ... 126 2.1. In-situ test ... 126 2.2. Experiment post-processing ... 127 3. Results ... 128 3.1. Qualitative analysis ... 128 3.2. Quantitative analysis ... 132 4. Conclusion ... 135
Conclusions and Perspectives ... 137
References ... 143
15
The interest on ductile fracture can be explained by several factors: necessity of mastering metal forming processes, understanding and improving materials and structures limitations in systems submitted to complex stress states and in which safety is of paramount importance (aeronautics, automotive industry, railways, nuclear power generation, civil engineering…). This subject has drawn attention for several decades. A recent renewal of this interest was associated with the production of nano-structured metals by severe plastic deformation. Though a lot has been achieved in understanding and modelling ductile fracture, the need for more accurate insight in damage mechanisms and predictive fracture models is still very high.
Without pretention to exhaustivity – as the work undertaken in this topic is extremely large – this section proposes a synthetic overview of major contributions on ductile fracture. First, the parameters used to describe a stress state will be defined, as researchers are most interested in their influence on failure. Then, elements from the literature concerning the macroscopic, microscopic and modelling aspects of ductile fracture will be presented.
1. Stress state definition
The stress state at a point P corresponding to a stress tensor σ is illustrated in Fig. 0-1. It consists in a hydrostatic component (OO’) and a deviatoric component (O’P), and can be represented in the principal stress space by its ordered principal stresses
{
σ1,σ2,σ3}
, with3 2 1 σ σ
σ ≥ ≥ . It can also be defined in a unique way by its three invariantsI1, J2 and J3:
( )
σσσσ tr I1= (0.1)( )
2 2 2 1 ssss tr J = (0.2)( )
3 3 3 1 ssss tr J = (0.3)where s is the deviatoric stress tensor. I1 is related to the mean stress σm by :
1 3 1 I m = σ (0.4)
while J2 is related to the Mises equivalent stress σ by:
2
3 J
=
Introduction
16
The stress state P (Fig. 0-1) is often conveniently expressed in the Haigh-Westergaard cylindrical coordinate frame
{
ξ,ρ,θ}
. In this frame, ξ is the magnitude of the hydrostatic component ξ=(
σm,σm,σm)
, and ρ is the magnitude of the deviatoric stress s=(
s1,s2,s3)
. Therefore: 1 3 1 3 m = I = σ ξ (0.1) 2 2 J = ρ (0.2)The angle
θ
, measured from the s1 axis in the Π-plane -which is also the projection of σ1on this plane-, is known as the Lode angle. Its expression depends on the second and third invariant. If one considers the units vector
− − = 6 1 , 6 1 , 3 2 e colinear to s1,
θ
can be expressed as:( )
θ ρcos .e = s (0.3) i.e.:( )
2 1 2 3 cos J s = θ (0.4) Besides:( )
3θ 4cos( )
θ 3cos( )
θ cos = 3 − (0.5)Combining (0.4) and (0.5) yields:
( )
32 2 3 3 2 3 3 ) det( 2 27 3 cos J J = = σ θ s (0.6)The Lode angle
θ
ranges from 0 to π/3. The relationship between the principal stresses and the Haigh-Westergaard coordinates is:( )
+ − + = 3 2 cos 3 2 cos cos 3 2 3 1 3 2 1 π θ π θ θ ρ ξ ξ ξ σ σ σ (0.7)A dimensional analysis shows that the stress state can be characterized by two independent non-dimensional parameters. It is very frequent, in ductile fracture studies, to use the stress triaxiality ratioη , and the Lode angle parameter θ , defined as:
17 σ σ η m J I = = 2 1 3 3 (0.8) θ π θ =1− 6 (0.9)
The stress triaxiality η is the ratio between the hydrostatic stress and the von Mises equivalent stress. The Lode angle parameter θ ranges from -1 to 1. Sometimes, another definition of the Lode parameter,µ, is used (Lode, [1]):
(
)
( )
θ σ σ σ σ σ µ 2 3tan 3 1 3 1 2 = − − − = (0.10)Fig. 0-1 Graphical representation of the stress state
It is difficult to design an experiment in which η and θ are perfectly controlled and uncoupled. Indeed, for that to happen, a truly triaxial test would be necessary. One could imagine pulling a thick cube in three directions orthogonal to each face, but then, measurements on the specimen would be very tricky.
In practice, in most cases encountered in industrial contexts, metal sheets are used, so that plane stress states are predominant. In this case, only two principal stress values are non-zero, meaning that only one non-dimensional parameter can describe the stress state. Therefore, the stress triaxiality and the Lode angle parameter are not independent and are related in the following way: − − − = 3 1 2 27 cos 2 1 η η2 π θ a (0.11)
Introduction
18
Fig. 0-2 shows the graphical relationship between η and θ in plane stress conditions for a range of stress triaxiality from uniaxial compression to equibiaxial tension.
Fig. 0-2 Relationship between the stress triaxiality ratio and the Lode angle parameter in plane stress conditions.
2. Macroscopic aspects of ductile fracture
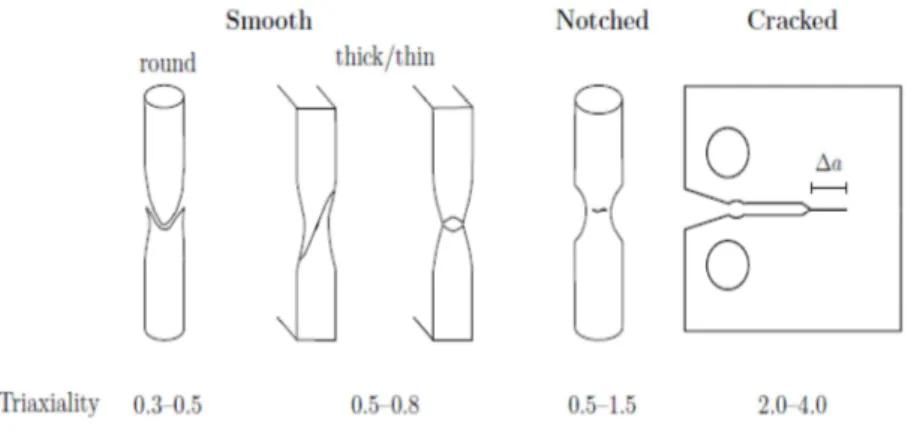
The influence of the stress state on ductility has been extensively documented. Tests have been performed on a variety of specimens allowing a wide range of stress triaxialities to be obtained. Among commonly used specimens are smooth and notched axisymmetric or plane strain specimens, and cracked specimens (Fig. 0-3).
Fig. 0-3 Common specimens geometry (Benzerga and Leblond, [2])
Tests performed by Hancock and Mackenzie [3] on tensile notched steel specimens revealed a strong effect of the stress triaxiality on ductility, which decreases when the stress triaxiality increases. They used the results of Bridgman’s analysis [4] to find a relationship
19
between the stress triaxiality and the fracture strain. Bridgman assumed a constant equivalent plastic strain across the minimum cross section:
= o f r r ln 2
ε
(0.12)but a non-constant stress state, resulting in a stress triaxiality maximal on the specimen axis :
+ + = 1 2 ln 3 1 R r η (0.13)
Many further investigations have been performed. Most of them have confirmed the trend exhibited by Hancock and Mackenzie [3] for high levels of triaxialities. However, difficulties intrinsic to fracture tests and the need for more accurate failure prediction capability and improvements in the experimental and numerical fields have encouraged researchers to develop new techniques. For instance, Bridgman assumed a heterogeneous stress field in the gage section, but it is also the case for the strain field which, most of the time, is maximal in the bulk of the specimen. But most tests realized in the past (and some today) are monitored using extensometers or gauges, which only give an average information on the strain level on the surface of the gage section. To address these issues, several improvements have been brought on specimen geometries, experimental setups (multiaxial devices, full-field measurements) and post-processing.
Subsequently, hybrid experimental and numerical studies have become more and more frequent. This approach consists in performing a finite element analysis of the test yielding the strain and stress field in the bulk of the specimen. The onset of fracture is determined with the experiment (load peak, load drop, first crack visible during the test…). At the corresponding increment in the simulation, the point with maximal equivalent plastic strain is defined as the location of fracture and the local strain as the fracture strain ε f . Bao and Wierzbicki [5] have used this approach to investigate ductility of aluminum 2024-T351. They conducted a series of tests on several specimen geometries which allowed to explore a wide range of stress triaxialities, from -1/3 to 1. For negative stress triaxialities, they used upsetting specimens (Fig. 0-4a). For stress triaxialities from 0 to 0.4, they used butterfly specimens pulled through two pins in order to induce combined tension and shear in the gage section which featured various orientations with respect to the loading direction (Fig. 0-4b and c), and also central hole specimens for uniaxial tension (Fig. 0-4d). For stress triaxialities from 0.33 to 0.95, they used notched axisymmetric specimens with various radiuses (Fig. 0.4e). A few
Introduction
20
years later, Barsoum and Faleskog [6] investigated ductile fracture of a mid-strength steel (Weldox 420) and a high-strength steel (Weldox 960), using a hybrid experimental and numerical analysis as well. To avoid misinterpretations due to the multiplication of specimen geometries, they designed a tubular specimen, featuring an external and internal circumferential notch, proportionally loaded under combined tension and torsion (Fig. 0-5). Different stress states were obtained by varying the proportions of tension and torsion. Fracture locuses obtained in both studies in the space of the equivalent plastic strain and the stress triaxiality are shown in Fig. 0-6a and Fig. 0-7a. For high values of triaxiality (higher than 0.4 for aluminum 2024-T351 and 0.8 for Weldow 420), the authors found a monotonic decrease of the ductility with stress triaxiality, again confirming known trends. Their studies however revealed a slope discontinuity in the fracture locus, occurring at a stress triaxiality of 0.4 for aluminum 2024 and 0.8 for Weldox 420. The locus of aluminum 2024-T351 even shows a complex evolution of ductility for low and negative ranges of stress triaxialities.
(a) (b) (c) (d) (e)
Fig. 0-4 Specimen geometries used by Bao and Wierzbicki [5]
(a) (b)
21
(a) (b)
Fig. 0-6 (a) Fracture locus of aluminum 2024-T351 (b) Variations of the stress triaxiality during tests at low and moderate stress triaxialities (Bao and Wierzbicki, [5]).
(a) (b)
Fig. 0-7 (a) Fracture locus of Weldox 420 (b) Variations of the stress triaxiality and the Lode parameter during tests at moderate stress triaxialities (Barsoum and Faleskog, [6])
Though simulations indicate the location where the plastic strain is maximal and where failure is thus likely to initiate, the choice of the pertinent values to plot on fracture locus remains tricky. Indeed, Bao and Wierzbicki [5] considered an average triaxiality, defined as:
∫
= f p f av d ε ε η ε η 0 1 (0.14)While Barsoum and Faleskog [6] considered the final value. However, the stress state is not necessarily constant throughout the test as can be seen in Fig. 0-6b and Fig. 0-7b. In particular, necking induces an increase in the stress triaxiality. It is not obvious to determine which value should be taken into account: indeed, considering an average triaxiality leads to an underestimation of this parameter, but if the loading path deviates substantially from a radial one, taking only the final value into account may not be pertinent either. Therefore, when conducting fracture tests and analyses, researchers are more and more careful to plot the
Introduction
22
evolution of both the triaxiality and the Lode parameter all the way to fracture and to optimize the specimen geometry in order to limit the evolution of the stress state throughout the test (Dunand and Mohr [7]) (Fig. 0-8).
(a) (b)
(c)
Fig. 0-8 (a) and (b) loading paths to fracture in the spaces
{ }
η,εp and{ }
θ,εp (c) optimized butterfly specimenin combined shear and tension (Dunand and Mohr [7])
3. Microscopic aspects of ductile fracture
The stages of ductile failure have been studied since the 1970’s. Their understanding has benefitted from the advent and progresses in optical microscopy, scanning electron microscopy (SEM), and, more recently, X-ray computed micro-tomography, which allows observations of the bulk of a specimen, provided that the latter is thin enough to be “X-ray transparent (500µm to 2mm, depending on the material density and beam energy) and the defects to be viewed are large enough with respect to the spatial resolution of the technique (about 1µm).
Metals are heterogeneous media: single or dual phase polycrystals containing ceramic or intermetallic particles or fine dispersoids. The brittle character of some inclusions and/or the
23
mismatch of their mechanical properties with those of the surrounding matrix make it the most favoured sites for void nucleation at large strains.
Ductile failure is a three stages process: voids nucleate, grow and coalesce. The presence of these voids is responsible for the dimpled aspect of fracture surfaces, very characteristic of ductile failure (Fig. 0-9).
(a) (b)
Fig. 0-9 Ductile fracture surfaces of (a) an aluminum 2024-T351 sheet (Bron et al. [8]) and (b) a Weldox 420 tubular specimen with torsion-dominant loading (Barsoum and Faleskog [6])
The mechanisms of void nucleation depend on several factors, such as particle/matrix interface strength or stiffness mismatch, particle size, distribution, shape and orientation relative to the loading direction, matrix flow properties and stress state. Void nucleation occurs either by decohesion of the particle/matrix interface or by particle cracking (Argon and Im [9], Beremin [10], Babout et al. [11]) (Fig. 0-10). General trends have been observed: for instance, a matrix with high yield strength or hardening exponent will favor particle cracking, while a matrix with low yield strength or hardening exponent will favor particle/matrix decohesion. In some multiphase materials, damage can also initiate in a brittle phase or at the interface between two phases (Bugat [12], Maire et al. [13]). Sometimes, initial voids exist in the material.
(a) (b) (c)
Fig. 0-10 Examples of (a) particle decohesion and (b) particle cracking in aluminum alloys with different matrix properties (Babout et al. [11]) (c) martensite fracture and ferrite/martensite decohesion in a DP steel (Maire et al. [13]).
Introduction
24
During loading, voids grow and usually link. Different modes of coalescence exist. The most commonly observed are internal necking, where grown voids impinge each other, and void sheeting, in a micro-shear band (Fig. 0.11). Evidences of coalescence by void necklace formation have been reported by Benzerga [14] in steel containing elongated MnS inclusions and loaded in tension along the rolling direction.
(a) (b) (c)
Fig. 0-11 Examples of coalescence by (a) internal necking (Benzerga et al. [15])( b) void sheeting (Benzerga [14]) (c) necklace columns (Benzerga [14])
The effect of the stress triaxiality on void growth and coalescence is strong and has been extensively investigated. At high levels of stress triaxiality (e.g. notched tensile or pre-cracked specimens), voids expansion is observed in most cases, and coalescence occurs by internal necking, while at low levels of stress triaxiality, voids evolve by rotation and distortion, and coalescence occurs by void-sheeting. The microstructural features also play an important role in void growth and coalescence. For instance, the anisotropy of initial void distribution of aluminum 2139 has been investigated by (Morgeneyer et al. [16]) using synchrotron radiation computed tomography, and was shown to have a strong influence on the toughness of the material. Thus, voids initially forming chains in the rolling direction grew and linked in the rolling direction when loaded in this direction, while, when loaded in the transverse direction, they also grew in the loading direction, but kept a high degree of alignment with the rolling direction. Besides, void sheeting coalescence is very much dependent on the void configuration and relative positions. This effect has been analyzed by Weck et al. [17] who conducted tensile experiments coupled with SEM and X-ray tomography on copper sheets in which they had introduced rows of artificial through holes, 10µm in diameter, equally spaced, and forming an angle of 15° or 45° with the loading direction. Coalescence occurred by internal necking between the holes for the 15° angle, while the 45° angle favoured intense shearing between the holes (Fig. 0-12).
25
(a) (b)
Fig. 0-12 Coalescence by (a) internal necking and (b) void sheeting in copper sheets (Weck et al. [17])
Quantitative analyses of nucleation mechanisms have been undertaken. Among them, one can quote an estimate of the local stress necessary for void nucleation due to fracture of MnS inclusions by Beremin [10], based on experiments, finite element analysis and homogenization theory. Simultaneously, Le Roy et al. [18] estimated a strain for void nucleation due to Fe3C in carbon steels. Smooth tensile bars were prestrained, restored, and
then, reloaded to fracture. The nucleation strain was defined as the pre-strain necessary to cause a reduction in the fracture strain. A few years later, Pardoen and Delannay [19] used a similar technique, but also measured the effect of the stress triaxiality on the void nucleation strain in copper. Babout et al. [11] combined X-ray tomography and finite element analysis to establish a critical stress for particle cracking in aluminum matrixes artificially reinforced with spherical ceramic inclusions.
Void growth has been quantitatively analyzed as well. Marini et al. [20] measured cavities enlargement in a sintered-forged steel containing spherical alumina particles, using notched tensile specimens with various notch radii, pre-strained at different levels at room temperature and broken in liquid nitrogen. They estimated the void size on the fracture surface and found that the void growth rate increases exponentially with the stress triaxiality. Void dimension measurements have also been performed, using quantitative metallography or tomography. For instance, Chae and Koss [21] performed metallographic observations on polished sections of broken notched round bars, to assess the field of void area fraction using a fixed grid and determined the local area fraction at the onset of coalescence. Furthermore, they combined local measurements with finite element analysis to map the local strains and stress triaxiality to the local porosity. Maire et al. [13] performed non-proportional loading tests and X-ray tomography to quantify damage initiation and cavities rotation in aluminium matrixes artificially reinforced with hard spherical inclusions. They underlined the importance of taking into account the plastic strain hardening and the nucleation threshold in a damage model aimed at describing metal forming. Shen et al. [22] observed and quantified void
Introduction
26
growth and coalescence in aluminum 6061 pre-cracked specimen via synchrotron laminography, and they identified the critical void volume fraction for coalescence, which they used in a micromechanical damage model. Ghahremaninezhad and Ravi-Chandar [23,24] conducted a series of interrupted tests on aluminum 6061 as well, for moderate stress triaxialities (smooth and notched tensile specimens) and low stress triaxialities (Arcan specimens loaded in combined tension/shear or compression/shear), to characterize damage in a multiscale framework. Analysis of polished and etched sections with optical microscopy showed signs of flow localization (Fig. 0-13). Changes in grain size at various stages were used to estimate local strain levels, which were shown to be much larger than those estimated from strains averaged over a characteristic specimen dimension and used to calibrate strain-to-failure criteria. Damage was found to occur quite late, at plastic strain levels of about 1 at the grain scale and the ductility was found to be a monotonic decreasing function of the stress triaxiality even in the range of low triaxiality, conversely to most macroscopic observations. More specifically, for low stress triaxialities, final failure was reduced to a narrow region within a localized deformation band.
(a) (b)
Fig. 0-13 (a) Flow localization at the center of an aluminum 6061-T6 tensile notched specimen (Ghahremaninezhad and Ravi-Chandar [23]) (b) Shearing in an aluminum 6061-T6 Arcan specimen near the fracture surface (Ghahremaninezhad and Ravi-Chandar [24])
4. Modeling of ductile damage
The literature on ductile failure modeling is extremely large. Some models have been proposed for damage initiation, in particular, to distinguish between particle cracking and decohesion. Among them, Argon and Im [9] proposed a nucleation criterion depending on the interface strength and strength of the brittle particle, which they identified experimentally as was mentioned in section 3. Beremin [10] proposed an improved criterion which, assuming a homogeneous stress field in the particle and using Eshelby’s theory for ellipsoidal inclusions,
27
accounts for plastic strain incompatibility and particle shape effect. Lee and Mear [25] found numerical solutions for stress concentrations factors KI and KP at the interface and in the
particle; these factors depend on the particle aspect ratio, the remote stress triaxiality, the elastic modulii mismatch and the matrix flow properties. They found that as the stress triaxiality increases, particles tend to debond from the matrix rather than to crack; when the particle aspect ratio increases, the difference between KP and KI increases as well, an so does
the ratio KP/KI, meaning that the larger the particle aspect ratio, the more likely the particle to
crack.
A series of models of void growth have been proposed and improved in the past decades. Cockcroft and Latham [26] proposed an empirical model based on a void growth mechanism controlled by the maximum principal stress. Rice and Tracey [27] analyzed a spherical cavity in an infinite rigid and perfectly plastic medium, loaded axisymmetrically. They came up with an analytical expression of the void growth rate as a function of the stress triaxiality and the equivalent plastic strain rate.
p d R dR η ε = 2 3 exp 283 . 0 (0.15)
Their model was modified by Thomason [28] to account for the change of shape of the initial spherical void. Later on, Gurson [29] proposed a homogenized behaviour of porous plastic metals based on a micromechanical study of a spherical cavity in an infinite rigid and perfectly plastic medium obeying J2 plasticity and of yield stressσo, loaded axisymmetrically. Damage is accounted for via the void volume fraction f . The subsequent yield surface reads:
( )
1 0 2 1 cosh 2 2 2 2 = − − + f tr f o o eqσ
σ
σ
σσσσ (0.16)Subsequent extensions of this model have been proposed. σo was replaced by a yield stress with the possibility of isotropic hardening. Tvergaard and Needleman [30] introduced two parameters q1 and q2 to account for the interaction between voids: it is the Gurson-Tvergaard-Needleman model (GTN). The dependency of these parameters on the geometry, the matrix flow properties and the ratio between yield stress and elastic modulus, has been investigated by Faleskog et al. [31].
Analytical methods for ductile damage analysis become rapidly limited due to the complexity of the criteria derivation. Indeed, simplifying assumptions are necessary. Therefore, such methods are not always suitable in most real cases. Numerical methods, such
Introduction
28
as finite element analysis, prove very useful to describe more accurately ductile failure. In particular, unit cell models are much popular in this field. Such models consist in meshing a three dimensional box inside which lies a void with periodic boundary conditions. Mean stress components are prescribed on the boundary of the box, with control of both the triaxiality and the Lode angle parameter. Such analysis allows a verification of analytical solutions, gives a point of comparison with a model, or just brings an understanding of some damage processes, but, due to the periodic boundary conditions, does not capture the influence of a heterogeneous distribution of voids.
The Gurson model captures quite well the effects of the stress triaxiality on void growth, for high levels of triaxialities. However, comparison with unit cell computations such as Koplik and Needleman [32] revealed that the Gurson model predictions of void growth rates are inaccurate; for example the void growth for η =1 3 is overestimated (Fig. 0-14). Another limitation is its unability to predict shear localization and fracture under low triaxiality, unless void nucleation is introduced. Thus, for pure shear, the Gurson model predicts no damage change, which is in contradiction with unit cell studies and experimental observations. Zhang et al. [33] and Barsoum and Faleskog [34] conducted unit cell studies, under different stress states and found that not only does damage evolve under low triaxiality, but also, the Lode angle parameter has a strong effect on the rate of void expansion and coalescence, and on strain localization, especially the stress triaxiality is low (Fig. 0-15). Hence a recent extension of the GTN model was proposed by Nahshon and Hutchinson [35] who introduced the Lode parameter to represent damage growth under shear-dominated stress states. This efficient but phenomenological approach has been criticized since the damage parameter, f, loses its physical meaning. Tomography observation of arrested cracks in Kahn tear test samples Morgeneyer and Besson [36] have shown that the flat to slant transition and slant propagation of the crack result from a change in micromechanisms from high stress triaxiality to shear coalescence. The incorporation in the GTN model of a nucleation term controlled by the Lode parameter of the plastic strain rate tensor allows to account for this transition and to reproduce the slant propagation of the crack in FE simulations.
29 Fig. 0-14 Evolution of the void volume fraction with respect to the deformation for different values of stress triaxiality. Comparison between the Gurson model (dashed line) and unit cell calculations of Koplik and Needleman [32] (plain line). Source Benzerga and Leblond [2]
(a) (b)
Fig. 0-15 Unit cell calculations : (a) evolution of the void volume fraction with respect to the deformation for a fixed triaxiality and different values of the Lode parameter (Zhang et al. [33]) (b) evolution of a localization indicator with respect to the deformation for a fixed triaxiality and different values of the Lode parameter (Barsoum and Faleskog [34]).
The Gurson model also assumes initially spherical voids, which remain spherical throughout the loading, which, in practice, is hardly true for stress triaxiality around 1.5. Gologanu et al. [37,38,39] derived a model which accounts for void shape effects (GLD model). It assumes axisymmetric prolate or oblate ellipsoidal cavities loaded axisymmetrically. An initially spherical cavity tends to become prolate at low triaxiality and oblate at high triaxiality (Fig. 0-16a). In comparison with the Gurson model, it does not overestimate the void growth rate when η =1 3 (Fig. 0.16b).
Introduction
30
(a) (b)
Fig. 0-16 (a) Shape variation of an initially spherical cavity predicted by the GLD model (b) Evolution of the void volume fraction with respect to the deformation for various stress triaxialities; comparison between the GLD and Gurson model (Benzerga and Leblond [2])
Benzerga and Besson [40] proposed another extension of the Gurson model to account for plastic anisotropy, while combined plastic anisotropy and void shape effects were implemented by Keralavarma and Benzerga [41,42] for non-axisymmetric loading.
One can note that models such as Rice and Tracey [27] or Gurson [29] and its extensions do not take into account the presence of a particle within the voids. Bordreuil et al. [43] modified the Rice and Tracey [27] void growth model to take into account the contact between an inclusion and the matrix. In connection with a specific plastic potential, their analysis led to a compressible plastic constitutive law, which predicts void growth even at zero stress triaxiality.
Models resulting from homogenization techniques have been proposed. Aravas and Ponte-Castañeda [44] developed a model for the viscoplastic behaviour of a porous medium that predicts the anisotropy induced by the changes in the shape and orientation of the voids. Danas and Ponte-Castañeda [45] derived a model dependent on the porosity and average pore shape (Fig. 0-18 and Fig. 0-19).For high stress triaxialities, their model predicts void growth, and a decrease evolution in ductility as the stress triaxiality rises. The stress versus strain curve features a peak load, and a subsequent decrease. The Lode parameter in this range has a weak influence. For low stress triaxialities, an abrupt collapse of the voids is predicted, along with a simultaneous strain localization and a sudden drop in the material load-carrying capacity. The strain at the onset of this unstability is found to be highly dependent on the Lode parameter. Such softening is not predicted by Nahshon and Hutchinson’s extension of the Gurson model [35] and was criticized by Hutchinson and Tvergaard [46] who assert that
31
void collapse will, on the contrary, produce larger localization strains, due to the surface contact of collapsed voids.
Fig. 0-17 Collapse of an initially spherical void predicted by unit cell calculation for shear-dominant loading (Nielsen et al. [47])
(a) (b)
Fig. 0-18 Influence of the Lode parameter on the stress-strain curve for a fixed value of stress triaxiality (a) high triaxiality (b) low triaxiality (Danas and Ponte-Castañeda [45])
(a) (b)
Fig. 0-19 Influence of the Lode parameter on void aspect ratio curve for a fixed value of stress triaxiality (a) high triaxiality (b) low triaxiality (Danas and Ponte-Castañeda [45])
The necessity of accounting for the Lode parameter in ductile failure is now accepted. Besides models resulting from micromechanics or homogenization, phenomenological models have been developed as well in this direction. For instance, Gao et al. [48] proposed an elasto-plastic model depending on
I
1,J
2 and J3, and extended the GTN model applicability byIntroduction
32
replacing the Mises equivalent stress by the new equivalent stress, to include the effect of the third invariant on ductile failure. Bai and Wierzbicki [49] proposed a model of metal plasticity and fracture with pressure and Lode dependence, which allows to distinguish between materials that depend weakly or strongly on
I
1 or the Lode parameter.Bai and Wierzbicki [49] showed the applicability of the Mohr-Coulomb (MC) [50,51] fracture criterion, extensively used in soil mechanics, to ductile fracture of uncracked bodies. This criterion accounts for the dependency of failure to both the triaxiality and the Lode angle parameter. According to the MC criterion, fracture occurs when the combination of normal stress σn and tangential stress τ on a plane of normal n arbitrarily cutting a material element reaches a critical value:
2 1 maxτ+cσn =c n (0.17) which yields:
(
1 3) (
1 1 3)
2 2 1 2 1+c σ −σ +c σ +σ = c (0.18)One can recognize the Tresca equivalent stress
(
σ1−σ3)
in Eq. (0.18). Using successivetransformations (Bigoni and Piccolroaz [52]) and the hardening law, Bai and Wierzbicki [49] expressed this stress-based criterion in the mixed stress-strain space
{
εf,η,θ}
. This criterion was extended by Mohr and Marcadet [53] to the Hosford-Coulomb criterion (HC) by replacing the Tresca stress in the MC model by the Hosford equivalent stress in order to improve its predictions.5. Goal of the study
As mentioned in the previous sections, the effect of the stress state on ductile failure has kept many researchers busy for several decades. Until recently, experimental studies focused on high triaxiality levels and very little was said of the Lode parameter. Controlling both the stress triaxiality and the Lode parameter experimentally is tricky, especially as most tests are conducted in a plane stress context. However, numerical and theoretical investigations showing that the Lode parameter should be taken into account when modeling ductile fracture, especially for low levels of stress triaxiality, have drawn the attention on the necessity of monitoring the history of both these parameters when constructing a material fracture locus.
33
While the possibilities given by unit cell models are very rich, the comparison between the many modeling approaches that exist in this field and the experiments is challenging, at the macro scale where accurate quantitative fracture prediction is not always achieved, and at the micro scale, where mechanisms differ according to the microstructural features.
The work that has been undertaken in this thesis aims at contributing to a better understanding of ductile damage mechanisms in metallic materials. A contribution is the design of a specimen for fracture testing of bulk materials that will allow a wide range of stress states to be obtained, the effect of the stress state on the ductility to be investigated and fracture criteria to be calibrated, and at the microscopic scale, the effect of the stress state on damage mechanisms to be clarified.
The first chapter will present thoroughly the experimental protocol that was developed and applied successfully to 36NiCrMo16 steel to investigate, at the macroscopic scale, the influence of the stress state on the material ductility. In the second chapter, the same protocol will be applied to obtain the fracture locus of aluminum alloy 2024-T351 for proportional and non-proportional loading. This fracture locus will be compared to that obtained by Bao and Wierzbicki [5] and extensively quoted in literature. A recently-proposed shear localization criterion, the Hosford-Coulomb criterion (Mohr and Marcadet [53]), will be calibrated and validated for each material. The third chapter will investigate the damage mechanisms for stress triaxialities lower than 1/3, for 36NiCrMo16 steel and 2024-T351 aluminum alloy, by means of microscopy on tests to fracture, interrupted tests or in-situ tests in a SEM. Finally, the fourth chapter will bring insight on the damage mechanisms of aluminum 2024-T351 analyzed by X-ray laminography at intermediate stress triaxialities, by means of an in-situ test performed on a CT specimen. The mechanisms highlited in the third and fourth chapter justify the use of a shear localization criterion such as the Hosford-Coulomb criterion.
I.
Determination of the Effect of Stress State on the
Onset of Ductile Fracture through Tension-Torsion
Experiments
In this chapter, a tubular tension-torsion specimen is proposed to characterize the onset of ductile fracture in bulk materials at low stress triaxialities. The specimen features a stocky gage section of reduced thickness. The specimen geometry is optimized such that the stress and strain fields within the gage section are approximately uniform prior to necking. By applying different combinations of tension and torsion, the material response can be determined for stress triaxialities ranging from zero (pure shear) to about 0.58 (transverse plane strain tension), and Lode angle parameters ranging from 0 to 1. The relative displacement and rotation of the specimen shoulders as well as the surface strain fields within the gage section are determined through stereo digital image correlation. Multi-axial fracture experiments are performed on a 36NiCrMo16 high strength steel. A finite element model is built to determine the evolution of the local stress and strain fields all the way to fracture. Furthermore, the newly-proposed Hosford-Coulomb fracture initiation model [53] is used to describe the effect of stress state on the onset of fracture.
37
Recent research on ductile fracture emphasizes the effect of the third stress invariant on the onset of ductile fracture in metals. Examples include the recent studies by Barsoum and Faleskog [6], Nahshon and Hutchinson [35], Bai and Wierzbicki [49] and Nielsen and Tvergaard [54] which all hypothesize on the dependence of the equivalent plastic strain to fracture on the third stress tensor invariant in addition to the stress triaxiality. Micromechanical demonstrations of the effect of the Lode parameter have been presented among others by Barsoum and Faleskog [34], Danas and Ponte Castaneda [45] and Dunand and Mohr [55].
At this stage, it is still very difficult to draw concrete conclusions on the effect of the Lode angle on the onset of fracture based on experiments. Reliable experiments characterizing the effect of stress state on the onset of ductile fracture are difficult to achieve, in particular due to necking prior to the onset of fracture in thin-walled specimens. Hybrid experimental-numerical techniques have been developed to address this issue. Mohr and Henn [56] subjected flat butterfly-shaped specimens to combined tension and shear loading. Due to the heterogeneity of the stress and strain fields in the specimen gage section, they made use of a finite element model to determine the stress and strain histories at the location of fracture initiation. This technique has been developed further by Teng et al. [57] and Dunand and Mohr [7] by optimizing the specimen shape to reduce experimental errors, and through the use of more advanced plasticity models for the identification of the loading path to fracture. In the case of sheet materials, the butterfly testing technique requires a local reduction of the initial specimen thickness. This machining procedure may affect the mechanical properties of the specimen material (see Mohr and Ebnoether, [58]) which adds to the uncertainty in the experimental results. Flat notched specimens provide a robust alternative to this technique to characterize the fracture response at stress triaxialities above 0.33. It is now common practice to take a hybrid experimental-numerical approach to analyze notched tensile experiments (e.g. Dunand and Mohr, [59]). Similarly, other sheet specimen geometries are being used to cover different stress states. The maturation of digital image correlation techniques (e.g. Bornert et al., [60], Sutton et al., [61]) also contributed significantly to the success of hybrid experimental-numerical approaches.
In the case of bulk materials, tubular specimens can be extracted to perform combined tension-torsion experiments. The first experiments of this type have been performed already one century ago. The most prominent are those by Taylor and Quinney [62] which were instrumental in the development of multi-axial plasticity models of metals. Taylor and
Chapter I
38
Quinney [62] used rather slender thick-walled tubes, while more stocky thin-walled tubes are used today. For example, Nouailhas and Cailletaud [63] used 1mm thick tubes with an inner diameter of 14mm and a free length of 24mm to investigate the tension-torsion response of single crystal superalloys. Zhang and Jiang [64] studied the propagation of Lüders bands in 1045 steel using a 1.1mm thick tension-torsion specimen of an inner diameter of 20.2mm and a gage section length of 25.4mm. Khan et al. [65,66] used a tubular specimen of 12.7mm inner diameter with a 50.8mm long, 1.4mm thick gage section to perform tension-torsion experiments on Al6061-T6511 and annealed Al-1100.
Multi-axial stress states in tubular specimens may also be achieved through combinations of tension and internal pressure. While the above experimentalists used tension-torsion experiments for plasticity characterization, tension-internal pressure experiments have been performed to study both the plasticity and ductile fracture of metals. For example, Kuwabara et al. [67] tested Al 5154-H112 tubes of 76.3mm outer diameter and 3.9mm wall thickness under tension and internal pressure. Korkolis et al. [68] subjected Al-6061-T6 tubes to internal pressure and axial load to investigate the plasticity and fracture under biaxial loading. Their specimens featured a nominal diameter of 51mm, a wall thickness of 1.65mm and a test section length of 229mm.
Shear buckling often limits the validity of tension-torsion experiments to moderate strains. In order to test engineering materials all the way to fracture under combined tension-torsion loading, Barsoum and Faleskog [6] introduced a symmetric circumferential notch into the tube wall, thereby concentrating plastic deformation into a very narrow region. To investigate the ductile fracture of Weldox steels, they used a nominal specimen diameter of 24mm, a wall thickness of 1.2mm within the notched section and of 3.2mm outside the notch. The notch radius was only 0.5mm, which creates substantial radial stresses when tension is applied. Their experimental program covered stress triaxialities (at the onset of fracture) from about 0.3 to 1.2. Another strategy for preventing shear buckling is to shorten the specimen gage section. This approach has no obvious negative effect when applying torsion only, but it changes the stress state in tension. For pure tension applied to the specimen boundaries, the stress state in the tube walls is no longer uni-axial tension, but close to transverse plane strain tension instead, as circumferential deformation is prohibited by the boundary conditions in stocky tension-torsion specimens.
Lindholm et al. [69] designed a stocky tubular specimen for dynamic torsion testing of metals. It featured an inner diameter of 12.9mm, a gage section length of 3.1mm and a gage
39
section thickness of 0.8mm. Note that the choice of a very short gage section in a specimen for dynamic testing is not only driven by stability considerations, but also necessary to ensure locally quasi-static loading conditions. Gao et al. [70] modified the Lindholm specimen to perform static fracture experiments on Al 5053-H116 (extracted from plate stock). The specimen gage section was 2.5mm long and 0.75mm thick. The tube inner diameter was 13.1mm, the outer diameter 25.4mm. In a follow-up paper, Graham et al. [71] show that this experimental technique covers a range of stress triaxiality from 0 to 0.6. A very recent study on the ductile failure of aluminum 60161-T6 under combined tension and shear has been completed by Haltom et al. [72]. They used a tubular specimen of a uniform inner diameter of 44.3mm and a wall thickness of 1mm within the 10mm long test section.
In this chapter, a stocky tubular specimen is presented for characterizing the onset of fracture in bulk materials at low stress triaxialities. Combined tension-torsion fracture experiments are performed on an initially isotropic high strength steel. Using a hybrid numerical-experimental procedure, the loading paths up to the onset of fracture are determined and presented in the space of stress triaxiality, Lode angle parameter and equivalent plastic strain. These results are subsequently used to identify the parameters of an Hosford-Coulomb fracture initiation model.
1. Specimen design
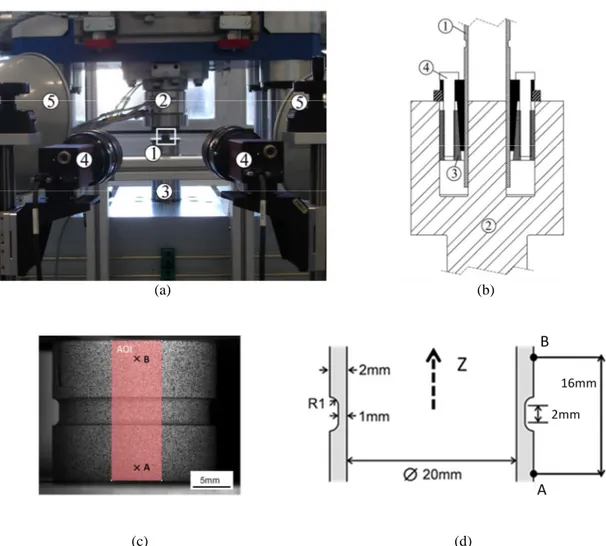
1.1. Specimen geometry
Fig. I-1 shows a sketch of the axisymmetric specimen geometry proposed for the testing of metals under combined tension and torsion. The specimen geometry is characterized by five parameters (Fig. I-1b): the inner diameter D, the gage section thickness t, the gage section height h , the wall thickness e of the shoulder region, and the fillet radius a (Fig. I-1b). The main considerations in specifying the specimen dimensions are:
(1) the maximum axial force and torque may not exceed 100kN and 600Nm, respectively; this limitation along with the availability of suitable specimen clamps led to the choice of D=20mm.
(2) the thickness-to-diameter ratio, t /D, needs to be small to reduce the gradients in the stress and strain fields along the radial direction; a minimum thickness of t=1mm is
Chapter I
40
chosen in view of uncertainties in the experimental results associated with dimensional inaccuracies in the initial specimen geometry (for example, a machining tolerance of ±50µm equates to an uncertainty of 5% in the reported average stress fields)
(3) the shoulder-to-gage section thickness ratio, e /t , needs to be sufficiently large to prevent the plastic deformation of the shoulder region; a shoulder thickness of
mm
e = 2 is chosen to prevent the plastic deformation of the shoulders even for
high strain hardening materials.
(4) the height-to-thickness ratio, h / t , needs to be small to prevent buckling under torsion;
(a) (b)
Fig. I-1 (a) Schematic of specimen geometry, (b) geometry parameters and FE mesh.
In addition, the results from a finite element study revealed that
(5) the greater the height-to-thickness ratio, h / t , the smaller the radial gradient in stress triaxiality (Fig. I-2a). Based on (4) and (5), a gage section height of
mm
h = 2 is chosen.
(6) The greater the fillet radius a , the more uniform the stress fields. However, a should be small to keep the effective buckling length short. We chose a radius of a =1mm ; for this radius, there is no noticeable notch effect when tension is applied to the specimen, i.e. the radial stresses are still negligibly small as compared to the axial and circumferential stress components (Fig. I-2b).
41
Fig. I-4c provides a summary of the final specimen dimensions. The overall length of the specimens is 90mm with a free length between the specimen clamps of 40mm.
(a) (b)
Fig. I-2 Stress distribution inside the gage section prior to necking: (a) Influence of the gage section height h on stress state uniformity along the radial direction (b) variation of the radial stress along the radial direction. A radial coordinate of 0 and 1 corresponds to the inner and outer gage section surface, respectively. Note that the
free surface condition σrr =0 appears to be only approximately fulfilled due to the normalized ordinate axis.
These profiles are obtained by FE calculations, using a Levy – von Mises material and a isotropic Swift hardening law, with a hardening exponent of 0.2.
1.2.Analytical estimate of the achievable stress states
Given the stockiness of the specimen gage section, the achievable stress states are computed assuming zero plastic circumferential strain. Furthermore, plane stress conditions (along the radial direction) are assumed. For a Levy-von Mises material, the flow rule yields
zz
σ σθθ =0.5
. (1.1)
The Cauchy stress tensor may thus be written as
) ( 5 . 0 Z Z Z Z e e e e e e e e σ =σ ⊗ + σ Θ⊗ Θ+τ ⊗ Θ+ Θ⊗ (1.2)
where σ denotes the stress along the eZ -direction, and τ is the shear stress in the (eZ,eΘ) -plane.
The stress state is characterized through the stress triaxiality and the Lode angle parameter, which were defined in (0.8), (0.10) and (0.11), in the Introduction. The stress state in the specimen gage section is controlled by the ratio of torsion and axial loading. Based on the specimen diameterD, the axial force F and the torque M , the biaxial loading angle β is defined as
Chapter I 42 τ σ β = ≅ M FD 2 tan . (1.3)
Combining Eqs. (0.8), (0.9), (0.10) and (1.3), the stress triaxiality and the Lode angle parameter can be expressed in terms of the biaxial loading angle,
4 tan tan 3 1 2 + = β β η (1.4) . (1.5)
The Lode angle parameter is plotted as a function of the stress triaxiality in Fig. I-3, while β is used as curve parameter. Note that this relationship between the Lode angle and the stress triaxiality is only valid for plane stress conditions. For β =0° (torsion only), the stress state corresponds to pure shear which is characterized by η=0 and θ =0. The same Lode angle parameter value is achieved for β=90° (tension only) where the stress state corresponds to transverse plane strain tension. A uniaxial stress state (η =0.33 and θ=1) prevails for combined tension-torsion loading at β ≅55°.
Fig. I-3 Theoretical range of stress states achievable with the current geometry.
2. Experiments
2.1. Material
All specimens are extracted from an annealed 30mm diameter bar of the high strength steel 36NiCrMo16. Tab. I-1 shows the chemical composition as provided by the manufacturer
(
)
+ − = 2 32 4 tan tan 3 6 cos 2 1 β β π θ a43
ThyssenKrupp. Large strain compression tests on 13mm-large cubes extracted along the bar axis and the transverse direction revealed no noticeable anisotropy in the material behavior at the macroscopic level.
C Mn Si S P Cr Ni Mo Cu Al
0.37 0.41 0.25 0.016 0.011 1.72 3.74 0.28 0.25 0.03
Tab. I-1 Chemical composition of 36NiCrMo16 provided by ThyssenKrupp Steel (in weight %)
2.2.Experimental procedure
A servo-hydraulic axial/torsion and internal pressure loading frame (TEMA Concept, France) is used to perform all experiments (Fig. I-4a). The vertical and rotational actuators cover a range of ±100kN and ±600Nm, respectively. The specimens (part #1 in Fig. I-4b) are attached to the testing machine using annular pressure clamps (part #3 in Fig. I-4b). The mechanical connection between the testing machine and the specimen is established through tangential frictional stresses between the contact surfaces only. For this, a female connector matching the exact dimensions of the specimen shoulder region is rigidly connected to the testing machine (part #2 in Fig. I-4b). The alignment of the upper and lower connector is verified prior to testing using a short tube of constant wall thickness. After verifying the alignment and degreasing all surfaces, the specimen is inserted in the lower and upper connectors. Due to the tight fit of the specimen into the testing machine (no longer movable by hand), both actuators can already be put into force control mode to avoid any straining of the specimen gage section during set-up. Subsequently, the outer pressure ring is tightened (part #4 in Fig. I-4b) to apply a normal pressure to all connecting surfaces. Note that the inner piece of the female connectors is also rigidly connected to the machine, i.e. the shear stresses are transmitted between the specimen and the testing machine through both the inner and outer specimen surfaces, thereby reducing the maximum shear stresses in the mechanical connections by about a factor of two.
Throughout the experiments, the biaxial loading angle is kept constant using different control settings:
• For β =0°, the rate of rotation is prescribed (0.019°/s), while operating the vertical actuator under force control (F = 0 ).
Chapter I
44
• For 0<β ≤55° (shear-dominated), the rate of rotation is prescribed (0.019°/s), while the axial position is incrementally adjusted such that β remains constant.
• For 55°< β <90° (tension-dominated), the axial displacement rate is prescribed (0.002mm/s), while the rotation is incrementally adjusted such that β remains constant.
• For β =90°, the axial velocity is prescribed (0.002mm/s), while operating the rotational actuator under torque control (M = 0 ).
(a) (b)
(c) (d)
Fig. I-4 (a) Photograph of the experimental setup showing 1-specimen, 2-axial/torsion load cell, 3-piston, 4-cameras, 5-lighting, (b) clamping device (c) left camera view of the specimen with DIC area of interest (AOI) highlighted, (d) specimen dimensions.
45
2.3. Displacement and strain measurement
The displacement fields within the gage section and a part of the shoulder regions are measured using stereo Digital Image Correlation (DIC). A thin layer of matt white paint is applied onto the specimen surface along with a black speckle pattern (Fig. I-4c). Two digital cameras Pike F505B 2452x2054 equipped with 90mm macro lenses (Tamron, model SP Af90mm F/2.8 Di) are used to monitor the specimen surface from two different radial perspectives at a frequency of 1Hz. The camera sensors are positioned at a distance of about 800mm from the specimen surface with an F11 aperture to ensure sufficient depth of field for measuring large rotations. The relative position of the cameras and the respective focal lengths are identified from preliminary measurements on a rigid target. The displacement field is computed based on the acquired images using the VIC3D software (Correlated Solutions) assuming an affine transformation of a 21x21 pixel subset (with 24 mµ per pixel).
Based on the measured initial shape, a cylindrical coordinate system (eR,eΘ,eZ) is established such that the eZ -vector coincides with the specimen axis (Fig. I-4d). The initial position of a point on the specimen surface is then given by the position vector
Z
R Z
Re e
X= [Θ]+ , (1.6)
while its current position on the deformed specimen surface reads Z R z re e x= [θ]+ . (1.7) The functions ] , , [R Z r r= Θ (1.8) ] , , [R ΘZ =θ θ (1.9) ] , , [R Z z z= Θ (1.10)
are obtained from stereo digital image correlation.
The DIC position measurements serve two purposes. Firstly, the relative motion of two points A and B positioned on the respective upper and lower specimen shoulder (Fig. I-4d) is determined, ) ( ) ( ) (t z t z t U = A − B ∆ , (1.11) ) ( ) ( ) (t θA t θB t θ = − ∆ . (1.12)
Secondly, the surface strain field is computed from the position measurements. Re-writing the vector of the current position in terms of the base vectors associated with the initial configuration,
![Fig. 0-4 Specimen geometries used by Bao and Wierzbicki [5]](https://thumb-eu.123doks.com/thumbv2/123doknet/3009116.84473/21.892.180.766.516.1061/fig-specimen-geometries-used-bao-wierzbicki.webp)
![Fig. 0-18 Influence of the Lode parameter on the stress-strain curve for a fixed value of stress triaxiality (a) high triaxiality (b) low triaxiality (Danas and Ponte-Castañeda [45])](https://thumb-eu.123doks.com/thumbv2/123doknet/3009116.84473/32.892.170.735.411.639/influence-parameter-stress-strain-triaxiality-triaxiality-triaxiality-castañeda.webp)