O
pen
A
rchive
T
oulouse
A
rchive
O
uverte
(OATAO)
OATAO is an open access repository that collects the work of some Toulouse
researchers and makes it freely available over the web where possible.
This is an author’s version published in:
http://oatao.univ-toulouse.fr/
20539
To cite this version:
Chaisubanan, Napapat and Hunsom, Mali and Vergnes, Hugues and Pruksathorn,
Kejvalee Effect of MO2 (M = Ce, Mo, Ti) layer on activity and stability of PtCo/C
catalysts during an oxygen reduction reaction. (2016) Energy Conversion and
Management, 114. 348-355. ISSN 0196-8904
Any correspondance concerning this service should be sent to the repository administrator:
[email protected]
Effect of MO
2
(M = Ce, Mo, Ti) layer on activity and stability of PtCo/C
catalysts during an oxygen reduction reaction
Napapat Chaisubanan
a, Mali Hunsom
a,b, Hugues Vergnes
c, Kejvalee Pruksathorn
a,b,⇑aFuels Research Center, Department of Chemical Technology, Faculty of Science, Chulalongkorn University, 254 Phayathai Road, Bangkok 10330, Thailand bCenter of Excellence on Petrochemical and Materials Technology (PETRO-MAT), Chulalongkorn University, 254 Phayathai Road, Bangkok 10330, Thailand cLaboratoire de Génie Chimique, ENSIACET, Institut National Polytechnique de Toulouse, UMR-CNRS 5503, 4 allée Emile Monso, 31030 Toulouse Cedex 4, France
Keywords: PtCo/C catalyst PEM fuel cell Metal oxide Titanium dioxide
a b s t r a c t
The performance of PtCo/C catalysts in the presence of a metal oxides layer for an oxygen reduction reac-tion (ORR) was investigated. Different types of metal oxides (CeO2, MoO2and TiO2) and metal loadings
(0.03–0.45 mg/cm2) were incorporated on the PtCo/C catalyst layer. Their activity was analyzed in acid
solution and proton exchange membrane (PEM) fuel cell under a H2/O2environment at 60 !C and
ambi-ent pressure, while the stability was tested in an N2-saturated H2SO4solution using repetitive potential
cycling. It was found that the addition of metal oxides on a catalyst layer had no influence for PtCo/C mor-phology. However, they significantly affected the electrochemical surface area (ESA), internal contact resistance (ICR) and hydrophilic/hydrophobic properties of the catalysts layer. Furthermore, they signif-icantly affected the ORR activity and stability in acid solution and PEM fuel cell operation. Among all studied metal oxides, the TiO2exhibited the best property for use as the catalyst interlayer in PEM fuel
cell for both activity and stability enhancement.
1. Introduction
The PEM fuel cell is an electrochemical apparatus that produces electricity effectively and continuously in the presence of continu-ous reactant feed with zero emission of contaminants[1]. To facil-itate the utilization and commercialization of PEM fuel cells, their cost and reliability/durability have to be addressed. Their major cost can be attributed to the utilization of an expensive Pt metal as the catalyst in the electrode layer[2]. Thus, many researchers have been developed the new types of fuel cell catalysts such as non-Pt catalysts [1,3–8], Pt-based catalysts [9–12] and non-precious metal composite electrocatalysts[13–15]as a means to reduce fuel cell cost. Among these, the most promising catalysts are the nanostructured Pt-alloy catalysts because they can enhance activity levels to a high degree when compared with pure Pt cata-lysts[16]. The Pt–Co alloy catalyst is the most interest because it showed the highest fuel cell performance and more stable than other Pt–M alloys (M = V, Ni, Fe)[17,18]. The loss of fuel cell dura-bility is principally caused by the loss of fuel cell components: cat-alyst, membrane or bipolar plate[19], which can be alleviated by
using appropriate material to fabricate a fuel cell or appropriate operating conditions. Another strategy that can extend the lift-time and activity of fuel cells is the water management strategy
[20]. This is because accumulation of excessive water in fuel cells leads to flooding, which causes low accessibility of reactant to the reaction zone, particularly at high current. However, too low water in fuel cells results in dry out of the membrane, which causes sluggishness of proton transfer to the membrane as well as damage of cell components. Thus, various water management strategies have been developed to optimize water content in a fuel cell, par-ticularly in the catalyst layer. The addition of a conductive material plate with perforations between the flow field plate and electrocat-alyst substrate can enhance the operational life of a PEM fuel cell for no humid conditions[21]. This then leads to improvement of water management in fuel cells. The mesoporous hydrophobic channels, made as a tubular open-ended mesopores through the catalysts with addition of PTFE nanoparticles, can reduce the con-centration loss at high current of the PEM fuel cell owing to its capability for water removal[20]. The incorporation of a double-layer cathode gas diffusion media (GDM) with high PTFE content in the fuel cell can improve the ability of water management as it can reduce the overall saturation level and voltage fluctuations
[22]. The addition of a GDL coated with hydrophilic carbon in microporous layer exhibited an ability to conserve membrane humidity under low humidity conditions due to its ability to expel ⇑Corresponding author at: Fuels Research Center, Department of Chemical
Technology, Faculty of Science, Chulalongkorn University, 254 Phayathai Road, Bangkok 10330, Thailand. Tel.: +66 (2) 2187523; fax: +66 (2) 2555831.
water and maintain oxygen on electrocatalyst electrode[23]. In previous work of Chaisubanan et al.[24], the PtCo/C catalyst with TiO2in mixed phase of anatase and rutile could improve the
hydro-philic property of PtCo/C catalyst layer and had significant effect on the PEM fuel cell performance in middle to high voltage than that of PtCo/C catalyst with TiO2in rutile phase.
In the present study, the various types and loadings of the MO2/
PtCo/C catalyst (M = Ce, Mo, Ti) were investigated to determine their effect on water management in the PEM fuel cell. The ORR activity and stability of all prepared catalysts were also explored. This is because they have different hydrophilic/hydrophobic prop-erties and, as mentioned previously, the interface of Pt and metal oxide are the ORR active sites[25]. It was then expected that these properties of metal oxides would facilitate a high ORR activity as truly as the stability of PEM fuel cell.
2. Experimental
2.1. Preparation of catalyst-coated membrane
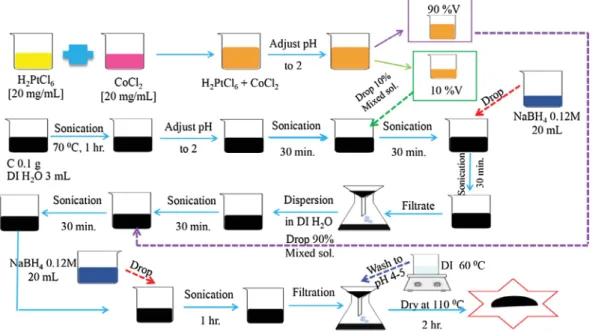
The PtCo/C catalyst was produced by H2PtCl6!6H2O (Sigma–
Aldrich) and CoCl2!6H2O (Kanto Chemical) as the precursors and
NaBH4(Labchem) as the reducing agent. The method of the
prepa-ration was same as research of Chaisubanan et al.[24]as shown in
Fig. 1.
To prepare the catalyst-coated membrane, the mixture of PtCo/C catalyst and distilled H2O was sonicated at approximate 30 !C for
30 min. Sequentially, Nafion solution (5 wt%, Fluka) and i-propanol (99.99%, Fisher) were added and sonicated for 1 h to obtain catalyst ink with a catalyst to Nafion weight ratio of 67:33[26]. Afterward,
the ink was sprayed slowly onto the Nafion membrane 115 at 80 !C by a spray gun (Crescendo, Model 175-7TM) and left at room
temperature to dry the catalyst layer for a few minute. This method was repeated to obtain a metal of 0.15 mg/cm2and dried at the same
temperature for 10 min. For an anode side, the commercial 20 wt% Pt/C (ETEK) was applied by the same method at identical Nafion con-tent and catalyst loading (0.15 mg/cm2).
2.2. Preparation of metal oxide-coated PtCo/C catalyst
Three types of commercial metal oxides, including TiO2 (P25
Degussa, Sigma–Aldrich), MoO2 (Sigma–Aldrich) and the
as-prepared CeO2, prepared by the calcination of Ce[NO3]3!6H2O
(Sigma–Aldrich) at 600 !C for 90 min[27]were used in this study. To incorporate commercial TiO2and CeO2on the catalyst layer at
different loadings of 0.03, 0.06, 0.15, 0.30 and 0.45 mg/cm2, 0.4,
0.8, 1.5, 3.0 and 5.0 mg of either TiO2or CeO2were mixed with
6 mL of i-propanol and sonicated 15 min at ambient temperature. For MoO2, a similar quantity of MoO2as TiO2and CeO2were
dis-persed in 6 mL of ethanol (Merck) and resonicated for 30– 60 min. Sequentially, the metal oxide slurry was applied on the PtCo/C catalyst layer by direct spray. Finally, the ready-to-use metal oxide-coated PtCo/C catalyst (MO2/PtCo/C) was obtained
after drying at 80 !C for 30 min.
2.3. Preparation of membrane electrode assembly (MEA)
The MEA was fabricated by a conventional process, and described in Chaisubanan et al. [24]. In brief, the sublayer ink-coated GDL was formulated by mixing of deionized water, 60% Nomenclature
jk kinetic current density (mA/cm2)
j current density (mA/cm2)
x
rotation rate (rpm)ne number of involved electrons
F Faraday’s constant (96,485 C/mol)
D diffusion coefficient of oxygen in solution (1.9 " 10#5cm2/s)
m
kinematics viscosity (0.01 cm2/s)C oxygen concentration in the bulk solution (1.1 " 10#6
mol/cm3)
(w/w) polytetrafluoroethylene, i-propanol and treated carbon in ultrasonic bath at the ambient temperature for 30 min. The ink was brushed on a GDL (carbon cloth, ETEK) several times to get the loading of carbon of $2.0 mg/cm2. After that, it was dried 1 h
at 300 !C to remove an excess solvent. Afterward, the catalyst coated membrane (Section2.1) was pressed between coated GDL sheets by a compression mold at 65 kg/cm2 and 137 !C for
2.5 min and cool pressed at ambient temperature for 2.5 min. 2.4. ORR activity test
The ORR activities of all catalysts were tested by a rotating disk electrode (RDE) in H2SO4solution saturated with oxygen and in the
PEM fuel cell with H2/O2environment. The other test was carried
out in the fuel cell environment by mounting the MEA obtained from Section2.3on commercial hardware and testing in a test sta-tion at 60 !C and ambient pressure. The 100 sccm of humidified H2
and O2were fed into the anode and cathode, respectively. Prior to
drawing the current, the cell was run at high current density (>700 mA/cm2) for a certain period. Subsequently, the current
was drawn between the open circuit potential (OCP) to 0.1 V and demonstrated in terms of a performance curve or current-den sity–potential curves. For the activity test in H2SO4solution, the
catalyst ink prepared was coated on the circular GDL with 1 cm diameter, assembled with the RDE using as a working electrode. A Pt gauze and the saturated calomel electrode (SCE) were used as the counter and reference electrodes respectively. The 0.5 M H2SO4was bubbled by O2gas for 1–2 h before the test. The ORR
activity of the MO2/PtCo/C catalyst was determined by linear
sweep voltammetry (LSV) under a GPES program connected with the Potentiostat/Galvanostat, at 25 !C and atmospheric pressure. The studied potential range was #0.05 to 0.65 V at varying rotation rates (500–2000 rpm) and 10 mV/s sweep rate.
2.5. Catalyst or electrode characterizations
The structure of all catalysts was characterized by X-ray diffrac-tometry (XRD, D8 Discover-Bruker AXS). The morphology and metal dispersion were characterized by the scanning electron microscopy (SEM) with energy dispersive X-ray spectroscopy (EDX) on a JSM 6400 machine. The ICR of MO2/PtCo/C catalysts
was tested by a homemade through-plane test system. The 1.0 " 1.5 cm of MO2/PtCo/C catalyst coated electrodes were cut
and placed between the two copper test electrodes. The current was applied in the range of 0.01–0.2 A by a DC power supply (Mas-tech, HY3002), and the voltage was measured by a voltmeter (Richtmass, RM-15). The conductivity of MO2/PtCo/C catalysts
was measured at 25 !C by 4-probe apparatus (Jandel, RM3-AR). The water contact angle of all catalysts was evaluated by the Stan-dard Contact Angle Goniometer (Rame’-hart, 200-U1). The ESA was estimated from the H2 stripping method in H2SO4 solution
saturated with N2 with the potential range of #0.24 to +1.00V
and 20 mV/s of scan rate by potentiostat/galvanostat (DEA332, Radiometer)[28]. A Pt gauze and the saturated calomel electrode (SCE) were used as the counter and reference electrodes respec-tively. The corrosion of all MO2/PtCo/C catalysts was tested in
0.5 M H2SO4 in the potential range of #0.58 to 0.02 V with scan
rate of 1 mV/s using the LSV program connected with the Poten-tiostat/Galvanostat (PGSTAT 30, Autolab). The as-prepared cata-lysts were used as working electrode, a Pt gauze was used as counter electrode and saturated calomel electrode (SCE) was used as reference electrode.
In this work, all experimental data were obtained from 3 exper-iments with the accepted error of less than 3%.
3. Results and discussion
3.1. Physical and chemical characterizations of metal oxides (MO2) and
MO2/PtCo/C catalysts
The SEM images of all metal oxides used in this work are demonstrated inFig. 2. At identical magnification, both CeO2and
MoO2 demonstrated their structure as a large flat sheet. A
smoother surface was observed for MoO2than for CeO2, probably
because the former metal oxide had a higher crystallinity than that of the latter metal oxide. The TiO2demonstrated an almost
spher-ical shape with a smaller particle size than other metal oxides. Regarding their crystal structures, the XRD pattern of CeO2
demon-strated peaks at 28.59!, 33.03!, 47.31! and 56.03!, assigned to [11 1], [2 00], [220] and [31 1] crystalline planes, respectively, indicating a face-centered cubic of CeO2(Fig. 3). Sharp XRD peaks
were observed for MoO2 at 26.1!, 37.1!, 53.6! and 60.1!,
corre-sponding respectively to the [0 1 1], [2 11], [0 2 2] and [0 31] lattice planes of the monoclinic MoO2crystal, suggesting a greater
crys-tallinity than that of CeO2. The XRD peaks of TiO2 demonstrated
the main characteristic peaks of a mixed phase of the anatase phase (A) at a 2h of 25.65!, 37.60!, 48.38!, 54.23!, and 55.65! and the rutile phase (R) at a 2h of 27.51! and 62.26!, corresponding to the A[10 1], A[0 04], A[200], A[105], A[21 1], R[11 0], and R [0 02] planes, respectively. The particle sizes, calculated by the Scherrer equation, of CeO2, MoO2 and TiO2 were 44.21, 41.61,
and 11.59 nm, respectively.
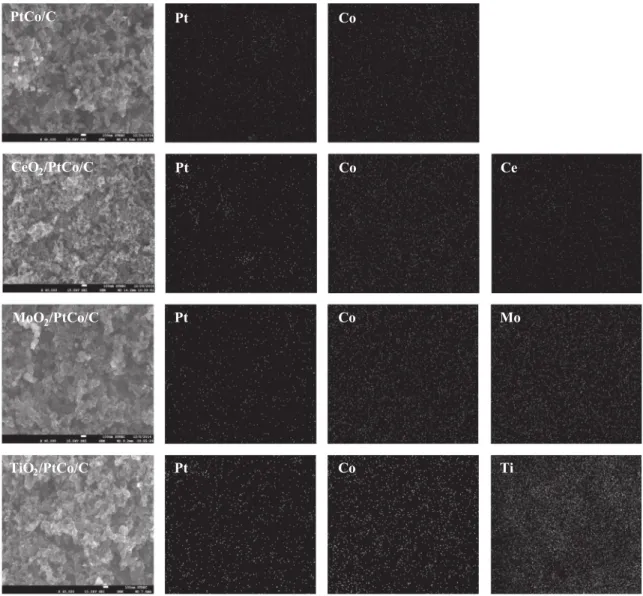
When all metal oxides were incorporated on PtCo/C catalyst surface, they distributed uniformly along the catalyst surface (Fig. 4) and had an insignificant effect on either crystalline size or d-spacing of the catalysts as well as the weight ratio of Pt:Co (1:1). The crystalline size or d-spacing of the PtCo/C and MO2/
PtCo/C catalysts were still between 0.222–0.225 nm and 7.41– 7.67 nm, respectively (Data not shown).
The ESA was then determined from the H2 desorption
peak, obtained from the CV experiment carried out in the poten-tials range of #0.35 to 1.2 V/SCE, 20 mV/s scan rate under N2
CeO
2MoO
2TiO
2atmosphere. As demonstrated in Fig. 5, the presence of CeO2
affected negatively the ESA of the PtCo/C catalyst. Namely, the ESA was reduced almost 50% in the presence of CeO2at all
investi-gated loadings in the range of 0.03–0.45 mg/cm2. In addition, the
presence of MoO2 at any loadings in the range of 0.03–0.45 mg/
cm2affected negatively the PtCo/C catalyst ESA. More amount of
MoO2loading led to the decreasing catalyst ESA. The decreasing
ESA with increasing CeO2and MoO2loading is probably attributed
to their large particle size compared with that of the PtCo/C, which could decrease an available Pt active site to precede the reaction. Interestingly, the addition of TiO2on the layer of PtCo/C catalysts
gave both positive and negative influences on their ESA. Increasing the TiO2from 0.03 to 0.06 mg/cm2gave an increasing ESA. Then,
greater than 0.15 mg/cm2of TiO
2content led to decreasing ESA.
The augmentation of ESA at low TiO2 content could be involved
to the growth of electrode roughness. However, over content of TiO2, especially more than 0.30 mg/cm2, might induce the blockage
of active catalyst surface as well as the disconnection of the electron-conducting network through the catalyst layer, resulting of a decreasing ESA.
With regard to the effect of metal oxides on the conductivity of the catalyst, the result showed that the incorporation of metal oxi-des at all loadings in the range of 0.03–0.45 mg/cm2 led to an
increase of ICR of catalyst layer (Fig. 6). In other words, the conduc-tivity of catalyst decreased with the increase of metal oxide load-ing. This is because the oxygen molecule on the metal oxide structure can reduce the electron mobility along a carbon surface and other elements [29]. Among all MO2/PtCo/C catalysts, the
TiO2/PtCo/C catalyst exhibited the lowest ICR, probably due to
the fact that TiO2 can form a more percolating
electron-conducting network in the catalyst layer than that of CeO2and
20 30 40 50 60 70 80 Intensity (a.u.) CeO2 MoO2 [111] [200] [222] [311] TiO2 A[101] R[110] A[004] [011] [211] [022] [031] A[200] R[002] A[105] A[211] 2 Theta (degree)
Fig. 3. XRD pattern of all utilized commercial metal oxides.
PtCo/C
Pt
Co
CeO
2/PtCo/C
Pt
Co
Ce
MoO
2/PtCo/C
Pt
Co
Mo
TiO
2/PtCo/C
Pt
Co
Ti
MoO2. The conductivity of CeO2, MoO2and TiO2were measured at
25 !C as 0.071, 0.167, and 9.432 S/m, respectively.
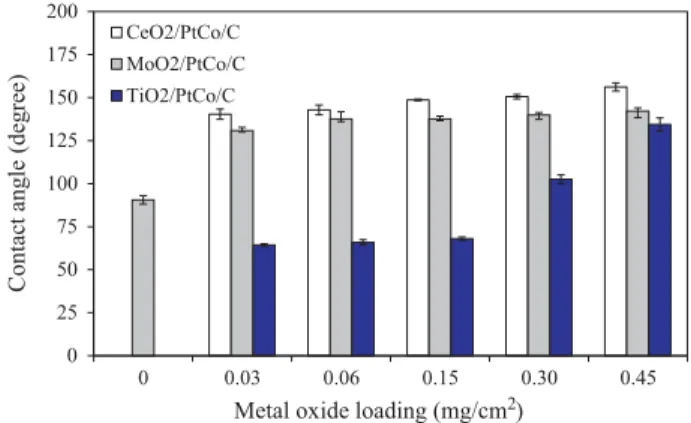
The influence of MO2on the hydrophilic/hydrophobic
proper-ties of the PtCo/C catalyst was then analyzed in terms of water con-tact angle. Theoretically, the material having a concon-tact angle greater than 150! exhibits the superhydrophobic property, while the material having a contact angle between 65! and 150! demon-strates the hydrophobic property. The hydrophilic material usually has a contact angle between 0! and 65!, and the superhydrophilic material exhibits a contact angle of around 0! [30]. As demon-strated inFig. 7, the original PtCo/C catalyst had a contact angle of 90.6!, exhibiting the hydrophobic property. The incorporation of both CeO2and MoO2on the PtCo/C catalyst layer induced an
increase of the contact angle of such a catalyst, suggesting an increase of hydrophobic properties of the PtCo/C catalyst. Increas-ing the CeO2and MoO2 loading in the catalyst surface led to an
increase of hydrophobic properties of the catalyst. For the TiO2/
PtCo/C catalyst, it exhibited the hydrophilic property at low TiO2
loading (0.03–0.15 mg/cm2) and hydrophobic property at high
TiO2 loading (0.30–0.45 mg/cm2). Theoretically, the TiO2has the
hydrophilic properties [31]. Thus, the PtCo/C catalyst exhibited the hydrophilic property at low TiO2content. However, in the
pres-ence of high TiO2 content, the PtCo/C catalyst exhibited the
hydrophobic property; this is probably due to the effect of its high roughness. As mentioned previously, the hydrophobic property of TiO2 increases as the increase of TiO2 layer roughness [32,33],
which is usually found in the presence of thick TiO2layer. In this
work, different loadings of TiO2were loaded on identical area of
catalyst layer, thus the thickness of TiO2increased as the increase
of TiO2, which is consequently induced an increase of surface
roughness as well as the hydrophobic property of catalyst layer.
3.2. ORR activity of MO2/PtCo/C catalysts
The ORR activity of MO2/PtCo/C catalysts was first analyzed in
H2SO4solution saturated by oxygen. The operating condition was
at RDE rates of 500–2000 rpm, potential range of #0.05 to 0.65 V and 10 mV/s of scan rate. Fig. 8(a) showed the same pattern of the current density–potential curve for all MO2/PtCo/C catalysts.
From this pattern, it can be explained in three parts as kinetic con-trol region, mixed concon-trol region and mass transfer region. The first region was observed during the potential of 0.65–0.45 V where mass transfer and rotation (
x
) rates had not affect the current den-sity. The second region appeared at 0.45–0.30 V. The current was uncompletely controlled by electron and mass transfers. The current increased with increasing of rotating rate in nonlinear function of square root of rotation rate (x
1/2). The last region 0 20 40 60 80 PtCo/C 0.03 0.06 0.15 0.30 0.45 E S A ( m 2/g Pt)Metal oxide loading (mg/cm2)
CeO2/PtCo/C MoO2/PtCo/C TiO2/PtCo/C
Fig. 5. ESA of PtCo/C catalysts with and without metal oxides loading.
0.000 0.002 0.004 0.006 0.008 0.010 0.012 0.014 0.00 0.03 0.06 0.15 0.30 0.45 ICR (Ohm)
Metal oxide loading (mg/cm2)
CeO2/PtCo/C MoO2/PtCo/C TiO2/PtCo/C
Fig. 6. Internal contact resistance (ICR) of PtCo/C catalysts with and without metal oxides loading. 0 25 50 75 100 125 150 175 200 0 0.03 0.06 0.15 0.30 0.45 Contac t ang le (de g re e)
Metal oxide loading (mg/cm2) CeO2/PtCo/C
MoO2/PtCo/C TiO2/PtCo/C
Fig. 7. Contact angle of PtCo/C catalysts with and without of metal oxides loading.
-20 -15 -10 -5 0 0.0 0.1 0.2 0.3 0.4 0.5 0.6 0.7 0.8 Curre nt density (mA/cm 2) Potential (V) 0 2 4 6 8 10 12 PtCo/C 0.03 0.06 0.15 0.30 0.45 K in et ic c u rr ent d en si ty ( m A /c m 2)
Metal oxide loading (mg/cm2)
y = 1.0515x + 0.1242 0.15 0.20 0.25 0.30 0.06 0.08 0.10 0.12 0.14 0.16 1 /| j| ( cm 2/m A ) 1/ω0.5(s-0.5) 500 rpm 1,000 rpm 1,500 rpm 2,000 rpm
(a)
(b)
CeO2/PtCo/C MoO2/PtCo/C TiO2/PtCo/CFig. 8. (a) Voltammogram for the ORR of TiO2/PtCo/C catalyst (at loading of
0.06 mg/cm2) and (b) kinetic current of MO
2/PtCo/C catalysts at different metal
oxide loadings in H2SO4solution saturated with O2at 0.385 V with 10 mV/s of scan
appeared at 0.3–0.05 V, showed a plateau of limiting current that increased linearly with square root of rotation rate (
x
1/2)[24].The current density was as a first order function of the rotating rate expressing by the Koutecky–Levich equation, which is valid for the diffusion species as demonstrated by[34]:
1 j¼
1 jk
þB
x
11=2 ð1Þand where B is determined by Eq.(2),
B ¼ 0:62neFD2=3
m
#1=6C ð2ÞThe function of j#1vs.
x
#1/2at particular potentials (the insertof Fig. 8(a)) provided straight lines, allowing the calculation of the kinetic current density (jk) from intercept and number of
elec-trons involved in the ORR reaction from slope. The summary of kinetic plot of all MO2/PtCo/C catalysts at different metal oxide
loadings is shown inFig. 8(b). The kinetic current density, or jk,
was found to depend on the loading of metal oxide.
The MO2/PtCo/C catalysts in the presence of either CeO2 or
MoO2 at all loadings in the range of 0.03–0.45 mg/cm2 exhibited
ORR activity less than that of the PtCo/C catalysts, probably because of their low ESA, high ICR as well as their hydrophobic property. The presence of TiO2at appropriate loading (0.06 mg/cm2) can promote
an increase of ORR activity of the PtCo/C catalyst, which might be attributed to their high ESA, low ICR and appropriate hydrophobic/ hydrophilic properties.
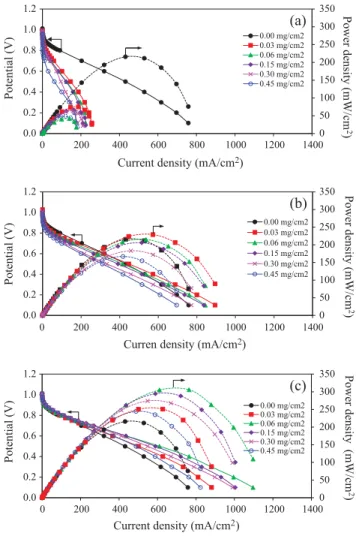
To obtain the actual ORR activity of all prepared catalysts, all catalysts were analyzed in a PEM fuel cell using H2/O2 gases at
60 !C at atmospheric pressure. The inclusion of MO2in the PtCo/
C catalyst layer affected insignificantly the OCP (Fig. 9). The pres-ence of CeO2or MoO2affected negatively the performance of the
PtCo/C catalyst at low current density, which could be ascribed to their low active surface area. The addition of TiO2 onto the
PtCo/C catalyst surface had not affect the performance of the cata-lyst under this region. The performance loss of the MO2/PtCo/C
cat-alyst was more pronounced at ohmic region, which was initiated by the sluggishness of electron transfer through the electrodes and the sluggishness of protons (H+) flowing through the
mem-brane. The addition of CeO2 and MoO2at all loadings influenced
negatively the current density at 0.6 V as displayed in Fig. 10, due to their high ICR as well as their hydrophobic property of the catalyst layer. From the plot, the water contact angles of CeO2/
PtCo/C and MoO2/PtCo/C were close to 150!, indicating extremely
high hydrophobicity of the catalyst layer, and their hydrophobicity increased with the increase of CeO2and MoO2loading. This
behav-ior caused the rapid water removal from the catalyst layer and membrane, resulting in the loss of proton conductivity, which con-sequently deteriorated the cell performance.
For the TiO2/PtCo/C catalyst, incorporation of TiO2at low
load-ing between 0.03 and 0.06 mg/cm2induced an increase of current
at 0.6 V of the fuel cell. This is because low TiO2content can
ame-liorate the hydrophilic property of the catalyst electrode to obstruct its fast dry out, which is confirmed obviously by their
0 50 100 150 200 250 300 350 0.0 0.2 0.4 0.6 0.8 1.0 1.2 0 200 400 600 800 1000 1200 1400 Powe r de nsity (mW/cm 2 ) Potential (V)
Current density (mA/cm2)
0.00 mg/cm2 0.03 mg/cm2 0.06 mg/cm2 0.15 mg/cm2 0.30 mg/cm2 0.45 mg/cm2 0 50 100 150 200 250 300 350 0.0 0.2 0.4 0.6 0.8 1.0 1.2 0 200 400 600 800 1000 1200 1400 Power de nsity (mW/cm 2 ) Potential (V)
Curren density (mA/cm2)
0.00 mg/cm2 0.03 mg/cm2 0.06 mg/cm2 0.15 mg/cm2 0.30 mg/cm2 0.45 mg/cm2 0 50 100 150 200 250 300 350 0.0 0.2 0.4 0.6 0.8 1.0 1.2 0 200 400 600 800 1000 1200 1400 Powe r de nsity (mW /cm 2 ) Potential (V)
Current density (mA/cm2)
0.00 mg/cm2 0.03 mg/cm2 0.06 mg/cm2 0.15 mg/cm2 0.30 mg/cm2 0.45 mg/cm2
(a)
(b)
(c)
Fig. 9. Polarization curve of PtCo/C catalyst with different loadings of (a) CeO2(b)
MoO2and (c) TiO2in PEM fuel cell under H2/O2environment at 60 !C and ambient
pressure. 0.000 0.002 0.004 0.006 0.008 0.010 0.012 0.014 0 100 200 300 400 0 0.1 0.2 0.3 0.4 0.5 ICR (ohm) C u rr en t d en si ty a t 0 .6 V ( m A /c m 2) C o n ta ct a n g le ( d eg re e) MoO2 loading (mg/cm2) Contact angle Current density ICR 0.000 0.002 0.004 0.006 0.008 0.010 0.012 0.014 0 100 200 300 400 0 0.1 0.2 0.3 0.4 0.5 ICR (ohm) C u rr en t d en si ty a t 0 .6 V ( m A /c m 2) C o n ta ct a n g le ( d eg re e) TiO2 loading (mg/cm2) Contact angle Current density ICR 0.000 0.002 0.004 0.006 0.008 0.010 0.012 0.014 0 100 200 300 400 0 0.1 0.2 0.3 0.4 0.5 ICR (Ohm) C u rr en t d en si ty a t 0 .6 V ( m A /c m 2) C o n ta ct a n g le ( d eg re e) CeO2 loading (mg/cm2) Contact angle Current density ICR
(b)
(c)
(a)
Fig. 10. Current density at 0.6 V, contact angle and ICR of PtCo/C catalyst with different loadings of (a) CeO2(b) MoO2and (c) TiO2.
low value of water contact angle. Otherwise, the loading of TiO2
greater than 0.15 mg/cm2induced a significant decreased fuel cell
performance, probably due to a high mass transport limitation. Namely, an excess amount of TiO2particles could adsorb an
enor-mous quantity of water and consequently block the fuel/oxidant to react at catalyst site. One more possible reason, oxygen molecules could be adsorbed by TiO2. It could capture electrons and donor O2#
and also decrease dark conductivity[35,36]. So, the electrical con-ductivity was reduced 1.09- to 1.59-fold by the presence of 0.03– 0.45 mg/cm2TiO
2on PtCo/C catalyst. The cell performances were
1.14- to 1.36-fold more than that of the PtCo/C catalyst at 0.6 V. This is an effect of the hydrophilic property of TiO2[24].
3.3. Stability of MO2/PtCo/C catalyst
The stability of all MO2/PtCo/C catalysts was finally monitored
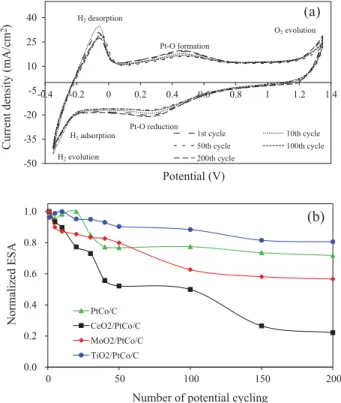
by the change of ESA during the repetitive potential cycling exper-iment of these catalysts in N2-saturated 0.5 M H2SO4. The example
cyclic voltammogram of MO2/PtCo/C catalysts was exhibits in
Fig. 11(a). The similar pattern of cyclic voltammogram of all as-prepared catalyst was observed. Namely, the H2adsorption peak
appeared as a broad shoulder, not in a sharp peak, probably due to the partial overlapping with the oxygen atom reduction peaks (Pt–O reduction). The H2desorption peak appeared as a clear sharp
peak. Increasing the potential cycling to the 10th cycle resulted in the increase of peak intensity because of the humid Nafion mem-brane coating the catalyst [37]. Further increasing the repetitive potential cycling led to the decrease of peak intensity, indicating the decrease of ESA of the catalyst. As summarized inFig. 11(b), the loss of normalized ESA of catalysts after 200 cycles was observed as the order of CeO2/PtCo/C > MoO2/PtCo/C > PtCo/C >
TiO2/PtCo/C. Approximately 78%, 43%, 28% and 20% were observed
for CeO2/PtCo/C, MoO2/PtCo/C, PtCo/C and TiO2/PtCo/C,
respec-tively. This suggests that the TiO2/PtCo/C catalyst had the most
stability compared with the other catalysts. This is probably due
to a strong resistance of TiO2in acid media. According to the results
of corrosion test as demonstrated inFig. 12, the magnitude of cor-rosion current density was changed as the order of CeO2/PtCo/
C > MoO2/PtCo/C > PtCo/C > TiO2/PtCo/C as 14.17, 9.37, 6.71 and
5.68 mA/cm2, respectively. This confirms that the TiO 2/PtCo/C
exhibited the highest corrosion resistance compared to other MO2/PtCo/C catalysts.
4. Conclusion
Three types of metal oxides, including CeO2, MoO2 and TiO2,
were incorporated as the interlayer of PtCo/C catalysts at different loadings. The results demonstrated that incorporation of those metal oxides had insignificant effect on either crystalline size or d-spacing of the PtCo/C catalyst. However, they have a significant effect on the ESA and ICR. Addition of CeO2and MoO2affected
neg-atively the ESA and ICR as well as the hydrophilic/hydrophobic properties of the PtCo/C catalyst. The addition, TiO2at appropriate
loading can enhance an increase of ESA as well as the decrease of ICR of the PtCo/C catalyst. Moreover, it can assist to manage the water in the catalyst layer. The PtCo/C catalyst with TiO2of 0.06–
0.15 mg/cm2can produce a maximum power density of 305 mW/
cm2with a loss of around 20% of ESA after the repetitive potential
cycling of 200 cycles. Acknowledgments
The authors would like to thank the Royal Golden Jubilee Ph.D. Program of the Thailand Research Fund (Grant No. PHD/0338/2552) and the Embassy of France in Thailand for finan-cial support.
References
[1]Uribe-Godínez J, García-Montalvo V, Jiménez-Sandoval O. Development of Ir-based and Rh-Ir-based catalyst electrodes for PEM fuel cell applications. Int J Hydrogen Energy 2013;18:7680–3.
[2] Little AD, Inc. Cost analysis of fuel cell system for transportation: baseline system cost estimate. Cambridge: Department of Energy Final Report; 2000 [cited October 19, 2015]. Available on-line: <http://www.ott.doe.gov/pdfs/ baseline_cost_model.pdf>.
[3]Zhong H, Zhang H, Liang Y, Zhang J, Wang M, Wang X. A novel non-noble electrocatalyst for oxygen reduction in proton exchange membrane fuel cells. J Power Sources 2007;164(2):572–7.
[4]Charreteur F, Jaoeun F, Ruggeri S, Dodelet J. Fe/N/C nonprecious metal catalysts for PEM fuel cells: influence of the structural parameters of pristine commercial carbon blacks on their activity for oxygen reduction. Electrochim Acta 2008;53:2925–38.
[5]Lefevre M, Proietti E, Jaouen F, Dodelet J-P. Iron-based catalysts with improved oxygen reduction activity in polymer electrolyte fuel cells. Science 2009;324:71–4. -50 -35 -20 -5 10 25 40 -0.4 -0.2 0 0.2 0.4 0.6 0.8 1 1.2 1.4
Current density (mA/cm
2) Potential (V) 1st cycle 10th cycle 50th cycle 100th cycle 200th cycle 0.0 0.2 0.4 0.6 0.8 1.0 0 50 100 150 200 Normalized ESA
Number of potential cycling
PtCo/C CeO2/PtCo/C MoO2/PtCo/C TiO2/PtCo/C
(a)
H2desorption Pt-O formation O2evolution H2adsorption Pt-O reduction H2evolution(b)
Fig. 11. (a) Cyclic voltammogram of TiO2/PtCo/C catalyst versus numbers of
repeated potential cycling in H2SO4solution at 20 mV/s of scan rate and (b)
variation of normalized ESA.
0.1 1.0 10.0 100.0 1000.0 -0.60 -0.50 -0.40 -0.30 -0.20 -0.10 0.00 0.10 C u rr en t d en si ty ( m A /c m 2) Potential (V) PtCo/C CeO2/PtCo/C MoO2/PtCo/C TiO2/PtCo/C
Fig. 12. Potentiodynamic polarization for corrosion of PtCo/C and MO2/PtCo/C
[6]Hernández-Hernández HM, Olivares-Ramírez JM, Jiménez-Sandoval O. Performance of novel bimetallic carbonyl clusters as PEM fuel cell anodes, a comparative study. Int J Hydrogen Energy 2013;38:7674–9.
[7]Samaneh Sh, Jean H. Improved carbon nanostructures as a novel catalyst support in the cathode side of PEMFC: a critical review. Carbon 2015;94:705–28.
[8]Samaneh Sh, Jean H. The effect of low platinum loading on the efficiency of PEMFC’s electrocatalysts supported on TiO2–Nb, and SnO2–Nb: an
experimental comparison between active and stable conditions. Energy Convers Manage 2015;103:681–90.
[9]Bhlapibul S, Pruksathorn K, Piumsomboon P. The effect of the stabilizer on the properties of a synthetic Nicore–Ptshellcatalyst for PEM fuel cells. Renew Energy
2012;41:262–6.
[10]Calderón JC, Mahata N, Pereira MFR, Figueiredo JL, Fernandes VR, Rangel CM, et al. Pt–Ru catalysts supported on carbon xerogels for PEM fuel cells. Int J Hydrogen Energy 2012;37:7200–11.
[11]Seifitokaldani A, Savadogo O. Electrochemically stable titanium oxy-nitride support for platinum electro-catalyst for PEM fuel cell applications. Electrochim Acta 2015;167:237–45.
[12]Quan X, Mei Y, Xu H, Sun B, Zhang X. Optimization of Pt–Pd alloy catalyst and supporting materials for oxygen reduction in air-cathode microbial fuel cells. Electrochim Acta 2015;165:72–7.
[13]Senevirathne K, Neburchilov V, Alzate V, Baker R, Neagu R, Zhang J, et al. Nb-doped TiO2/carbon composite supports synthesized by ultrasonic spray
pyrolysis for proton exchange membrane (PEM) fuel cell catalysts. J Power Sources 2012;220:1–9.
[14]Zamani P, Higgins D, Hassan F, Jiang G, Wu J, Abureden S, et al. Electrospun iron–polyaniline–polyacrylonitrile derived nanofibers as non-precious oxygen reduction reaction catalysts for PEM fuel cells. Electrochim Acta 2014;139:111–6.
[15]Xu M, Li C, Ren H, Ding L, Xu K, Geng J. Carbon-supported Co-phthalocyanine modified with pyridine, 2-acid pyridine and 2-methyl pyridine as novel cathode catalysts for alkaline PEM fuel cells. J Mol Cat A – Chem 2014;390:69–75.
[16]Bing Y, Liu H, Zhang L, Ghosh D, Zhang J. Nanostructured Pt-alloy electrocatalysts for PEM fuel cell oxygen reduction reaction. Chem Soc Rev 2010;39:2184–202.
[17]Antolini E, Salgado JRC, Gozalez ER. The stability of Pt–M (M = first row transition metal) alloy catalysts and its effect on the activity in low temperature fuel cells: a literature review and tests on a Pt–Co catalyst. J Power Sources 2006;160:957–68.
[18]Ohyagi Sh, Sasaki T. Durability of a PEMFC Pt–Co cathode catalyst layer during voltage cycling tests under supersaturated humidity conditions. Electrochim Acta 2013;102:336–41.
[19]Yuan XZ, Li H, Zhang S, Martin J, Wang H. A review of polymer electrolyte membrane fuel cell durability test protocols. J Power Sources 2011;196:9107–16.
[20]Avcioglu GS, Ficicilar B, Bayrakceken A, Eroglu I. High performance PEM fuel cell catalyst layers with hydrophobic channels. Int J Hydrogen Energy 2015;40:7720–31.
[21]Blanco M, Wilkinson DP, Wang H. Application of water barrier layers in a proton exchange membrane fuel cell for improved water management at low humidity conditions. Int J Hydrogen Energy 2011;36:3635–48.
[22]Wang Y, Wang L, Advani SG, Prasad AK. Double-layer gas diffusion media for improved water management in polymer electrolyte membrane fuel cells. J Power Sources 2015;292:39–48.
[23]Kitahara T, Nakajima H, Okamura K. Gas diffusion layers coated with a microporous layer containing hydrophilic carbon nanotubes for performance enhancement of polymer electrolyte fuel cells under both low and high humidity conditions. J Power Sources 2015;283:115–24.
[24]Chaisubanan N, Pruksathorn K, Vergnes H, Hunsom M. Effect of the TiO2phase
and loading on oxygen reduction reaction activity of PtCo/C catalysts in proton exchange membrane fuel cells. Kor. J Chem Eng 2015;32:1305–13. [25]Fugane K, Toshiyuki M, Ding RO, Suzuki A, Yoshikawa H, Masuda T, et al.
Activity of oxygen reduction reaction on small amount of amorphous CeOx
promoted Pt cathode for fuel cell application. Electrochim Acta 2011;56:3874–83.
[26]Litster S, McLean G. PEM fuel cell electrodes: review. J Power Source 2004;130:61–76.
[27]Rico-Pérez V, Bueno-López A. Effect of RhOx/CeO2 calcination on
metal-support interaction and catalytic activity for N2O decomposition. Appl Sci
2014;4:468–81.
[28]Leelaruji L, Hunsom M. Alcohol reduction-mediated preparation of a nano-scale Pt/C electrocatalyst for the oxygen reduction reaction in PEM fuel cells. Renew Energy 2010;35:2422–30.
[29]Pandolfo AG, Hollenkamp AF. Carbon properties and their role in supercapacitors. J Power Sources 2006;157:11–27.
[30]Bracco G, Holst B, editors. Surface science techniques, springer series in surface sciences. Berlin, Heidelberg: Springer-Verlag; 2013.
[31]Vuk AŠ, Boris Orel RJ, Drazˇi G. The effect of surface hydroxyl groups on the adsorption properties of nanocrystalline TiO2 films. In J Photoenerg
2005;7:163–8.
[32]Kim HM, Seo SB, Kim DY, Bae K, Sohn SY. Enhanced hydrophilic property of TiO2thin film deposited on glass etched with O2 plasma. TEEM 2013;14
(3):152–5.
[33]Buranawong A, Witit-anun N, Chaiyakun S. Total pressure and annealing temperature effects on structure and photo-induce hydrophilicity of reactive DC sputtered TiO2thin films. Eng J 2012;16:79–89.
[34]Bard AJ, Faulkner LR. Electrochemical methods: fundamentals and applications. 2nd ed. New York: John Wiley & Sons; 2000.
[35]Eppler AM, Ballard IM, Nelson J. Charge transport in porous nanocrystalline titanium dioxide. Physica E 2002;14:197–202.
[36]Pomoni K, Sofianou MV, Georgakopoulos T, Boukos N, Trapalis C. Electrical conductivity studies of anatase TiO2with dominant highly reactive 00 1 facets.
J Alloys Comp 2013;548:194–200.
[37]Colón-Mercado HR, Kim H, Popov BN. Durability study of Pt3Ni1catalysts as