1
Effect of Geometric Parameters on the Behavior of Bolted
1
GFRP Pultruded Plates
2
Thérèse A. D. Tajeuna1*, Frédéric Légeron2, Sébastien Langlois3, 3
Pierre Labossière4 and Marc Demers5. 4
1
Ph.D Student 5
Department of Civil Engineering 6
Université de Sherbrooke, Sherbrooke, Quebec, Canada, J1K 2R1 7
E-mail: therese.tajeuna@USherbrooke.ca 8
2
Bridge and Tunnel UAE District Manager 9 Parsons Corporation 10 E-mail: Frederic.legeron@parsons.com 11 3 Assistant Professor 12
Department of Civil Engineering 13
Université de Sherbrooke, Sherbrooke, Quebec, Canada J1K 2R1 14 E-mail: Sebastien.Langlois@USherbrooke.ca 15 4 Professor 16
Department of Civil Engineering 17
Université de Sherbrooke, Sherbrooke, Quebec, Canada J1K 2R1 18 E-mail: Pierre.labossière@USherbrooke.ca 19 5 Research Engineer 20
Department of Civil Engineering 21
Université de Sherbrooke, Sherbrooke, Quebec, Canada J1K 2R1 22
E-mail: Marc.Demers@USherbrooke.ca 23
24 *
Author to whom all correspondence should be addressed 25
26 27
Paper to be submitted to the Journal of Composites Materials (SAGE)
28 29
2
ABSTRACT
30
This paper presents the effect of geometric parameters on the behavior of bolted GFRP 31
pultruded plates for civil engineering applications. After a literature review, results of an 32
experimental analysis investigating the behavior of GFRP-to-steel single-lap bolted 33
connections are presented. Then, a finite element analysis validated by experimental data is 34
used to evaluate the effects of the end-distance, side-distance, gage, pitch and plate 35
properties on the strength and failure mode of the connection. A critical examination of 36
geometric recommendations proposed in design references is presented. Bearing failure 37
caused by contact of the bolt on the GFRP plate is usually defined as the preferred failure 38
mode. With highly orthotropic plate, this type of failure was found to be less likely to occur 39
when loading is applied in the pultruded direction. The investigation showed that the 40
minimum end-distance and pitch-distance recommended by design references usually 41
produce a connection with the maximum capacity. However, it was found that the 42
minimum side-distance recommended by these references does not necessarily lead to the 43
maximum capacity for one-bolt and for two-bolt in a column connections. 44
Keywords: Connection, bolt, pultruded GFRP, single-lap, FE analysis, failure mode,
45
geometric parameters. 46
. 47
3
Introduction
48
This study was initiated in the context of developing a high-strength and low-weight emergency 49
repair solution for damaged railway structures. The use of Glass Fibre Reinforced Polymer 50
(GFRP) pultruded plates was a promising option for this situation, their light weight making 51
them easy to carry on site. Bolting GFRP plates to steel was viewed as a practical way of 52
providing temporary repair work that could also be easy disassemble in the future. In addition, 53
high strength, corrosion resistance, and low maintenance cost would be added benefits if the 54
repair work had to stay in place for an extended period. 55
The main objective of this paper is to provide basic information on the static behavior of 56
bolted joints between GFRP and steel in bridges and other civil engineering structures, to 57
critically examine the geometric recommendations proposed in design references, and to identify 58
optimum geometrical parameters to guarantee the high strength of such connections. In the first 59
part of this paper, a literature review on the connection of GFRP plates is presented. In the 60
second part of the paper, the data presented are complemented by an experimental study of 61
GFRP-to-steel bolted connections performed by the authors. These results are compared to 62
predictions according to a design reference. In the third part of the paper, a finite element (FE) 63
analysis, validated by the experimental results, is used to study how the geometrical parameters 64
of the connection are affecting its strength. In conclusion, optimum geometric parameters beyond 65
which no further increase of the connection strength is observed are identified. 66
Literature review
67
GFRP pultruded plates are made of E-glass fibres and resin. The pultruded plates are typically a 68
combination of Continuous Strand Roving (CSR) and Continuous Strand Mat (CSM). The 69
roving provides strength in the longitudinal (pultrusion) direction while the mat provides multi-70
4
directional strength. CSM is considered to be isotropic since it contains chopped glass fibres that 71
are randomly oriented in the plane of the mat. The CSR is highly orthotropic and has higher 72
strength than CSM in the longitudinal direction. Therefore, the elastic properties of the plate 73
would depend on the proportion of these two constituents. 74
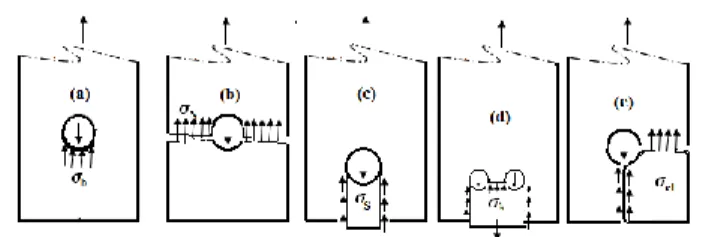
When connecting GFRP plates with bolts, the basic failure modes shown in Figure 1 can be 75
observed. They are similar to those observed for steel plate connections. Bearing of the bolt 76
produces either crushing in the loading direction (Figure 1a), tension failure through the net-77
section (Figure 1b) or shear tear-out characterized by two parallel failure paths extending from 78
the bolt-hole to the plate end in the loading direction (Figures 1c and 1d). Another failure mode 79
for FRP pultruded plates is cleavage (Figure 1e), which is characterized by a single fracture line 80
extending from the bolt-hole to the end of the plate. Additional cracks in the net-section may also 81
appear. Failure by crushing is usually ductile and is therefore preferred to the other modes, which 82
are usually brittle. 83
The occurrence of the above failure modes depends on the geometrical parameters shown in 84
Figure 2. These include the number of shear planes (x), the end-distance (e), the side-distance (s), 85
the width (w), the pitch-distance (p) the gage-distance (g), the plate thickness (t), the bolt-hole 86
diameter (dh), the bolt diameter (d), the number of bolts in the row (n), the number of bolts in the
87
column (m) and the total number of bolt in the connection (N). In a one-bolt or one-column bolts, 88
s is equivalent to 0.5w. Recommended values for these geometric parameters can be found in
89
design references such as: ASCE Pre-standard [1], EUROCOMP [2] and CNR-DT 205/2007 [3]. 90
Manufacturers such as Strongwell [4], Fiberline Composites [5], and Creative Pultrusion [6] also 91
provide design manuals specific to the use of their products. Table 1 summarizes minimum 92
geometric recommendations for e, s, p and g. These recommendations slightly differ from one 93
design reference to another. For example, FRP design standard [1] recommends a minimum 94
5
p/d=4 while EUROCOMP [2] design manual requires this ratio to be at least 3. ASCE
Pre-95
standard [1] recommends the maximum spacing of consecutive bolts in rows or columns (p and 96
g) to be 12 times the minimum thickness of FRP material. However, it does not provide
97
recommendations for the edge distances (e and s). Other references do not specify the maximum 98
values. Equations to calculate the connection strength corresponding to the failure modes 99
mentioned above can also be found in these design references. 100
Numerous studies of mechanically fastened joints in composite material have been reported in 101
the literature. Most have been conducted for the benefit of aeronautical and automotive industry. 102
An extensive review of several of these publications extending from 1978 to 2007 can be found 103
in Thoppul et al. [8]. For civil engineering application, Mottram and Turvey [9], present a review 104
of publication extending from 1980 to 2001 with regard to the appraisal of existing connections 105
design procedure for plate-to-plate bolted joints in pultruded FRP structural shapes and systems. 106
Girao and Mottram [10] recently reported similar work. In addition to the review of the plate-to-107
plate bolted joint, [10] also addressed the design procedure of beam-to-column bolted joint. 108
However, this review does not include special topic of environmental effects. A reference and 109
bibliography database on research and development with pultruded FRP shapes and system can 110
be found in [11]. Most connections reported were tested with one bolt [12-33]. A few 111
experimental results with multi-bolt connections can also be found [34-40]. Specimens were 112
mostly loaded in double-lap configuration while few were loaded in single-lap configuration [19, 113
29, 30]. Figure 2(a) presents the geometric parameters as they are defined in this paper and the 114
typical case of single-lap and double-lap configurations. Single-lap connection differs from 115
double-lap configuration in that: double-lap configuration is to some extent symmetric with 116
respect to the center of the inner plate while single-lap configuration is symmetric. This non-117
symmetry causes the inclination of the bolt in the bolt-hole during loading. Because of this 118
6
inclination, the bolt contact pressure in the bolt-hole becomes non-uniform through the plate 119
thickness, leading to the out-of-plane deformation of the plate. The present study is limited to 120
bolted connections of Glass Fibre Reinforced Polymer (GFRP) pultruded plates in the context of 121
civil engineering applications. The following literature review focuses on to publications that 122
bring an insight on the effect of geometric parameters as e/d, s/d, g/d or p/d on the connections 123
strength of pultruded GFRP plates with tension loading parallel to the pultruded direction. The 124
test results of Rosner and Rizkalla [13] on one-bolt connections suggest that connection strength 125
and failure mode could be improved by increasing w/dh and e/dh ratios up to a limiting value of
126
5. At this ratio, bearing failure by crushing was the observed mode. Experimental results of 127
Cooper and Turvey [15] reveal that the critical ratio at which bearing failure is observed depends 128
on the clamping of the plates. These critical ratios were found to be e/d=5 and w/d=6 for lightly 129
torqued and e/d=6.5 and w/d=10 for fully torqued connections. Experimental results of 130
Ramaskrishna et al. [17] reveal that increasing w/d from 3 to 7 and keeping e/d=2 has no 131
significant effect on the strength as shear associated to bearing controls the failure load. Study 132
reported by Wang [23] on a 3.2 mm thick GFRP pultruded plate loaded in pin bearing condition 133
reveal bearing failure for values of w/d=4 and e/d=1.5. The results also show no increase in the 134
joint capacity for values of e/d˃3. From his experimental results performed in single-lap one-bolt 135
joint, Turvey [29] observed a threshold value of e/d=3 above which the average ultimate load 136
and strength remain constant for any value of w/d. Below this threshold value, the average 137
ultimate load increases with e/d and w/d. The author state that because of the effect of bending 138
within the joint, failure modes of the single-lap joints tend to be more complicated than 139
symmetric double-lap joints. Based upon the analysis and observation performed in the 140
experimental investigation, Lee et al [33] recommend to maintain if possible w/d=5 and e/d≥3. 141
For multi-bolted connections, Hassan et al. [37] found that the ultimate capacity and the bearing 142
7
strength increased with the ratios of the side-distance-to-pitch (s/p), up to a limiting value of 1.2. 143
Beyond this, no significant increase in the load-carrying capacity was measured. From their 144
finite element analysis performed on multi-column of bolts, Girão Coelho et al. [40] recommend 145
the minimum ratio of g/d=3 and s/d=2.5. In addition to these geometrical parameters, reported 146
studies also provide information on either the influence of pultruded material orientation [13, 19-147
20,-23, 37], the type of fastener [14], washer size [12], hole clearance[16, 27], number of bolts 148
and their arrangement [34, 37], environmental effect [18,21,22,24,25,26,31,39], and degree of 149
orthotropy [12, 34]. Abd-El-Naby and Hollaway [12, 34] show that the failure mode is related to 150
the proportion of CSM and CSR in the plate. Their experimental analysis shows that in plates 151
with higher proportion of CSR than CSM, bearing failure is less likely to occur regardless of the 152
connection length and width. 153
Although other experimental results in multi-bolt connections have been reported, the effect of 154
pitch-distance has not been studied in details. In addition, only few data with single-lap bolted 155
connections have been published. The experimental study on GFRP bolted plates reported in the 156
next section was performed to cover these gaps in data. The investigation was performed on 157
single-lap bolted connections. The results are compared to design strengths calculated using 158
equations available in the ASCE Pre-standard [1]. Then, a FE analysis validated with 159
experimental results is used to investigate the effect of e, s, p and the material properties. The 160
results are used to critically examine the recommendations of design references. 161
Experimental investigation of single-lap bolted connections
162
Overview of the experimental program 163
Connections of GFRP to steel plates with one bolt or two bolts, in single-lap configuration, were 164
tested. GFRP specimens were cut from 6.35 mm thick pultruded plates while steel specimens 165
8
were taken from 6.35 mm thick flat bars. All GFRP pultruded plates were loaded in the 166
longitudinal direction to achieve maximum tensile strength. Connections with one bolt or with 167
two bolts in a column were considered. ASTM A325 bolts with a 12.7 mm diameter and nominal 168
washer were used. Bolts were tightened at finger tight plus one-half-turn of the nut. Two 169
configurations were tested for one bolt connections. The single-lap configuration S20E30 had 170
s/d=2 and e/d=3. With these same parameters, three specimens in double-lap configurations
171
(DS20E30) were also tested to investigate the out-of-plane effect on the damage of the GFRP. 172
The configuration S40E40 had s/d=4 and e/d=4. For two-bolt connections, two configurations 173
were also tested. The geometric parameters considered were s/d=4, e/d=4 and p/d=3 for the 174
configuration S40E40P30; s/d=4, e/d=4 and p/d=5 for the configuration S40E40P50. Three to 175
seven specimens were tested for each configuration for a total 25 tests. 176
Experimental setup and testing of the connections 177
The tests were conducted up to failure of the joint in shear using a 500 kN hydraulic testing 178
machine. As shown in Figure 2(b), the end connections were designed to make the loading axis 179
to coincide with the interface of the two plates so that the bolts were mostly loaded in shear. 180
Specimens were clamped by the grips of the testing machine at both ends. A tensile force was 181
applied at the bottom end while the top end was fixed. The load was applied at the rate of 1 182
mm/min and the load and displacement were recorded by the control system of the testing 183
machine. 184
Tensile tests of the materials 185
The GFRP plates were taken from Extren 500 series panels. Extren 500 is manufactured by 186
Strongwell Corporation. According to the manufacturer, it is made of E-glass fibres and 187
polyester resin. It is typically reinforced with 50% Continuous Strand Roving (CSR) and 188
Continuous Strand Mat (CSM). The roving provides strength in longitudinal (pultrusion) 189
9
direction while the mat provides multi-directional strength properties [4]. Steel specimens were 190
cut from 350W flat bars. 191
Tension tests of GFRP coupons were conducted according to ASTM Standards D3039 192
[41] for longitudinal and transversal tensile strength and ASTM D3518 [42] for in-plane shear 193
strength. For grade 350W steel coupons, ASTM Standard A370 [43] was used. Specimens had 194
uniform width for GFRP and reduced width in the gage length for steel. Strength was measured 195
as specified by the appropriate testing standards. Strain was measured by an axial extensometer. 196
Typical stress-strain curves for steel in tension and GFRP in longitudinal tension, transversal 197
tension and in-plane shear are presented in Figure 3. As it can be observed, GFRP material 198
behaves linearly up to brittle failure. Steel shows an elasto-plastic behaviour. The average 199
measured properties of GFRP coupons are summarized in the first column of Table 2. The 200
properties presented in the other columns of this table are those obtained by other authors and 201
they will be used in the finite element analysis. For steel, the average ultimate tensile strength 202
and average yield strength were approximately 540 MPa and 370 MPa respectively. ASTM 203
A325 bolt was not tested. However, its nominal guaranteed tensile strength is 825 MPa and its 204
nominal shear strength is 495 MPa considering the shear strength equals to 0.6 times the nominal 205
tensile strength [44]. 206
Considering the much higher stiffness of steel compared to GFRP, there was no deformation 207
observed on the steel plates and on the A325 steel bolt until GFRP reached failure. Therefore, the 208
observations given in this section are for GFRP plates only. 209
Failure mode of one-bolt single-lap configurations. Figures 4(a) and 4(b) show the typical 210
failure modes of S20E30 and S40E40 respectively. The failure mode of each tested specimen is 211
presented in Table 3. As it can be observed in this table and these figures, the failure mode was 212
not identical within the same configuration. For configuration S20E30 presented on Figure 4(a), 213
10
the three typical failure modes were net-section, shear and cleavage. As noted in Table 3, 214
cleavage was the predominant mode within the specimens of this configuration. Cleavage failure 215
was also observed on the three specimens with bolt loaded in double-lap configuration 216
(DS20E30). Suggesting that the varieties of failure mode observed in single-lap could be due to 217
the out-of-plane deformation. On the outer face of some single-lap specimens, washer 218
penetration into the top layer was observed. This damage was not seen in double-lap 219
configuration as the bolt eccentricity was restrained. On configuration S40E40 shear failure was 220
the predominant mode while one specimen (S40E40-4) show cleavage failure. These two typical 221
failure modes are presented in Figure 4(b). For some of these connections, the GFRP plate also 222
present additional cracks either along the main failure line or around the bolt-hole. On the outer 223
face of some GFRP specimens, damage of the top layer due to the out-of-plane deformation was 224
also observed on the free end edge (shear path). This damage was more pronounced on larger 225
specimen than on narrow ones. A typical case of this deformation is shown on specimen 226
S40E40-3 (Figure 4b). 227
Force-displacement curves of one-bolt single-lap connections. Figures 4(c) show the typical 228
force-displacement curves of single-lap S20E30 and S40E40. It is observed that the GFRP plates 229
behave linearly up to approximately 15 kN. Then the loads continue to increase, but with a 230
reduced stiffness up to the peak load. The reduction of the stiffness is probably due to the 231
reduction of the clamping pressure between the two plates during loading. The average peak load 232
is observed at approximately 41 kN for S20E30 and 48 kN for S40E40 for an average 233
displacement of 2.9 and 2.3 mm respectively. No relation between failure mode and peak load 234
was observed. After the peak load, the curve suddenly drops down to about 10 to 20 kN for 235
S20E30 and 20 to 30 kN for S40E40 suggesting a partial failure on the GFRP. From this point, 236
the GFRP undergoes a progressive failure. The displacement to which the complete failure 237
11
occurred is unknown because the tests were stopped at this stage as the maximum load was 238
achieved and load was less than 50% of the maximum value. However, as it can be observed in 239
Figure 4(c), some test results suggest that this displacement can exceed 5 mm. The typical force-240
displacement curve of double-lap DS20E30 is also presented in Figure 4(c). It is observed that 241
restraining the eccentricity improves the joint stiffness, which is now similar to that of S40E40. 242
However, the displacement at which the peak load occurs is lower compared to S20E30. The 243
average peak load for DS20E30 is 43.4 kN. Compared to the average strength in S20E30 (41 244
kN), strength reduction associated to out-of-plane deformation is negligible probably due to the 245
short connection length (shear path). More experimental tests are necessary to investigate this 246
effect on connections with wider plate and/or longer shear path. 247
As depicted in Figure 4(c), there is a particularity with the curve of specimens S20E30-1. The 248
linear behaviour of this curve is interrupted at approximately 1 mm displacement and 20 kN 249
force. Here the progression of the load remains insignificant up to 2 mm displacement. Then, the 250
load increases up to a peak value of 40 kN and a displacement of 3.7 mm. This interruption of 251
the load growth was due to the displacement (slippage) of the bolt in the bolt-hole. This same 252
behavior was also observed on S20E30-3. To prevent this behavior in the specimens tested later, 253
special attention was given to joint tightening to ensure the contact between the bolt-hole and the 254
bolt in the loading direction. In summary, increasing s/d from 2 to 4 and e/d from 3 to 4, led to a 255
moderately higher connection strength. The joint eccentricity was found to have limited effect on 256
the connection strength when s/d=2 and e/d=3. However, doubling the shear plane improves the 257
joint stiffness. 258
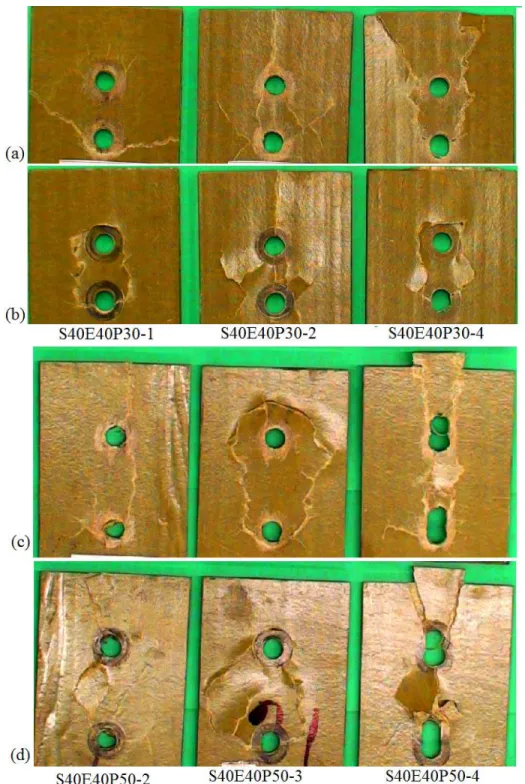
Failure mode of two-bolt connections. The typical failure mode of two-bolt GFRP-steel single-259
lap connections is presented in Figures 5. The inner and outer faces of the two bolts connection 260
are presented because the failure mode was not always the same on both faces of the same 261
12
specimen. For example, in Figure 5(a), while the inner face of specimen S40E40P30-1 shows 262
signs of net-section failure in the lower row, the outer face in Figure 5(b) shows propagation of 263
cracks around the two bolt-hole (block shear failure). Therefore, it is difficult to characterize this 264
failure mode within the conventional types of failure presented in Figure 1. However, for 265
specimens S40E40P30-2 shows cleavage failure on both faces. Shear failure is observed on 266
specimens S40E40P30-4. However, propagation of cracks in the shear path has different patterns 267
in the inner and the outer faces. On the inner face (Figure 5a), the cracks start from the lower row 268
and propagate towards the top free end of the plate. On the outer face (Figure 5b), the cracks are 269
limited around the two holes. Figures 5(c) and 5(d) present crack damages respectively in the 270
inner and outer face of S40E40P50. Compared to S40E40P30, the failure modes were more 271
consistent on both faces. With S40E40P50, shear failure was the predominant mode. Shear 272
damage was in some cases limited around the bolt-hole (S40E40P50-3), while in other cases 273
(S40E40P50-4) it started at the top row and propagated towards the free end of the plate. Other 274
specimens fail in cleavage (S40E40P50-2). Here, cracks initiated on the side of the lower bolt-275
hole and propagated through the top bolt-hole and towards the free end distance. It was also 276
noted that all these configurations show some bearing damage at the lower row. However, no 277
complete bearing failure of the joint was observed. 278
The top layer of all single-lap configurations shows additional crack damages due to the 279
out-of-plane deformation. In two bolt-column, the crack started at the lower row and propagated 280
toward the top row but are interrupted by the compression induced on the washer of the top bolt. 281
This compression forces the top layer of the GFRP plate to develop several cracks between the 282
two bolt-hole as it can be observed on specimens S40E40P30-2, S40E40P50-3 and S40E40P50-4 283
(Figure 5b and 5d). This phenomenon can be observed in Figure 6(a). In one bolt single-lap, 284
these crack damages freely propagated through the shear path as shown in Figure 4(b) for 285
13
specimen S40E40-3. It can also be noted that doubling the number of bolt did not change the 286
failure mode. Shear and cleavage failures are the observed modes in one-bolt and two-bolt 287
connections with s/d=4 and e/d=4. Observing cleavage failure in such long and wide connections 288
is not surprising as this mode is typical to highly orthotropic composite material. 289
Force-Displacement curves of two bolts connections. In Figure 6, the typical force-290
displacement curves of S40E40P30 and S40E40P50 are compared. The load history is similar to 291
that observed with one-bolt joints. The peak loads are observed at 75 and 78 kN for S40E40P30 292
and S40E40P50 respectively. Hence, only 4% gain in the joint capacity was achieved by 293
increasing the pitch. However, displacement at failure increased from an average of 2.1 mm for 294
S40E40P30 to an average of 3.8 mm for S40E40P50. The loads sustained by the GFRP plates 295
after the peak load were scattered and vary from 15 kN to 40 kN in both configurations. 296
Therefore, increasing the pitch distance has no significant effect on the GFRP plate carrying 297
capacity. Nevertheless, the joints with higher pitch distance were able to achieve more 298
displacement, therefore a safer behavior. The typical force-displacement curve of S40E40 is also 299
presented on Figure 6. It can be observed that increasing the number of bolts with a constant end-300
distance and side-distance (e/d=4 and s/d=4) from one bolt to two bolts in a column increased the 301
joint capacity by approximately 60%. It is significant that increasing the number of bolts from 302
one to two did not double the load capacity of the GFRP connection. It can also be observed that 303
the peak load of the GFRP plate occurred at approximately the same displacement for S40E40 304
and S40E40P30. 305
In summary, the damage behavior of single-lap connection was difficult to assess. The 306
incompatibility of stiffness between GFRP and steel plates could have been one of the 307
contributing factors of the observed deformations. Using GFRP plate thicker or wider than steel 308
plate could improve the joint stiffness. As carbon composites are stiffer, they might better 309
14
address the deformation issues in the composite part of the joints than glass composite. For this 310
study, glass composite was selected instead of carbon composite due to its low cost and 311
availability. Furthermore, with carbon composite, galvanic corrosion could occur and would 312
need to be addressed. 313
314
Comparison of experimental and predicted results
315
The ASCE Pre-standard [1] is the most recent design reference for GFRP in civil engineering 316
application. For this analysis, the nominal strength prediction obtained using equations 317
recommended by this ASCE Pre-standard [1] are compared with experimental test results of one-318
bolt and two-bolt connections. Since only the nominal strength is considered, no resistance factor 319
is used for the calculation of the strength predictions. 320
Design equations 321
ASCE Pre-standard [1] provides equations corresponding to each potential failure mode. For net-322
section failure for a multi-row of bolts, it establishes net-section strength (Rnt) presented in 323
Equation 1. The strength per bolt in configuration with one-row of bolt(s) is calculated using 324 Equation 2. 325 Rnt= [( 1 (ndw−1)(1 + CLt(Spr− 1.5 Spr−1 Spr+1θ)) Lbr w nd) + ( [1+Cop(1+(1−1 S⁄ pr)3)](1−Lbr) 1−ndhw )] −1 w. t. 𝑓uLt (1) 326 Rnt = [1 + CLt(Spr− 1.5SSpr−1 pr+1θ)] −1 (w − n. dh)t. 𝑓uLt (2) 327 with: 328
θ = 1.5 − 0.5 (we) and Spr= w d ⁄ for one-bolt per row 329
θ = 1.5 − 0.5 (eg) and Spr= g d ⁄ for multi-bolt per row 330
CLt=0.4 for plate and Cop=0.5 for shape. 331
15
Lbr is the proportion of the connection force taken in bearing at the first bolt row (see Figure 2a). 332
The value of Lbr can be found in [1], 333
fuLt is the tensile strength in the longitudinal direction of the GFRP plate, 334
n is the number of bolts in a row. 335
The nominal shear tear-out strength (Rsh) per bolt for connection with one-row of bolt(s) is 336
defined in Equation 3. Equation 4 gives the shear tear-out strength per column of bolts for 337
connection with two rows of bolts separated by a pitch (p). 338 Rsh = 1.4 (𝑒 −𝑑ℎ 2) 𝑡. 𝑓ipsh (3) 339 Rsh = 1.4 (𝑒 −𝑑2ℎ+ 𝑝) 𝑡. 𝑓ipsh (4) 340
Where fipsh is the characteristic in-plane shear strength of the GFRP plate. 341
The bearing strength (Rbr) per bolt is the product of bearing area to the bearing strength (fbr) of 342
the material as defined in Equation 5. 343
Rbr = 𝑡. 𝑑. 𝑓br (5)
344
For single bolt centrally positioned with e/d ˂4d, cleavage strength (Rcl) is the lesser of 345 Equations 6 and 7. 346 Rcl= 0.15 ((2. 𝑠 − 𝑑ℎ)𝑓uLt+ 2. 𝑒. 𝑓ipsh) . 𝑡 (6) 347 Rcl= (109 −49𝑑ℎ 𝑒) 2 𝑡. 𝑑. 𝑓br (7) 348
Since fbr was not tested in the present experimental study, the ratio of fbr/fuLt =1.8 measured by 349
Rosner and Rizkalla [10] was taken. 350
For a single-row of bolts (with the maximum number of bolts in the row set to three) at uniform 351
gage distance (g), cleavage strength (Rcl) is defined as: 352
Rcl= 0.15 ((2. 𝑠 + 0.5𝑔 − 𝑑ℎ)𝑓uLt+ 2. 𝑒. 𝑓ipsh) . 𝑡 (8) 353
16
Cleavage strength prediction is not provided for a multi-row of bolts in the ASCE Pre-standard 354
[1]. For connection with multi-row of bolts, ASCE Pre-standard [1] also recommends 355
multiplying the nominal strength of the connection by the ratio of p/4d when p/d ˂4. 356
Analysis of the predicted results 357
In Table 4, columns 4 to 8 list the results obtained using Equations 1 to 7. The average tensile 358
strengths obtained from the tested coupons and reported in Table 2 were used in the calculation. 359
The governing failure load and failure mode are reported in columns 9 and 10. The predicted to 360
experimental ratios are also reported in column 11. 361
For connection S20E30, experimental study produced three types of failure mode: net-section, 362
shear tear-out and cleavage failures. However, among the seven specimens tested for this 363
configuration, failure by cleavage was the predominant mode while only cleavage failure was 364
observed for DS40E30. The ASCE Pre-standard [1] predicts that cleavage governs design, which 365
is consistent with some experimental specimens. However, the predicted strength governed by 366
Equation 6 was underestimated by 53% to 55%. For connection S40E40, failure by shear was the 367
predominant mode observed experimentally. The ASCE Pre-standard [1] predicts that failure by 368
shear governs the design. However, it underestimates the strength by 15% compared to 369
experimental tested results. It is important to note that the ASCE Pre-standard [1] recommends 370
that cleavage should not be considered for connection with e/d≥4. However, experimental results 371
reveal that this failure mode is possible for e/d=4. 372
The ASCE Pre-standard [1] predicts net-section failure for S40E40P30 and S40E40P50. It was 373
rather shear out and cleavage that were observed experimentally for S40E40P30. Shear tear-374
out was also the predominant failure mode observed experimentally for S40E40P50. Therefore, 375
the predicted failure mode is not consistent with experimental observations. While the strength 376
prediction of S40E40P50 is only 18% below the experimental failure load, that of S40E40P30 is 377
17
underestimated by 36%. For S40E40P30, this larger underestimation is due to the requirement of 378
multiplying the net-section connection strength by the ratio of p/4d when p is less than the 379
required minimum. Such recommendation significantly reduced the connection strength 380
prediction even though it was observed experimentally that the pitch had limited effect on the 381
failure load. ASCE Pre-standard [1] does not provide an equation of cleavage strength for multi-382
row of bolts. However, in experimental section, some specimens of S40E40P30 and S40E04P50 383
show failure by cleavage. Therefore, it could be useful to define an equation capable of 384
predicting this failure mode for a multi-row of bolts. 385
More data are required to better understand the relationship between the different geometric 386
parameters and the connection strength. Finite element approach will be used to extend such data. 387
Finite element analysis
388
Overview of the finite element analysis 389
Through FE analysis, this section aims to investigate the effects of the end-distance (e), the side-390
distance (s) and the pitch (p) on the connection strength. A two-dimensional (2D) finite element 391
model was developed with the commercial software ADINA 8.7.3. The analysis started with a 392
validation study based on experimental results described above and also with the data of some 393
papers discussed above [10, 17]. The properties shown in Table 2 were used for this part of the 394
study. This validation was followed by a parametric simulation where the effect of geometrical 395
parameters for one-bolt connections and two-bolt connections aligned parallel to the loading 396
direction, was investigated. The ratio were 1≤e/d ≤5 and 1.5≤e/d ≤5. The pitch-distance (p/d=2, 397
3, 4 and 5) for two-bolt parallel to the loading direction (two-bolt in a column) were also 398
investigated. In the parametric study, two types of GFRP plates were studied: one with the ratio 399
of ETt/ELt=0.2 using the properties of the plates in the current study; the other with the ratio of 400
ETt/ELt=08 using the properties of the plates reported by [17]. The interest the two types of plates 401
18
is the relative proportion of CSR and CSM. The model with ETt/ELt=0.2 represents a highly 402
orthotropic material. It achieves higher strength in the pultruded direction than in the transversal 403
direction. On the other hand, with a ratio of ETt/ELt =0.8, the relative proportion of CSM and 404
CSR leads to quasi-isotropic plate. 405
Analysis assumptions 406
This study was limited to the evaluation of joint strength and failure mode for GFRP with 407
loading parallel to the pultruded direction. In the experimental study of GFRP-to-steel 408
connection, failure of the joint was due to the GFRP fracture. Therefore, only the GFRP plate 409
was modelled in the finite element (FE) analysis. Figure 7(a) presents the typical 2D model used 410
for this analysis. For model validation, all configurations tested in the experimental program 411
were analysed. Additional configurations reported in others papers [10; 17] were also used. Their 412
material properties are presented in Table 2 while details of chosen configurations are presented 413
in Table 5. In the static environment of ADINA, the GFRP plate was modelled as a 2D solid with 414
a quadrilateral element. These elements haves nine nodes per element and six degrees of freedom 415
per node. The mesh density is shown in Figure 7(a). Each element edge length was 416
approximatively equal to 2 mm. The mesh density was refined around the bolt-hole. In a square 417
refined mesh area, the length ratio of the element edges (last element/first element) was equal to 418
0.2. It was verified that further reducing the mesh size does not influence the stress distribution 419
in the model. The GFRP plate was modelled as a plastic orthotropic material. The anisotropy 420
parameters were determined from yield stresses. The input yield stresses were taken as the 421
ultimate tensile strengths of the material and the input plastic strain was taken as a material 422
longitudinal tensile strain. Contact between the bolt and the plate was modelled by a contact 423
feature available in ADINA. To reduce the computation time, the bolt was modelled as a rigid 424
half cylinder. The contact interface was generated as a pair of surface elements. On this interface, 425
19
the bolt was defined as a target surface and the bolt-hole elements as a contactor surface. This 426
assumption was based on the fact that the elastic modulus of the steel bolt is greater than that of 427
GFRP plate. Due to the use of contact elements, no boundary condition was applied on this 428
interface. For all configurations, the length L presented in Figure 7(a) was always constant and 429
equal to 127 mm. A uniform pressure was applied in the longitudinal Z-axis on the far end plate 430
edge. The external load was applied incrementally on the structure. Once the GFRP plate reached 431
the input strain, the model diverged. The recorded peak load was taken as the strength of the 432
connection. 433
Validation of the finite element model 434
Figures 7(b) to 7(g) present the post-processing Hill effective stress distribution of the FE model. 435
Based on the stress distribution along a given failure path of the model, the joint failure mode 436
was defined. For example, for shear tear-out failure presented in Figure 7(b) and 7(c), excessive 437
stresses are developed between the sides of the bolt-hole and propagate towards the free end 438
edge of the plate. For net-section failure, excessive stresses are developed across the centerline of 439
the bolt-hole in the net-section path (Figure 7d). A typical bearing failure is presented in Figure 440
7(e); stresses are limited ahead of the bolt-hole in the bearing path and barely reach the free end 441
edge of the plate. Cleavage failure is characterized by excessive stresses ahead of the bolt-hole 442
(Figure 7f) In addition, excessive stresses also develop from the free end edge of the plate 443
towards the bolt-hole in the loading direction. In Table 5, the ultimate loads (PFE) and failure 444
modes obtained from FE analysis of one and two bolts connections are compared to the average 445
experimental failure loads. It can be observed that the FE results are in very good agreement with 446
experimental results. In general, the FE failure loads are slightly conservative. All ratios of 447
predicted to experimental results are within 8% difference. The observed FE failure modes were 448
also quite consistent with the experimental failure modes. In Figure 8, the typical force-449
20
displacement curves obtained in the FE analysis are compared to that of experimental results. 450
Here also, it can be seen that the force-displacement history are quite consistent with that of 451
experimental curves up to the peak load at which the FE model stops. 452
Parametric simulation and analysis of the results
453
Following the satisfactory agreement between FE model and experimental results, a parametric 454
study was carried out. The results obtained from the parametric simulation are presented in Table 455
6. For connections with one or two bolts, the FE results were used to define the boundaries of 456
predicted failure modes and are shown in Figure 9 by dashed lines. These boundaries are 457
presented in Figure 9(a) for one-bolt connections of GFRP plates with ETt/ELt=0.2 and in Figure 458
9(b) for those with ETt/ELt=0.8. The boundaries of predicted failure modes according to ASCE 459
Pre-standard [1] were also identified and are shown by the lines in Figure 9(c) for connections of 460
a GFRP plate with ETt/ELt=0.2, and in Figure 9(d) for ETt/ELt=0.8. Failure modes from our 461
experimental study and those reported in reference papers are listed in Table 7. They are 462
represented by symbols in Figure 9 where they are regrouped for ETt/ELt≤0.3 in Figures 9(a) and 463
9(c) or ETt/ELt≥0.7 in Figures 9(b) and 9(d). Failure loads from Table 6 are reported in Figures 464
10(a) and 10(b) for various geometrical parameters of one-bolt connections. The predicted 465
failure loads using ASCE Pre-standard [1] for the minimum recommended side-distance are also 466
shown by the dotted line. The numbers in parenthesis in Figure 10 identify the equation that 467
governs the design according to [1] with the minimum recommended side-distance (s/d=1.5). For 468
two-bolt connections, information similar to Figure 9 and 10 is provided in Figures 11 and 12. 469
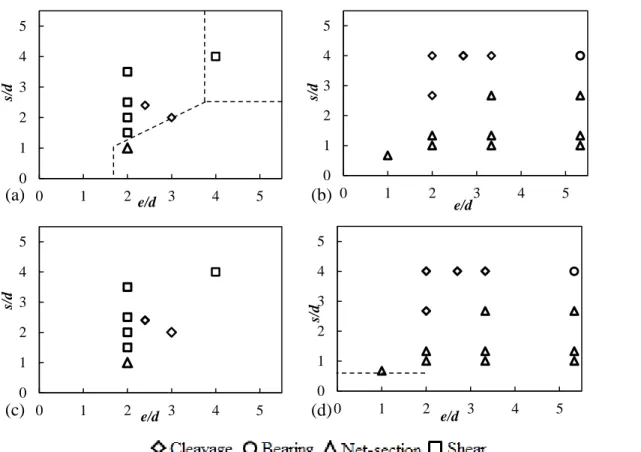
Effects of geometric parameters in one-bolt connections 470
For one-bolt connection, FE results in Figures 9(a) and 9(b) identified three failure zones: 471
cleavage, shear and net-section for connections with highly orthotropic GFRP plates and 472
cleavage, net-section and bearing for those with quasi-isotropic GFRP plates. On the other hand, 473
21
ASCE Prestandard [1] identifies the fours failure zones for each material. The experimental data 474
points presented in Figure 9(b) and 9(c) show that FE analysis provided better predictions than 475
[1] for connections with quasi-isotropic GFRP plates. However, due to the limitted number of 476
data point, it is difficult to conclude which one of the FE analysis or the ASCE Pre-standard 477
equations provide the best predictions for these failure modes in the case of a highly orthotropic 478
plate. Therefore, more experimental data points would be needed for this material. 479
The failure loads predicted by FE analysis for one-bolt connections are presented in Table 480
6. For connections with ETt/ELt=0.2 and ETt/ELt=0.8, it can be observed that for s/d≤1.5, there is 481
no significant gain in failure load when e/d˃4. Similarly, for s/d≥2, there is no increase in failure 482
load when e/d˃4. It is useful to compare this observation with ASCE Pre-standard [1] or 483
manufacturer [4,6] recommendations. For one-bolt connection, ASCE Pre-standard [1] 484
recommends the minimum values of e/d=4 and s/d=1.5. This appears to be a conservative 485
geometrical value for the end-distance since the FE analysis shows that approximately the same 486
failure load can be attained for s/d=1.5 and e/d=3. On the other hand, the manufacturers 487
recommend a minimum combination of e/d=3 and s/d=2. For these parameters, the FE predicted 488
load is approximately 55% higher than the one corresponding to the recommendation of ASCE 489
Pre-standard [1] for both materials. 490
All FE values associated to one-bolt connections are illustrated in Figures 10(a) and 491
10(b). The prediction of ASCE Pre-standard [1] for the minimum recommended side-distance 492
s/d=1.5 is identified by the dotted line in these figures. When comparing the FE predictions and
493
ASCE Pre-standard [1] predictions for s/d=1.5 (Figure 10a), the strengths predicted by [1] 494
governed by cleavage (equation 6) are approximately 50% lower than FE analysis that also 495
predcits cleavage for e/d=2 and e/d=3. However, for all other values of e/d, the loads predicted 496
by [1] are consistent with the FE predicted loads. For connections of quasi-isotropic GFRP plates 497
22
presented in Figure 10(b), the failure loads predicted by [1] for s/d=1.5 and varying values of e/d 498
are all quite consitent with the FE predicted loads. Although predicted loads with ASCE Pre-499
standard [1] are governed by the same design equations as for highly orthotropic plates, cleavage 500
strength predicted using Equation 6 seems to provide a better prediction for quasi-isotropic than 501
for highly orthotropic plates. 502
Effects of geometric parameters in two-bolt connections 503
For two-bolt connection, FE results in Figures 9(a) and 9(b) identifies three failure zones: 504
cleavage, shear and net-section for connections with highly orthotropic GFRP plates. For 505
connections with quasi-isotropic GFRP plates, only two failure zones: cleavage and net-section 506
are identified. On the other hand, ASCE Prestandard [1] identifies only shear and cleavage zones 507
for connections with highly orthotropic GFRP plates and net-section failure is the only occuring 508
mode for those with quasi-isotropic GFRP plates. The experimental data points presented in 509
Figure 11(b) and 11(d) show that FE analysis provided a better predictions than [1] for 510
connections with quasi-isotropic GFRP plates. However, the limit number of data points for 511
highly orthotropic plate is not sufficient to conclude on the actual predictions. Therefore, more 512
experimental data points would be needed for this material. 513
The failures loads predicted by FE analysis for two-bolt connections are presented in 514
Table 6. For connections of highly orthotropic plates with ETt/ELt=0.2, it can be observed that for 515
s/d=1.5, there is no significant gain in failure load when e/d˃2. Similarly, for s/d≥2, there is no
516
significant increase in failure load when e/d≥4. For connections of quasi-isotropic plates with 517
ETt/ELt=0.8, no significant increase in the failure load is observed when e/d≥2 and s/d≤3. Above 518
s/d˃3, the strength increases with e/d up to a ratio of 3. It is useful to compare this observation
519
with ASCE Pre-standard [1] or manufacturer [4,6] recommendations. For two-bolt connection, 520
ASCE Pre-standard [1] recommends the minimum values of e/d=2, s/d=1.5 and p/d=4. On the 521
23
other hand, the manufacturers recommend a minimum combination of e/d=3, s/d=2 and p/d=3. 522
The recommendation of the manufacturer leads to a connection strength approximately 52% and 523
57% higher than that corresponding to the ASCE Pre-standard [1] minimum values for 524
connections with ETt/ELt=0.2 and ETt/ELt=0.8 respectively. It is interresting to note that, for all 525
values associated to two-bolt connections in Table 6 increasing p/d above 3 has little effect on 526
the connection failure load. 527
The FE values associated to two-bolt connections are also illustrated in Figure 12(a) and 528
12(b) for the recommended value of e/d=2 with various ratios of s/d and p/d. The prediction of 529
ASCE Pre-standard [1] for the minimum recommended side-distance s/d=1.5 is identified by the 530
dotted line in these figures. When comparing the FE predictions and ASCE Pre-standard [1] 531
predictions for s/d=1.5, the difference in prediction is significant for values of p/d˂4 for both 532
types of plates. For these geometric parameters, the design values are governed by net-section 533
failure (Equation 1) which produces the predicted strengths approximately 60% lower than FE 534
prediction for p/d=2 and 38% for p/d=3 for highly orthotropic plates. For quasi-isotropic plates 535
this difference is 38% for p/d=2 and 26% for p/d=3. However, when p/d≥4, the results predicted 536
by [1] are quite consistent with FE results. In that case, the maximum difference between the 537
predicted loads and the FE loads is nearly 17% for connections with ETt/ELt=0.2 while it does not 538
exceed 16% for connections with ETt/ELt=0.8. This larger difference for values of p/d˂4 is due to 539
the recommendation of ASCE Pre-standard [1] to reduce the predicted strength of connection 540
with p/d˂4 to the ratio of p/4d. 541
542
CONCLUSIONS
24
The aim of this paper was to investigate the effect of geometric parameters and material 544
properties on the behavior of GFRP-to-steel bolted connections. An experimental study on a 545
GFRP pultruded plate connected to a steel plate was performed. The effects of increasing the 546
side-distance, the end-distance, the pitch, and the number of bolts in the joint were discussed. 547
The experimental results were compared to the strength calculated from ASCE Pre-standard [1]. 548
Finally, FE analysis along with experimental data, were used to evaluate the failure load and 549
failure mode of other geometric parameters. It was found that: 550
The parametric study showed that the failure mode can be better predicted with the FE 551
model than with ASCE Pre-standard [1] for both highly orthotropic and quasi-isotropic 552
materials. 553
For one-bolt connection, the experimental results obtained in the present study show that 554
increasing s/d from 2 to 4 and e/d from 3 to 4, lead to a moderately higher strength and an 555
improved behavior of the joint at failure. Bearing failure was not observed due to the use 556
of highly orthotropic material. Experimental data along with FE parametric analysis show 557
that this failure mode would happen for GFRP plate with quasi-isotropic material. 558
For two bolt in a column, the experimental results show that increasing the pitch distance 559
from 3 to 5 provides no significant increase of capacity. Nevertheless, the connections 560
with higher pitch distance were able to achieve more displacement, therefore a safer 561
behavior. The experimental data and FE analysis reveal that pure bearing failure is not 562
likely to occur. For connections with highly orthotropic plate, shear or cleavage were 563
found to be the predominant failure modes. For connections with quasi-isotropic plates, 564
cleavage was observed for short end-distance and net-section failure was predominant for 565
e/d˃2.
25
The out-of-plane deformation was found to have limited effect on the strength of the 567
tested connections (S20E30). Failure modes in single-lap were difficult to assess as a 568
variety of failure modes were observed within the specimens of the same configurations 569
or within the outer and inner faces of the same specimen. This variety of failure modes 570
was not observed in the double-lap configuration. 571
ASCE Pre-standard [1] does not always predicts failure modes that are consistent with 572
experimental observations. The strength predicted by ASCE Pre-standard [1] is too 573
conservative for some configurations. 574
RECOMMENDATION
575
Based on the results of this work, recommendations to improve the ASCE Pre-standard [1] are 576
formulated as follows. 577
- The values of s/d=2 and e/d=3 should be considered as a minimum values for GFRP 578
bolted connections as they were found to provide higher strength than the strength 579
obtained with the values recommended by ASCE Pre-standard [1]. 580
- The recommendation of ASCE Pre-standard [1] to multiply the connection strength by 581
the ratio of p/4d when p is less than the required minimum could significantly 582
underestimate the strength of the connection for both highly orthotropic and quasi-583
isotropic materials. Therefore, further consideration should be given to this aspect. 584
- More experimental data especially for connections with highly orthotropic GFRP plate 585
(ETt/ELt≤0.3) are required to validate some of the parametric observations. For quasi-586
isotropic GFRP plate (ETt/ELt≥0.7), additional experimental data will be necessary to 587
define the bearing failure mode zone. 588
- More experimental analyses are necessary to study the effect of out-of-plane deformation 589
on multi-row bolts. 590
26
ACKNOWLEDGEMENTS
591
The financial support provided by Natural Science and Engineering Research Council of Canada 592
(NSERC) is well appreciated. Special thanks to the manufacturer Strongwell Corporation for 593 providing GFRP plates. 594 595 REFERENCES 596 597
[1] ASCE. Pre-Standard for Load and Resistance Factor Design (LRFD) of Pultruded 598
Reinforced Polymer structure (Final). USA, 2010, pp.67-84.
599
[2] Clarke J.L. EUROCOMP Design Code and Handbook. London. E & FN Spon. First Edition, 600
1996, ISBN 0 419 19450 9 601
[3] CNR-DT 205/2007. Guide for the Design and Construction of Structures Made of FRP 602
Pultruded Elements. Advisory Committee on Technical Recommendation for Construction.
603
http://www.cnr.it/documenti/norme/IstruzioniCNR_DT205_2007_eng.pdf 604
[4] Strongwell. Extren Design Manual, Bristol, VA, 2002. 605
[5] Fiberline Composites. The Fibreline Design Manual. Denmark, 2003. 606
[6] Creative Pultrusions. The Pultex Pultrusion Global Design Manual. Alum Bank, PA, 2001. 607
[7] Bank, L.C. Composite for Construction Structural Design with FRP materials. John Wiley & 608
Sons, Inc. USA, 2006. 609
[8] Thoppul S.D., Finegan J. and Gibson R.F. Mechanics of mechanically fastened joints in 610
polymer-matrix composite structures - A review, Composites Science and Technology 2008; 611
69:301-329. 612
[9] Mottram JT. and Turvey GJ. Physical test data for the appraisal of design prcedures for 613
bolted joints in pultruded FRP structural shapes and systems, Progress in Structural 614
Engineerong and Materials 2003; 5(4): 195-222. 615
[10] Girao Coelho AM. and Mottram JT. A review of the behaviour and analysis of bolted 616
connections and joints in pultruded fibre reinforced polymers, Materials and Design, 2015; 617
74: 86-107. 618
[11] Mottram JT. Reference and bibliography database on research and development with 619
pultruded fibre reinforced polymer shapes and systems, 2014. 620
http://www2.warwick.ac.uk/fac/sci/eng/staff/jtm/prfp_latest.pdf 621
[12] Abd-El-Naby S.F.M. and Hollaway L. The experimental behaviour of bolted joints in 622
pultruded glass/polyester material. Part 1: Single-bolt joints. Composites 1993a, 24(7): 531– 623
538. 624
[13] Rosner C.N. and Rizkalla S.H. Bolted connections for fibre-reinforced composite structural 625
members: Experimental program. Journal of Materials in Civil Engineering, ASCE 1995, 626
7(4): 223–231. 627
[14] Erki M.A. Bolted glass-fibre-reinforced plastic joints. Canadian Journal of Civil 628
Engineering 1995; 22: 736–744. 629
[15] Cooper C. and Turvey G.J. Effects of joint geometry and bolt torque on the structural 630
performance of single bolt tension joints in pultruded GRP sheet material. Composite 631
Structures, 1995, 32(1–4): 217–226. 632
[16] Yuan, R.L., Liu, C.J., and Daley, T. Study of mechanical connection for GFRP laminated 633
structures, Proc. 2nd International Conference on Advanced Composite Materials in Bridges 634
27
and Structures ACMBS-2, The Canadian Society for Civil Engineers, Whistler, 1996,
951-635
958. 636
[17] Ramaskrishna S. Hamada H. and Nishiwaki M. Bolted joints of pultruded sandwich 637
composite laminates. Composite Structures 1995; 32: 227-235 638
[18] Yuan, R.L. and Weyant, S.E. The effect of environmental exposure of the behavior of 639
pultruded mechanical connections, in Proc. Annual Conf. Composite Institute, SPI, 1997, 640
Session 14-F. 641
[19] Turvey, G.J. Single-bolt tension joint tests on pultruded GRP plate: effects of tension 642
direction relative to pultrusion direction, Compos. Struct., 1998, 42(4), 341-351. DOI: 643
10.1016/S0263-8223(98)00079-8 644
[20] Yuan, R.L., and Liu, C.J. “Experimental characterization of FRP mechanical connections”, 645
Proc. 3rd International Conference on Advanced Composite Materials in Bridges and
646
Structures ACMBS-3, The Canadian Society for Civil Engineers Montreal, 2000, 103–110.
647
[21] Turvey, G.J. and Wang, P. Single-bolt tension joints in pultruded GRP material Effect of 648
temperature on failure loads and strengths and joint efficiency, in Proc. Conf. on Strain 649
Measurement in the 21st Century, British Society for Strain Measurement, 2001, 20-23.
650
[22] Turvey, G.J. and Wang, P., ‘Effect of temperature on the structural integrity of bolted joints 651
in pultrusions,’ in Proc. Inter. Conf. on Composites in Construction – CCC2001, A.A. 652
Balkema Publishers, (Swets & Zeitlinger) Lisse, 2001, 171-176. 653
[23] Wang, Y. Bearing behavior of joints in pultruded composites, J. Compos. Mater., 36(18), 654
2002, 2199-2216. DOI: 10.1177/0021998302036018535 655
[24] Turvey, G.J. and Wang, P. Single-bolt tension joints in pultruded GRP plate – effects of 656
elevated temperature on failure loads, failure modes, load orientation and joint efficiency, in 657
Proc. Joining Plastics 2006, Rapra Conf. Proc., 2006, Paper No. 9.
658
[25] Turvey, G.J. and Wang, P., Thermal preconditioning study for bolted tension joints in 659
pultruded GRP plate, Composite Structures, 77 4, 2007, 509-513. 660
[26] Turvey, G.J. and Wang, P., Failure of pultruded GRP single-bolt tension joints under hot– 661
wet conditions, Composite Structures, 77 4, 2007, 514-520. 662
[27] Turvey, G.J. and Wang, P., Effect of hole clearance on bolt loads in pultruded GRP tension 663
joints, in Proc. 16th Inter. Conf. on Composite Materials (ICCM-16), July 2007, Kyoyto. 664
[28] Turvey G.J. and Wang, P., Failure of pultruded GRP bolted joints: a Taguchi analysis, 665
Engineering and Computational Mechanics, 162 3, 2009, 155 –166 666
[29] Turvey, G.J., Failure of single-lap single-bolt tension joints in pultruded glass fibre 667
reinforced plate, Proc. 6th International Conference on Composites in Construction 668
Engineering (CICE), Rome, 2012, Paper 08.089.
669
[30] Turvey, G.J. and Godé, J. An experimental investigation of the tensile behaviour of single-670
lap bolted joints in pultruded GFRP plate, in Proc. of FRP Bridge Conf., London, Net 671
Composites, Chesterfield, 2012, 77-91. CD-ROM 672
[31] Zafari, B. and Mottram, J.T., Effect of hot-wet aging on the pin-bearing strength of a 673
pultruded material with polyester matrix, J. of Composites for Construction, 16 3, 2012, 340-674
352. 675
[32] Turvey, G.J., Ultimate loads, strength, extensions and strains of pultruded GFRP single-lap, 676
single-bolt tension joints, in Proc. 6th Inter. Conf. on Advanced Composites in Construction, 677
Net Composites Ltd., Chesterfield, UK, 2013, 373-382. 678
[33] Lee, Y-G., Choi, E. and Yoon, S-J, Effect of geometric parameters on the mechanical 679
behavior of PFRP single bolted connection, Composites Part B –Engineering, 75, 2015, 1-10. 680
28
[34] Abd-El-Naby S.F.M. and Hollaway L. The experimental behaviour of bolted joints in 682
pultruded glass/polyester material. Part 2: two-bolt joints. Composites 1993b, 24(7): 539– 683
546. 684
[35] Prabhakaran R., Devara S. and Razzaq Z. The effect of fiber orientation angle on the 685
unnotched, open hole, and pin-loaded strength of a pultruded composite. In: Proceeding of 686
the 51st Annual Conference of the composite Inst. Society of the Plastic Industry, Washington
687
DC; 1996; 1-15. 688
[36] Prabhakaran R., Razzaq Z. and Devara S. Load and resistance factor design (LRFD) 689
approach for bolted joints in pultruded composites. Composites Part B: Engineering 1996; 690
27: 351–360. 691
[37] Hassan N.K., Mohamedien M.A. and Rizkalla S.H. Multibolted joints for GFRP structural 692
members. Journal of Composites for Construction, ASCE 1997; 1(1): 3-6. 693
[38] Prabhakaran, R., and Robertson, J., 1998, An experimental investigation of load-sharing in 694
a multi-bolt pultruded composite joint, Proc. 2nd International Conference on Composites in 695
Infrastructure ICCI, H. Saadatmanesh, M.R. Ehsani (eds.), Tucson, pp. 355-368.
696
[39] Turvey, G.J. and Wang P., Environmental effects on the failure of GRP multi-bolt joints, 697
Structures and Buildings, 162 4, 2009, 275-287. 698
[40] Girão Coelho, A.M., Mottram J.T. and Harries, K.A., Bolted connections of pultruded 699
GFRP: Implications of geometric characteristics on net section failure, Composite Structures, 700
131, (2015), 878-884. 701
http://dx.doi.org/10.1016/j.compstruct.2015.06.048 702
[41] ASTM D3039/D3039M-00:2006. Standard Test Method for Tensile Properties of Polymer– 703
Matrix Composite Materials. Vol. 15.03. Composite Materials. ASTM International West 704
Conshohocken, PA. 705
[42] ASTM D3518/D3518M-94:2007. Standard Test Method for In-Plane Shear Response of 706
Polymer Matrix Composite Materials by Tensile Test of a ±45° Laminate–Matrix. Vol. 707
15.03. Composite Materials. ASTM International. West Conshohocken, PA. 708
[43] ASTM A370-12:2005. Standard Test Methods and Definitions for Mechanical Testing of 709
Steel Products Vol. 01.03. ASTM International. West Conshohocken, PA. 710
[44] Kulak, G. L., Adams, P.F., Gilmor, M.I. Limit States Design in Structural Steel. Canadian 711
Institute of Steel Construction, 5th edition, 1998. 712 . 713 714 List of Figures 715 716
Figure 1. Failure modes: (a) Bearing, (b) net-section, (c) shear tear-out, (d) Block shear (e)
717
cleavage 718
Figure 2. (a) Typical joint geometric parameters, (b) Test set-up
719
Figure 3. Stress-strain relationships of the materials
720
Figure 4. Typical failure damages of GFRP (a) Inner face S20E30, (b) Outer face S40E40, (c)
721
Typical force-displacement curves of S20E30 compared to S40E40 and DS20E30 722
29
Figure 5. Failure damages of GFRP (a) Inner face of S40E40P30 (b) Outer face of S40E40P30,
723
(c) Inner face of S40E40P50 (d) Outer face of S40E40P50. 724
Figure 6. (a) Out-of-plane deformation of a two bolt-column, (b) Typical force-displacement
725
curves of S40E40P30 compared to S40E40P50 and S40E40. 726
Figure 7. (a) Typical 2D model, Post-processing failure modes: (b) bearing, (c) net-section, (d)
727
and (e) shear tear-out, (f) cleavage. 728
Figure 8. Typical force-displacement curves of the experimental compared to finite element
729
models: (a) S20E30, (b) S40E40, (c) S40E40P3, (d) S40E40P50. 730
Figure 9. Effect of e/d and s/d on failure modes for one-bolt: (a) FE and Exp. failure modes for
731
highly orthotropic plates; (b) FE and Exp. failure modes for quasi-isotropic plates; (c) [1] and 732
Exp. failure modes for highly orthotropic plates; (d) [1] and Exp. failure modes for quasi-733
isotropic plates; 734
Figure 10. Effect of e/d and s/d on joint strength for one-bolt: (a) FE failure loads for highly
735
orthotropic plates; (b) FE failure loads for quasi-isotropic plates 736
Figure 11. Effect of geometric parameters on failure modes for two-bolt: (a) FE and Exp. failure
737
modes for highly orthotropic plates; (b) FE and Exp. failure modes for quasi-isotropic plates; (c) 738
[1] and Exp. failure modes for highly orthotropic plates; (d) [1] and Exp. failure modes for 739
quasi-isotropic plates 740
Figure 12. Effect of geometric parameters on joint strength for two-bolt: (a) FE failure loads for
741
highly orthotropic plates; (b) FE failure loads for quasi-isotropic plates 742
743 744
List of Tables
745
Table 1. Minimum geometric requirements from design manuals (d: diameter of the bolt, dh:
30 bolt-hole)
747
Table 2. Mechanical properties of the materials 748
Table 3. Tests results of bolted joints 749
Table 4. Comparison of experimental to predicted results 750
Table 5 Model validation 751
Table 6. FE results: failure load (kN)/failure mode 752
Table 7. Experimental failure modes 753
31 755 756 757 758 759
Figure 1. Failure modes: (a) Bearing,
(b) net-section, (c) shear tear-out, (d) Block shear (e) cleavage
32 760
761 762
33 763
764 765
Figure 3. Stress-strain relationships of the
materials 0 100 200 300 400 500 600 0 1 2 3 4 5 Str es s (Mpa) Strain (%) GFRP Longitudinal GFRP In-plane Shear GFRP Transversal Steel