O
pen
A
rchive
T
OULOUSE
A
rchive
O
uverte (
OATAO
)
OATAO is an open access repository that collects the work of Toulouse researchers and
makes it freely available over the web where possible.
This is an author-deposited version published in :
http://oatao.univ-toulouse.fr/
Eprints ID : 19366
To link to this article : DOI:
10.1515/amm-2017-0122
URL :
http://dx.doi.org/10.1515/amm-2017-0122
To cite this version : Lacaze, Jacques and Sertucha, Jon and
Larrañaga, Peio and Suarez, Ramon Combined Effects of Copper and
Tin at Intermediate Level of Manganese on the Structure and
Properties of As-Cast Nodular Graphite Cast Iron (2017) Archives of
Metallurgy and Materials . pp. 825-831. ISSN 1733-3490
Any correspondance concerning this service should be sent to the repository
administrator:
[email protected]
J. LACAZE*#, J. SERTUCHA**, P. LARRAÑAGA**, R. SUÁREZ**,***
COMBINED EFFECTS OF COPPER AND TIN AT INTERMEDIATE LEVEL OF MANGANESE ON THE STRUCTURE AND PROPERTIES OF AS-CAST NODULAR GRAPHITE CAST IRON
Copper, manganese and tin are commonly used as pearlite promoter elements in cast irons. A number of studies have been aimed at quantitatively evaluate the effect of each of these elements, individually or at given levels of the others. As a matter of fact, while tin may be necessary for achieving a fully pearlitic matrix, it is known that when in excess it is detrimental for mechanical properties. As the pearlite promoting effect of each of those elements is totally different, it is of real interest to know the optimum combination of them for a given cooling rate. The present report is a first part of a work dedicated at characterizing the best alloy-ing levels in terms of room temperature mechanical properties of as-cast pearlitic materials.
Keywords: pearlitic nodular cast irons, copper, manganese, tin, room temperature mechanical properties
1. Introdution
Cast irons are mostly used in as-cast state to avoid costly heat-treatments that would also impair some of their mechanical properties such as fatigue resistance. In several cases, the desired matrix may be either fully ferritic or fully pearlitic. The aim of this work was to find if an optimal combination of manganese, copper and tin could be defined as regards room temperature (RT) mechanical properties of nodular graphite iron (SGI) when a fully pearlitic matrix is looked for in the as-cast state. It ap-peared of interest to first perform a literature review of available information on the effect of these pearlite promoter elements on microstructure. A series of castings have then been achieved for selected compositions. Microstructure and mechanical properties of these castings are presented and compared to literature data.
2. Literature review
Obtaining fully pearlitic matrix in as-cast complex compo-nents made of SGI needs resorting to alloying additions. Amongst other elements, the effect of manganese, copper and tin as pearlite promoters is well known though there are very few works avail-able for really quantifying it. Furthermore, the published reports deal with at most interaction between two of these elements, tin and copper in the work by Levin et al. [1], and Neumeier et al. [2], manganese and tin in the case of Kovacs [3], copper and manganese or tin for Lalich and Loper [4], and Pan et al. [5].
* CIRIMAT, UNIVERSITÉ DE TOULOUSE, TOULOUSE, FRANCE
** ENGINEERING AND FOUNDRY DEPARTMENT, IK4-AZTERLAN, DURANGO (BIZKAIA), SPAIN *** VEIGALÁN ESTUDIO 2010, DURANGO (BIZKAIA), SPAIN
# Corresponding author: [email protected]
In all these works, the alloys contained 3.60-3.75 wt.% carbon and more or less 2.4 wt.% silicon. However, the casting condi-tions in these various works differed and as the cooling rate has a definite effect on the pearlite and ferrite amounts the results from these studies could be only partly compared.
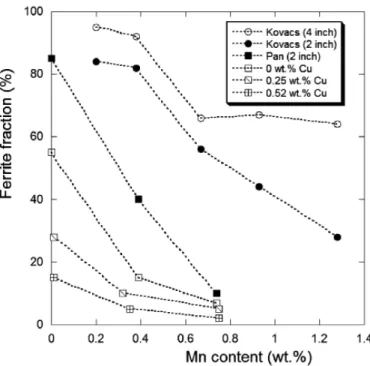
Fig. 1. Effect of the manganese content on the ferrite fraction in bars of various diameters, and effect of copper addition as observed on samples cast in TA cups. Results from Kovacs [3] and Pan et al. [5]
Figure 1 shows the effect of manganese on the ferrite frac-tion from Kovacs [3], and Pan et al. [5]. The two upper curves recall the effect of cooling rate by showing that larger bars (4 inch in diameter) present less pearlite than smaller ones (2 inch in diameter). Similarly, the difference between the pearlite contents in the two series of smaller bars from Kovacs (solid circles) and Pan et al. (solid squares) respectively relates certainly to mould materials and then again to cooling rate. The three lowest curves are from measurements made on standard thermal analysis (TA) cups by Pan et al. They illustrate the effect of various copper additions. It is noteworthy that even significant additions of both manganese and copper do not lead to fully pearlitic matrix, which is defined in all practicality as a matrix with less than 2% ferrite. This drawback of manganese and copper as pearlite promoters has been also stressed by Guerin and Gagné [6].
Fig. 2. Effect of tin content on ferrite fraction for alloys without copper added. Results from Levin et al. [1], Kovacs [3], Neumeier et al. [2] and Pan et al.[5]
Figure 2 illustrates the effect of tin as observed on bars (2 inch in diameter) by Levin [1], and Kovacs [3], and on keel-block legs by Neumeier et al. [2], and Pan et al. [5]. Except for Pan et al. series G results used here, all alloys contained some manganese as indicated in the figure caption. Independent on the manganese content, the same trend could be observed from all these results, i.e. a strong decrease in the ferrite fraction at very low level of tin. It is not possible to decide if the scattering of the data at intermediate tin contents (0.15-0.35 wt.%) relates to the various cooling conditions or to the change in the manganese content. However, it may be seen that fully pearlitic structure is obtained for a minimum tin content of about 0.14-0.15 wt.% when there is no manganese, while the necessary tin content decreases to about 0.11-0.12 wt.% when 0.30 wt.% manganese has been added.
An abrupt decrease in the ferrite fraction at about 0.05 wt.% Sn is stressed with the dotted line along the results by Neumeier et al. [2], who observed this also at increasing addition of copper. This latter effect has been also reported by Sertucha et al. [7], as shown in figure 3 where the results of Neumeier et al. [2], for alloys without tin have been plotted as well for comparison. It is quite possible that the shift of the transition from 0.6 wt.% Cu according to Sertucha et al. [7], to 0.5 wt.% for Neumeier et al. [2], relates to the associated increase in the manganese content from 0.15 wt.% to 0.27 wt.%. Results from Pan et al. [5], for various manganese contents have been also reported in figure 3. Although steady decrease has been drawn for these latter sets of data, they do not contradict a sharp decrease in the ferrite fraction at about 0.3-0.5 wt.% Cu.
Fig. 3. Effect of copper on ferrite fraction. Results from Pan et al. [5] and Sertucha et al. [7] are for TA cups, those from Neumeier are for keel-blocks [2]
Neumeier et al. could plot all their results along a single curve when considering (wSn + 0.1wCu) as abscissa where wi is the mass fraction of element i, in % [2]. Following this, an at-tempt to defining an index of pearlite promoting elements was made using the whole set of data from Pan et al. on TA cups [5]. It ends out that the quantity (0.075 wMn + 0.125 wCu + wSn) could be used satisfactorily as a tin equivalent Sneq to gather the measured ferrite fractions along one single curve as seen in Figure 4. A fully pearlitic matrix is obtained for Sneq larger than about 0.13 wt.% (interrupted line in Figure 4).
3. Experimental details
A series of six alloys was prepared with a constant man-ganese content at 0.6 wt.%, various contents in copper and two levels in tin. These compositions were selected so as to ensure
Six alloys have thus been cast the compositions of which are listed in Table 1 where the corresponding Sneq value is also indicated. It is seen that all Sneq values are above the critical value marked in Figure 4.
For each cast alloy, a 10 mm testing tensile bar with threaded ends was machined from one of the keel-blocks cooled in the mould and from the air cooled keel-block for room temperature tensile testing as detailed elsewhere [8]. The fracture surface was then prepared for metallographic inspection. Brinell hardness measurements were performed on a piece of the corresponding keel-blocks (mould and air cooled) using a 10 mm diameter sphere and a load of 3000 kg.
4. Results 4.1. Thermal analysis
The thermal records were very similar to those reported in the literature and do not seem worth of detailed presentation. However, they were checked for answering if tin affects the eutectic reaction and if it is possible to predict from the cooling curve if a fully pearlitic matrix has been achieved.
By comparing cooling curves recorded on alloys 1 and 5 or 2 and 6, i.e. at nearly constant copper and manganese contents, it could be checked if the increase in tin content does affect the solidification reaction. The two series of records on alloys 1 and 5 cast in keel-blocks showed opposite trend, i.e. tin addition either increasing or decreasing the eutectic temperature. Records from keel-blocks cast with alloys 2 and 6 are illustrated in Figure 5 where it is seen that both the minimum eutectic temperature at the onset of the eutectic reaction and the plateau temperature for alloy 6 are higher by about 2 K than those for alloy 2. The other two keel-blocks cast with alloys 2 and 6 showed the same change. Owing to the discrepancy between these two series, it may not be concluded if and how tin affects the eutectic transformation.
Figure 6 shows the part of the cooling curves corresponding to the eutectoid reaction for alloys 1, 2 and 3 cast in TA cups (Fig. 6a) and in keel-blocks (Fig. 6b). Unless observed when both ferrite and pearlite appear in the matrix [7], there is one single peak on the derivative of the cooling curve during the eutectoid transformation of the alloys cast in TA cups. This peak may be related to nucleation and growth of pearlite and there is certainly no ferrite in the microstructure as confirmed by metallographic analysis, see below.
Fig. 4. Change in ferrite fraction with Sneq as observed on samples TA
cups from Pan et al. [5]
a fully pearlitic matrix. The base melts were obtained using a 100 kg medium frequency induction furnace (250 Hz, 100 kW). The charges consisted in ductile iron returns, steel scrap, graphite of purity better than 99%, FeSi master alloy (74.65 Si and 0.98 Al, wt.%), Cu of purity higher than 99.8%, FeMn master alloy (74.8 Mn, 2.13 Si, 5.49 C, 0.082 P and 17.3 Fe, wt.%) and Sn of purity higher than 99.9%. After melting, the temperature of the charge was increased to 1520-1530°C and 50 kg of metal was poured into a ladle. Material for spheroidization treatment had been positioned in the reaction chamber of the ladle before pouring, it consisted of 0.650 kg of FeSiMg (43.63 Si, 6.25 Mg, 1.06 Ca, 0.55 Al and 0.91 RE, wt.%) and was covered with 0.3 kg of steel scrap.
When the Mg-treatment reaction was finished, three stand-ard keel-blocks (UNE EN-1563 Type II), two standstand-ard TA cups and a sample for chemical analysis were cast. All keel-blocks and TA cups were inoculated adding 0.2% of a commercial inoculant (68.1 Si, 0.89 Al, 1.65 Ca, 0.45 Bi, 0.38 Ba and 0.37 RE, wt.%) in the moulds and cups before pouring. Two of the keel-blocks were equipped with a K-type thermocouple located at the geometrical centre. The third keel-block was removed from the mould little after solidification was completed so as it cooled down to room temperature under calm air.
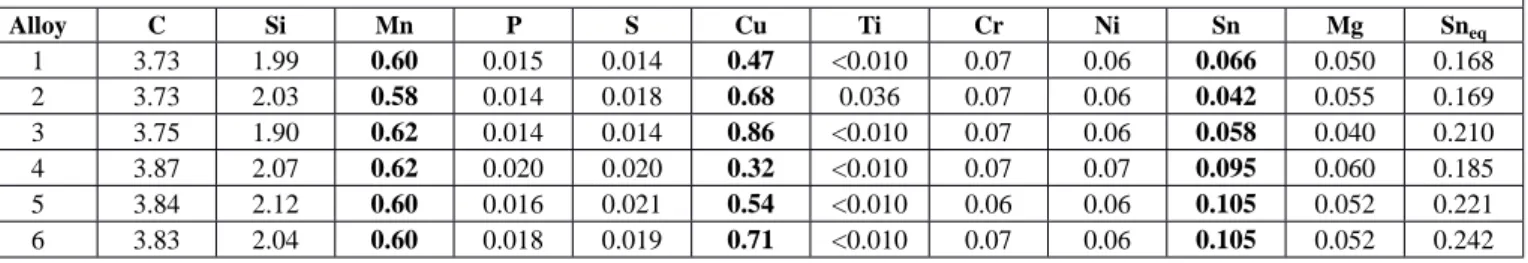
TABLE 1 Chemical analyses of the alloys prepared and values of Sneq (wt.%)
Alloy C Si Mn P S Cu Ti Cr Ni Sn Mg Sneq 1 3.73 1.99 0.60 0.015 0.014 0.47 <0.010 0.07 0.06 0.066 0.050 0.168 2 3.73 2.03 0.58 0.014 0.018 0.68 0.036 0.07 0.06 0.042 0.055 0.169 3 3.75 1.90 0.62 0.014 0.014 0.86 <0.010 0.07 0.06 0.058 0.040 0.210 4 3.87 2.07 0.62 0.020 0.020 0.32 <0.010 0.07 0.07 0.095 0.060 0.185 5 3.84 2.12 0.60 0.016 0.021 0.54 <0.010 0.06 0.06 0.105 0.052 0.221 6 3.83 2.04 0.60 0.018 0.019 0.71 <0.010 0.07 0.06 0.105 0.052 0.242
Fig. 5. Comparison of the cooling curves recorded with alloys 2 and 6 cast in TA cups and keel-blocks
Because the eutectoid reaction proceeds without marked recalescence when the same alloys are cast in keel-blocks, it is more difficult to ascertain the absence of ferrite in that case though only one transformation peak could again be seen. In such a case one could check the temperature at which the reaction started but this has some drawback as well. Indeed, while manganese and copper decrease both stable and meta-stable eutectoid temperatures (as clearly illustrated in Figure 6 for copper), tin does increase the temperature for the start of pearlite growth. This effect of tin has already been reported [5] and was verified again here where the increase from low
to high tin level increased the eutectoid temperature by more than 10 K. Use of temperature as a criterion could thus lead to misleading results.
4.2. Metallographic analysis
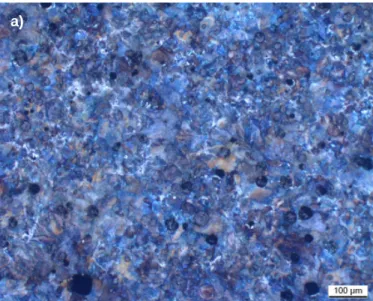
TA cup and keel-block samples were observed for metal-lographic analysis. In the TA cups, nodule counts were all found between 300 and 390 mm–2, with a nodularity higher than 90%. After etching with Nital, traces of ferrite could be found in the samples but alloys 2 and 4 that were totally pearlitic. Figure 7 illustrates the microstructure of alloys 2 and 3 cast in TA cups. Similar observations were made on keel-blocks (see Table 2), with nodularity higher than 90%, nodules counts slightly lower ranging from 230 to 320 mm–2, and at most 2% ferrite in the keel block of alloy 4 cooled in mould.
TABLE 2 Metallographic analysis of mould and air cooled
keel-blocks
Alloy Cooling Nodularity (%) N (mm–2) Ferrite (%)
1 Mould >90 276 0 Air >90 255 0 2 Mould >90 263 0 Air >90 286 0 3 Mould >90 248 0 Air >90 254 0 4 Mould >90 246 1-2 Air >90 229 0 5 Mould >90 268 1 Air >90 277 0 6 Mould >90 316 Traces Air >90 320 0
Fig. 6. Cooling curves and their derivative showing the peak associated to the eutectoid reaction when alloys 1, 2 and 3 are cast in TA cups (a) and keel-blocks (b). Note that the cooling rate curves have been shifted of arbitrary amounts in b for clarity (only the shape of the peak is of interest here)
4.3. Mechanical properties
The results of the mechanical tests are listed in table 3 for both mould and air cooled keel-block materials. The ultimate tensile strength (UTS), yield stress (Y) and Brinell hardness (HBW) have been all reported in Figure 8 with solid and open symbols for materials from mould and air cooled keel-blocks respectively. Values for air cooled keel-blocks are systematically higher than those for mould cooled keel-blocks. This improve-ment with the cooling rate is generally reported [5], although it has not been always observed [6]. It is most often associated with a decrease in the elongation at rupture E that appears to be limited in the present case (see Table 3).
TABLE 3 Mechanical properties of alloys cast in keel-blocks
Alloy Cooling UTS (MPa) YS (MPa) E (%) HBW
1 Mould 794 434 5.1 259 Air 987 564 5.1 307 2 Mould 816 449 5.8 265 Air 957 576 5.6 300 3 Mould 830 467 4.8 272 Air 985 664 2.9 326 4 Mould 752 445 4.4 263 Air 886 554 3.8 292 5 Mould 767 437 3.8 269 Air 889 563 2.4 307 6 Mould 790 441 5.0 245 Air 912 582 3.3 302
As the manganese content was nearly constant, the alloy series 1-3 and 4-6 show the effect of copper for each level of tin, respectively 0.04-0.06 wt.% and 0.10-0.11 wt.%. It is thus seen that copper does generally increase UTS, Y and HBW though this improvement is sometimes within the expected scattering of the results. Such an improvement is certainly due to pearlite refinement.
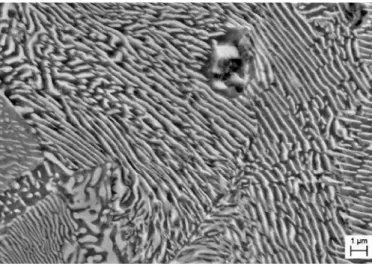
There is however a clear trend which is that the low tin content gives better results than the high one. Such a detrimental effect of tin on tensile properties and hardness has already been reported, and often associated to the appearance of Sn-bearing compounds in the last to solidify zones. In the present study, very few tin-bearing compounds were observed as illustrated in Figure 9.
5. Discussion
It was found that the results for mould cooled keel-blocks compared very well with those of Pan et al. for fully pearlitic
a) b)
Fig. 7. Micrographs of alloys 6 cast in TA cup (a) and keel-block (b)
Fig. 8. Values of UTS, YS and HBW for the six alloys investigated. Solid and open symbols refer to mould and air cooled keel-blocks respectively
matrix [5], though the range of silicon content of the alloys differ slightly, being 1.9-2.12 wt.% in the present work and 2.09-2.55 wt.% in the study by Pan et al. Accordingly, it appeared of in-terest to compare the present results with the whole set of data from these authors. This has been made by reporting in Figure 10 the mechanical properties with respect to the Sneq defined above. In every graph of Figure 10, the interrupted line is the same as in Figure 4 and thus indicates when a fully pearlitic matrix structure is achieved. The data of Pan et al. have been reported differentiating series with (solid symbols) and without (open symbols) tin added.
In Figure 10a, it is seen that a huge scattering in the UTS values exists when the matrix is fully pearlitic. As a matter of fact, it is easily seen that the higher the tin content the lower the UTS value is for each series of data (Pan’s one and from the Fig. 9. Micrograph of alloy 5 cast in keel-block (FEG-SEM)
Fig. 10. Comparison of the room temperature mechanical results from the present study (mould cooled materials) to those from Pan et al. for as-cast keel-blocks legs [5]: a) UTS; b) YS; c) HBW; and d) E. Data reported versus Sneq
present work). Further, looking at the results of the series H of Pan, that contains manganese and tin but no copper, it is observed that the detrimental effect of tin shows up even at values lower than the critical Sneq value with a clear decrease of UTS that has often been reported [6]. In the present work, increase in copper content does increase UTS beyond the critical Sneq value though the results are negatively affected when compared to Pan et al.’s data without tin (series A, B and C). That the results of these authors for alloys with tin are lower than those of the present work could possibly be related to nodule count, that was much smaller in Pan et al.’s work, and to the possible presence of larger amounts of Sn-bearing compounds than observed here. Whatever the reason, these results suggest strongly to use as few tin as possible and to add copper for increasing UTS values.
The same scattering is observed in case of Y as seen in Fig-ure 10b, thought with much less evidence if we restrict to Pan’s data. It is observed that the present results show systematically lower Y values, and this may be related to the procedure used to determine yield strength.
The results concerning HBW in Figure 10c show that cop-per keeps increasing hardness beyond the critical Sneq value. The results by Pan et al. show that much higher hardness is achieved if this alloying element is not employed alone. It is of particular interest to note that the present results are right in line with those of the series C of Pan et al. that contained the same amount of manganese.
As seen in Figure 10d, results by Pan et al. suggest that tin should be totally avoided if elongation at rupture is a concern. The results of the present work do show that some ductility may be maintained even when tin has been used, and this may be related again to the higher nodule count achieved in the present study.
6. Conclusion
Considering the different pearlite promoter capability of manganese, copper and tin, it seemed of interest to study their cooperative effects with the aim at finding an optimum combi-nation of their contents. In this preliminary work, a rather high level of manganese (0.6 wt.%) was selected and alloys were cast with two levels of tin and various contents in copper so as to obtain fully pearlitic structures in the as-cast condition. As a matter of fact, the six alloys studied in this work showed only traces of ferrite when cast in TA cups and a maximum amount of 1-2% ferrite when cast in keel-blocks.
Thermal analysis was inconclusive as concerns a possible effect of tin on the eutectic reaction at the levels it was added. More interestingly, fully pearlitic matrices correspond to deriva-tive of the thermal records that show one single peak during the eutectoid transformation, in contrast with the two overlapping peaks observed when ferrite and pearlite precipitate successively. Pearlite transformation is further associated with the appearance of recalescence in TA cups records that should be preferred for predicting matrix structure.
The two cooling conditions managed in the case of the keel-blocks (mould and calm air cooling) have shown to have a strong influence on the mechanical properties. Faster cool-ing rate increases UTS, Y and HBW with limited reduction in elongation at rupture. This is certainly related to refinement of pearlite as could also be the effect of copper. The negative effect of tin could possibly be related to the formation of Sn-bearing compounds though very few of them could be identified in the materials observed during this study.
Finally, the use of tin equivalent allowed rationalizing the effect of alloying on ferrite (or pearlite) fraction and proved use-ful for synthesizing results on mechanical properties.
Acknowledgments
The authors would like to thank the S.L.U. TQC for all the collaborating efforts made in the experimental tests. This paper was originally presented at the WFC-2012 congress in Monterrey (Mexico); the World Foundry Association is acknowledged for authorization to make it available to a larger audience.
REFERENCES
[1] T. Levin, P.C. Rosenthal, C.R. Loper, AFS Trans. 79, 493 (1971). [2] L.A. Neumeier, B.A. Betts, D.H. De Sy, AFS Trans. 82, 131 (1974). [3] B.V. Kovacs, AFS Trans. 89, 79 (1980).
[4] M.J. Lalich, C.R. Loper, AFS Trans. 81, 217 (1973). [5] E.N. Pan, M.S. Lou, C.R. Loper, AFS Trans. 95, 819 (1987). [6] L. Guerin, M. Gagné, The Foundryman 80, 336 (1987).
[7] J. Sertucha, P. Larrañaga, J. Lacaze, M. Insautsti, International Journal of Metalcasting 4, 1, 51 (2010).
[8] J. Serrallach, J. Lacaze, J. Sertucha, R. Suárez, Proceedings of the conference “Science and Processing of Cast-Irons IX”, Key Engineering Materials 457, 361 (2011).
![Figure 1 shows the effect of manganese on the ferrite frac- frac-tion from Kovacs [3], and Pan et al](https://thumb-eu.123doks.com/thumbv2/123doknet/3042472.85741/3.892.463.825.401.755/figure-shows-effect-manganese-ferrite-frac-frac-kovacs.webp)