HAL Id: tel-00613174
https://pastel.archives-ouvertes.fr/tel-00613174
Submitted on 3 Aug 2011
HAL is a multi-disciplinary open access
archive for the deposit and dissemination of sci-entific research documents, whether they are
pub-L’archive ouverte pluridisciplinaire HAL, est destinée au dépôt et à la diffusion de documents scientifiques de niveau recherche, publiés ou non,
Position-based Vehicular Communication for Intelligent
Transport Systems
Nestor Mariyasagayam
To cite this version:
Nestor Mariyasagayam. Position-based Vehicular Communication for Intelligent Transport Systems. Computer Science [cs]. Ecole Polytechnique X, 2011. English. �tel-00613174�
Thèse présentée pour obtenir le grade de
DOCTEUR DE L’ECOLE POLYTECHNIQUE
en Informatique
par
Marie Nestor MARIYASAGAYAM
Communication Véhiculaires par
géolocalisation pour Systèmes de
Transports Intelligents
Soutenue le 27 Juin 2011 devant le jury composé de:
Lila BOUKHATEM
Université Paris-Sud XI
Président
Sidi Mohammed SENOUCI
Université de Bourgogne, ISAT Nevers
Rapporteur
Philippe JACQUET
INRIA Rocquencourt
Directeur de thèse
Massimiliano LENARDI
Hitachi Europe
Co-directeur de thèse
Thesis for the degree of
DOCTEUR DE L’ECOLE POLYTECHNIQUE
in Computer Science
submitted by
Marie Nestor MARIYASAGAYAM
Position-based Vehicular
Communication for Intelligent
Transport Systems
Defended on the 27th June 2011
Jury members:
Lila BOUKHATEM
Université Paris-Sud XI
President
Sidi Mohammed SENOUCI
Université de Bourgogne, ISAT Nevers
Reviewer
Philippe JACQUET
INRIA Rocquencourt
Thesis director
Massimiliano LENARDI
Hitachi Europe
Thesis co-director
ACKNOWLEDGEMENTS
First and foremost, I present my sincere gratitude to Philippe Jacquet (Research director, INRIA), for
taking prime responsibility of being my thesis director and guide.
I express my profound gratitude and thanks to Massimiliano Lenardi (Lab manager, ICTL Hitachi) for
extensive support and research guidance from industry perspective.
My heart-felt thanks to Sidi Mohammad Senouci and Lila Boukhatem, for their valuable time to review
the manuscript and taking part in the Jury.
Sincere thanks to Thomas Clausen (LIX, Ecole Polytechnique) for his keen interest and expertise
throughout this venture.
I am grateful to both, Beatrice Dessus (Hitachi ICTL) and Lydie Fontaine (Retd. LIX, Ecole
Polytechnique), for their brilliant support in administrative affairs.
Thanks to all my colleagues of Hitachi ICTL: Lan Lin, Yuki Horita, Andrea Tomatis and Laurens Hobert -
for their continuous encouragement. Also, I extend my thanks to my collaborators at Hitachi Yokohama
research lab, Japan.
I also take this opportunity to thank former members of Hitachi ICTL, especially Stephane Amarger -
for initiating this collaboration with LIX, Ecole Polytechnique, Hamid Menouar, Vineet Kumar and
Damien Auroux - for their fruitful discussion.
Many thanks to colleagues at LIX: Ulrich Herberg, for forwarding Ph.D. comics and providing computer
science expertise; Juan Antonio for global political analysis and mathematical modeling; and Emmanuel
Baccelli, for valuable over-the-lunch discussions. They made my stay at LIX, a fruitful one.
I am duly thankful to Valerie Lecomte and Christine Ferret for their timely help to arranging my
defense at Ecole Polytechnique.
Finally, I owe my loving thanks to my wife and my parents for their patience and prayers.
Marie Nestor MARIYASAGAYAM
27 June 2011
Resumé
Des charrettes de la civilisation ancienne au Véhicule Utilitaire Sportif (VUS) actuels, la dépen-dance de l’homme pour les véhicules reste incontournable. Les avancements rapides des infras-tructures de transport aujourd’hui, couplé au désir de voyager de plus en plus rapidement, conduisent à de graves problèmes de transport: accidents, pollution et embouteillages. Afin de réduire ces problèmes et augmenter la capacité de l’infrastructure actuelle, plusieurs approches ont été proposées. Les résultats se présentent, d’une part, sous forme de panneau à message variable qui affiche la situation du trafic aux conducteurs sur la route ; d’ autre part, sous forme de dos d’âne pour la prévention des accidents en réduisant la vitesse des conducteurs dans les zones urbaines ; et enfin sous forme de décisions gouvernementale permettant de lutter contre la pollution en interdisant, les jours de forte pollution, l’accès au centre-ville pour les véhicules avec des numéros immatriculés pair ou impair.
A la fin du XXe siècle, des efforts considérables sont apparus pour introduire l’intelligence dans les systèmes de transport. Afin de s’adapter à la complexité du système de transport, cela constitue un des facteurs déterminants pour une action durable et plus efficace. Au début, les initiatives se sont limitées au niveau de la télésurveillance sur les incidents de la circula-tion à l’aide de caméras pour en informer les utilisateurs via des panneaux à messages. Peu après, avec l’avènement de la communication sans fil, le monde a ouvert ses portes en direc-tion de la recherche sur la communicadirec-tion inter-véhiculaires. Plus précisément, en permettant aux véhicules de détecter et de communiquer automatiquement sur les incidents de trafic avec d’autres véhicules on peut atteindre une connaissance étendue sur la situation de la circula-tion locale autour du conducteur. C’est un facteur très important pour l’installacircula-tion efficace du Système des Transports Intelligent (STI). A l’heure actuelle, le principal défi est d’exploiter et utiliser efficacement la communication entre les véhicules afin de réduire, sinon éliminer com-plètement, les problèmes précités: accidents - par le biais de la sécurité active ; la pollution et les embouteillages - grâce à la fluidité du trafic et en guidant les conducteurs des transports à emprunter des itinéraires qui permettent d’économiser la consommation d’énergie et réduire les émissions.
Cette thèse présente un élément important qui réalise le déploiement d’une STI à grande échelle: la communication entre les véhicules sur la route. Ce manuscrit est consacré au développe-ment d’un algorithme de diffusion “Multi-Hop Vehicular Broadcast”(MHVB), en utilisant la localisation de véhicules pour permettre la communication entre les véhicules.
Abstract
From the bullock carts of the world’s earliest civilizations to the SUVs of the present, human dependence on vehicles for transportation remains unavoidable. The rapid growth of trans-portation facilities today, coupled with an ever-increasing human desire to travel quicker, lead to many serious transportation problems: accidents, pollution and traffic-jams. In an effort to alleviate these problems, various approaches to support the underlying transport system have been proposed. Outcomes of the effort exist in the form of: variable message sign – displaying traffic situation to the drivers on highway, speed bumps – preventing accidents by cutting down the high-speed drivers in urban areas, and randomly forbidding odd or even license-plated cars to enter city centres on a highly polluted day in order to control pollution.
In the latter part of the twentieth century, efforts to introduce intelligence into transportation systems, were considered one of the prime factors for sustainability of the existing transport infrastructure. Initially, the efforts were restricted to manual surveillance level – using cam-eras and informing users via message signs about traffic incidents. Eventually, with the advent of wireless communication, research on leveraging wireless communication between vehicles be-gan. By enabling vehicles to detect and communicate, about traffic incidents, with other vehicles, a geographically localized and de-centralized awareness about traffic situation can be achieved and is therefore an important factor for the deployment of a large-scale Intelligent Transport Sys-tem (ITS). The prime challenge today is to enable efficient and reliable communication among vehicles, in order to reduce, if not entirely remove, the aforementioned problems: accidents – through active safety; pollution and traffic-jams – through fluid traffic flow and by guiding transport users to take routes that save cost and emission.
The purpose of this manuscript is to provide a component for realizing the deployment of large-scale ITS: communication between moving vehicles on land. More specifically, this manuscript is dedicated to the development of a broadcast algorithm “Multi-Hop Vehicular Broadcast” (MHVB), using location information of vehicles.
Contents
1 Introduction to Intelligent Transport Systems 14
1.1 Present Developments Towards ITS . . . 16
1.1.1 ITS in Japan . . . 16
1.1.2 ITS in USA . . . 17
1.1.3 ITS in Europe . . . 17
1.2 Currently Available Technologies to assist ITS . . . 18
1.2.1 Sign-based Communication . . . 19
1.2.2 Satellite Communication . . . 19
1.2.3 Terrestrial Radio Broadcast . . . 19
1.2.4 Dedicated Short-Range Communications . . . 20
1.2.5 Cellular Mobile Communication . . . 20
1.2.6 Image Recognition . . . 20
1.3 Enhancing ITS services using Vehicular Communication . . . 21
1.4 Socio-Economic Impact of ITS-based Vehicular Communication . . . 23
1.5 Broadcasting ITS events using Mobility Information of Vehicles . . . 24
1.6 Summary . . . 28
2 Multi-hop Vehicular Communication for ITS 29 2.1 Radio Characteristics of Vehicular Networks . . . 30
2.1.1 Radio Range . . . 30
2.1.2 Causes of Radio Irregularity . . . 31
2.1.3 Impact of Radio Irregularity . . . 31
2.1.4 Interference Computation and Signal Reception . . . 32
2.2 Node Characteristics in a Vehicular Network . . . 32
2.2.1 Node Speed . . . 33
2.2.2 Node Mobility Pattern . . . 33
2.2.3 Node Density . . . 33
2.3 Flooding in Vehicular Networks . . . 34
2.3.1 Probabilistic Methods . . . 36
2.3.2 Counter-Based Methods . . . 36
2.3.3 Coverage-Based Methods . . . 37
2.4 Exploiting Location Information for Flooding in Vehicular Networks . . 38
2.5 Functional Requirements for ITS Event Dissemination Algorithms . . . 39
2.6 Summary . . . 40
3 E cient Flooding in Vehicular Networks 42 3.1 Location Specific Forwarding . . . 42
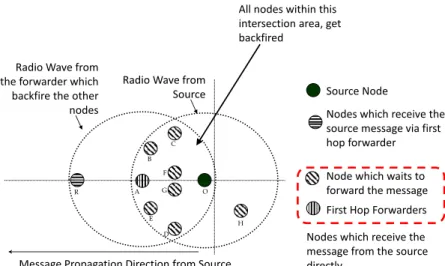
3.2 Backfire - Controlling Redundant Receptions . . . 44
3.3 Dynamic Scheduling - Decreasing Delay . . . 47
3.4 Controlling Event Dissemination Frequency - Reducing Bandwidth Uti-lization . . . 48
3.5 Adaptive Backfire - Increasing Connectivity . . . 50
3.6 Summary . . . 50
4 MHVB Protocol Speci cation for Location-based Flooding 52 4.1 Packet Format . . . 52 4.2 Configuration . . . 54 4.3 Transmission of MHVB packet . . . 54 4.3.1 Jitter . . . 55 4.4 Processing MHVB packet . . . 56 4.5 Determining Backfire . . . 59
4.6 Triggering Dynamic Scheduling . . . 59
4.7 Summary . . . 60
5 ITS-Speci c Quantitative Evaluation of Position-Based Broadcast Protocols 61 5.1 Mobility Scenarios . . . 62
5.2 Chosen Protocols . . . 64
5.3 Simulation Settings . . . 65
5.4 Performance evaluation of MHVB protocol under ITS requirements . . . 66
5.5 Impact of Defer Times on Packet Re-transmission . . . 69
5.6 Packet Freshness . . . 72
5.7 Performance of Individual Components of MHVB . . . 74
5.7.1 Performance of Sectoral Backfire . . . 75
5.7.3 Impact of Varied Relative Speed between Lanes . . . 77
5.7.4 Varied Application Requirements . . . 78
5.8 Summary . . . 81
6 Securing Position-based Vehicular Communication for Intelligent Transport Systems 82 6.1 Attack Possibilities on ITS event dissemination . . . 83
6.1.1 Identity-based attacks . . . 83
6.1.2 Attacks on ITS data validity . . . 83
6.1.3 Mobility Data Manipulation . . . 84
6.2 Analysis of Position-based Attack . . . 84
6.3 Counter-measures . . . 87
6.3.1 Detection and Fusion – Trust Evaluation . . . 88
6.3.2 Trustworthiness Sensors . . . 89
6.3.2.1 Basic-trust Sensor – Prior Trust . . . 89
6.3.2.2 Reception Range Threshold . . . 90
6.3.3 Trust Decision – Handling False Data . . . 91
6.4 Summary . . . 92
7 Conclusion 93
List of Figures
1.1 Multi-point relay . . . 25
1.2 Nodes can use their location information and the location of the event in the message to determine whether or not to forward a message . . . 26
1.3 Encoding location information of the original sender in a message, en-ables receiving nodes to calculate their relative distance from the source. Depending on the chosen ITS event, the nodes may decide to stop for-warding a message, if the distance from the source is considered irrele-vant for such an event e.g. traffic jam. Traditional hop-count metric does not work in this case. . . 27
2.1 Vehicular Communications - V2X involves a combination of V2V and V2I 30 3.1 Geographically restricted flooding is achieved by making nodes drop packets beyond the forwarding area. The forwarding area is determined by the ITS application running on top of MHVB protocol. . . 43
3.2 Illustration of coverage gain when a node farther away from a sender transmits. . . 44
3.3 Variations in backfire mechanism. . . 46
3.4 Dynamic Scheduling: Every node which receives a packet from the sender set a waiting time inversely proportional to the distance from the sender, except node A. . . 47
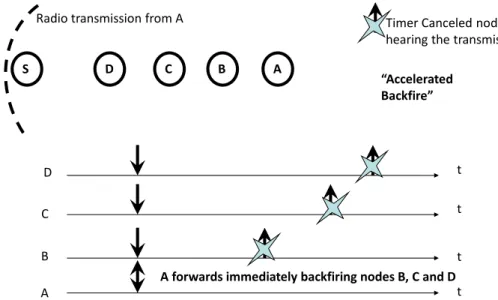
3.5 Accelerated Backfire: Immediate forwarding from node A provides a sort of accelerated backfire. . . 48
3.6 Adaptive Forwarding Mechanism . . . 51
4.1 MHVB Packet Format. . . 52
4.2 Packet Transmission . . . 54
4.4 Scheduling of Packet retransmission: Node C receiving a duplicate trans-mission, of node A’s packet, from node B will discard its scheduled timer
for the corresponding re-transmission of the packet from A. . . 58
4.5 Computing backfire angle . . . 59
5.1 Random Waypoint Scenario. . . 62
5.2 Single Lane Model. . . 63
5.3 Road Scenario with intersection. . . 63
5.4 Ideal Application requirement. . . 67
5.5 Algorithm Efficiency under ITS requirements; low density N = 20 nodes per sq. km. . . 68
5.6 Algorithm Efficiency under ITS requirements; moderate density N = 50 nodes per sq. km. . . 68
5.7 Algorithm Efficiency under ITS requirements; high density N = 80 nodes per sq. km. . . 69
5.8 Retransmission Ratio as a function of distance from sender node of an ITS event: low density N = 20 nodes per sq. km. . . 70
5.9 Retransmission Ratio as a function of distance from sender of an ITS event: moderate density N = 50 nodes per sq. km. . . 70
5.10 Retransmission Ratio as a function of distance from sender of an ITS event: high density N = 80 nodes per sq. km. . . 71
5.11 Mean packet delay: low density N = 20 nodes per sq. km. . . 72
5.12 Mean packet delay: moderate density N = 50 nodes per sq. km. . . 73
5.13 Mean packet delay: high density N = 80 nodes per sq. km. . . 74
5.14 Performance of Sectoral Backfire on Random Waypoint model. . . 75
5.15 Performance of Sectoral Backfire: VANET scenario with intersections. . . 75
5.16 Performance of Dynamic Scheduling: Single Lane scenario - No node movement. . . 76
5.17 Performance of Dynamic Scheduling: VANET scenario with intersections. 77 5.18 Speed performance: Highway Scenario with intersection . . . 78
5.19 Urban scenario with intersections: With and without dynamic scheduling. 79 5.20 Varied application requirements on a single lane scenario: With and with-out dynamic scheduling. . . 80
5.21 Basic Performance of Dynamic Scheduling on a single lane scenario. . . 80
6.1 Impact of different attackers on MHVB goodput without plausibility con-trol. (a) single lane scenario (b) highway scenario . . . 86
6.2 Using plausibility mechanisms to improve goodput. (a) single lane sce-nario (b) highway scesce-nario . . . 87 6.3 Data flow in the sensor fusion framework . . . 88 6.4 Reception probability sensor: (a) Overview (b) Probability of reception
List of Tables
5.2 MHVB protocol parameters . . . 65 5.1 NS-2 parameters . . . 65 6.1 Attacker framework configuration parameters for OFFSET attacker . . . 85
Glossary
ADAS Advanced Driver Assistance Systems
AMTICS Advanced Mobile Traffic Information and Communication System ART Acceptance Range Threshold
ASV Advanced Safety Vehicle
C2C-CC Car-to-Car Communication Consortium
DriveC2X Driving implementation and evaluation of C2X communication technology DSRC Dedicated Short-Range Communications
ECDSA Elliptic Curve Digital Signature Algorithm FESTA Field opErational teSt supporT Action FOTs Field Operational Tests
GNSS Global Navigation Satellite Systems GPS Global Positioning System
ISM Industrial, Scientific and Medical
ISTEA Intermodal Surface Transportation Efficiency Act ITS Intelligent Transportation System
IVHS Intelligent Vehicular Highway Systems MGT Mobility Grade Threshold
NAHCS National Automated Highway System Consortium
PROMETHEUS Program for European Traffic with Efficiency and Unprecedented Safety RACS Road Automobile Communication System
RDS Radio Data System RSU Road Side Unit SUV Sports Utility Vehicle TMC Traffic Message Channel
V2X Vehicle-to-Vehicle and/or Vehicle-to-Infrastructure VICS Vehicle Information and Communication System VMS variable message sign
Manuscript Organization
Chapter 1 is dedicated to description of Intelligent Transport Systems (ITS). The factors motivating the use of vehicular communication are presented. In order to enhance the capacity of existing transport systems - and the specific role played by vehicular communication within ITS are also explained.
Chapter 2 describes essentials of multi-hop networks and shows how existing commu-nication protocols can be re-used and adapted to enable Vehicular Commucommu-nication for ITS.
Chapter 3 develops a Multi-hop Vehicular Broadcast (MHVB) algorithm, and describes its operating principles w.r.t. ITS event dissemination in a vehicular network. The contents of the chapter are published in [1, 2].
Chapter 4 provides a specification of MHVB algorithm ( presented in chapter 3), for transporting ITS events across a vehicular network. Some contents of the chapter are published in [1, 3, 2].
Chapter 5 evaluates the algorithm with respect to existing flooding algorithms. The individual components of the algorithm are also evaluated. The contents of the chapter are published in [1, 3]
Chapter 6 analyzes the impact of position faking attacks on a position-based broadcast protocol involving local geographic dissemination. The contents are published as book chapter in [4].
1 Introduction to Intelligent Transport
Systems
Wouldn’t it be great to drive our cars smoothly to our destinations without having to stop at traffic lights? To have our car detect the traffic signal state and the speed of the vehicles ahead of us and, as if by magic, adjust the speed of our vehicle appropriately within zone speed limits, clear respective intersections without having to stop waiting for the light to change and get us to our destinations rapidly and safely?
Vehicles stopped at intersections are considered the worst polluters on the roads [5], and thus by coordinating the vehicle speed such that such stops are avoided or reduced, contributes significantly to decreasing pollution and at the same time decreasing travel time, resulting in both ecological and economical gain.
Drastic steps are already taken by governments and automobile manufacturers in dif-ferent parts of the world to control pollution by promoting the usage of eco-friendly vehicles [6], by giving benefits to consumers, in form of lesser carbon taxes and lower insurance premiums. Besides governments, major parcel-carrier companies implement a "no-left-turn" [7] policy for their carriages in order to avoid left turns at intersections and thus reduce idling - which in turn lowers fuel consumption.
People are slanted towards their personal economic welfare [8, 9], rather than ecological welfare - and it is worthwhile to note that the financial gain received by drivers will be the driving force for a rapid deployment and the betterment of ITS in today’s world. Vehicles are used as means of carriage to transport passengers and goods, from one place to another. There are three major modes of transportation: land, air and sea. Land-based vehicles have the major share compared to the ships and airplanes [10, 11, 12] among the transport vehicles in the globe. The larger a system is, the more complex it becomes to maintain. People form one of the major components that control the transport system. To maintain such a highly complex system, co-operation from automobile drivers is required - and this is difficult because many drivers (i) are
self-centered, (ii) don’t think alike and (iii) may not be able to take all the parameters into consideration when faced with a real-time task: driving their vehicles [13, 14].
Statistics on traffic fatalities show that every year, over 40,000 cases are reported in Western Europe, a similar number in the U.S., over 6,000 in Japan, and over a million worldwide [15]. In addition, traffic congestion incurs further economic loss. For exam-ple, the Texas Transportation Institute estimated that, in 2000, the 75 largest metropoli-tan areas experienced 3.6 billion vehicle-hours of delay, resulting in 21.6 billion litres in wasted fuel and $67.5 billion in lost productivity [16]. Economic loss accompanies human loss as well, eventually posing a threat to the safety and the sustainability of transportation system.
At present, technologies based on standalone systems are relied upon for traffic and fuel efficiency. People use navigation devices to find routes easily to a new destination. In addition to route guidance, these devices [17] provide the most efficient route to a destination by calculating route based on actual or statistical speeds driven on roads, rather than simply speed limits. For the consumer using such a navigation device, it results in a better fuel economy on a day-to-day basis. With constant use of such devices, the money invested in having them, is easily harvested back within a short duration of time [18]. All these technologies project - an individualistic view - to form a reliable, efficient and ecological system.
Another example, of human reliance on the standalone technology, is the use of ve-hicles driven with a hybrid engine, to attain better fuel economy. When the first hy-brid vehicles came out in 1997, they were considered un-necessary due to the low cost of oil at that time. This situation did not last long. Fuel prices started to in-crease rapidly [19] and vehicle manufacturers realized the importance [20] of hybrid technology. Such technology was then promoted under various green car programmes [18, 21, 22] and governments supported such programmes under various energy policy acts [23, 24, 25, 26]. Car makers and governments have realized that people act eco-logically when they see a direct, individual (economic) gain for doing so. In a similar manner, to realize an integrated ITS system with wide support and collective advan-tage, the individual benefits to the driver, in participating to such a system, should be made clear.
1.1 Present Developments Towards ITS
The term Intelligent Transport System [27] (ITS) captures an advanced information and telecommunications network for users, roads and vehicles, in order to improve safety and reduce vehicle wear, transportation times, and fuel consumption. Thus, ITS aims to improve the efficiency and safety of transport systems, while making road networks less congested and less polluting. Vehicles form one of the major components of ITS [28], a betterment of the transport system, in terms of safety and efficiency can be achieved [15]. In order to understand the scope of vehicular communication within ITS, it is necessary to understand the historical contribution from the major players of ITS, and their evolution towards building an intelligent transport system.
1.1.1 ITS in Japan
In Japan, in the late 1980’s the Public Works Research Institute of the Ministry of Con-struction initiated development of a Road Automobile Communication System (RACS) [29] under a joint research program with 25 private companies. The subject of the devel-opment project was to establish the following systems using roadside transmitting bea-cons: a navigation system, an information system, and an individual communication system. Followed by RACS, steps were taken to integrate traffic information and route guidance into the navigation systems, under a project named AMTICS - Advanced Mo-bile Traffic Information and Communication System [30]. The project demonstrated a system, which displayed on a screen in each vehicle, traffic information such as con-gestion, regulations in force, road work, and parking in real time, and also the vehicle’s present position and its route. At the Exhibition of Flowers and Greenery in April, 1990 in Osaka, taxis, shuttle buses - and trucks as well as passenger cars, were equipped with AMTICS to demonstrate its applicability. In the spring of 1996, VICS (Vehicle In-formation and Communication System) [31] demonstrated driver inIn-formation services including dynamic route guidance and ASV (Advanced Safety Vehicle), aiming to pro-vide active safety for passenger cars.
Experiments related to Automated Highway Systems have been conducted since 1995 on a test track and an expressway - and cooperative driving, with inter-vehicle com-munication, was tested in the spring of 1997 [32]. Besides government projects, navi-gation systems have become widespread, and inter-vehicle distance warning systems for trucks and an intelligent cruise control system for passenger cars have become com-mercially available [33, 34]. At present, co-operative communication between vehicles
[32] is considered an important step towards building an integrated ITS efficiently, and to secure expandability of the system [27].
1.1.2 ITS in USA
The Intermodal Surface Transportation Efficiency Act of 1991 (ISTEA) [35] established a Federal program to research, develop, and operationally test, Intelligent Transport Systems and to promote their implementation. The program was designed to facili-tate deployment of technology to enhance efficiency, safety, and convenience of surface transportation, resulting in improved traffic flow, saved lives and time, and increased productivity. Before that, the Mobility 2000 team laid the groundwork for the formation of Intelligent Vehicular Highway Systems (IVHS) [28]. To further demonstrate fully au-tomated test vehicles, a key project called the Auau-tomated Highway System (AHS) was carried out in the early 90’s by the National Automated Highway System Consortium (NAHCS) [36].
The strategic research plan [37] of ITS-USA in the next five years includes to: 1. Reduce highway crashes and their tragic consequences
2. Enable vehicles of all types to predict state of the traffic signals, to eliminate un-necessary stops and help people drive in the most fuel efficient manner.
3. Enable travelers to get accurate travel time information about all modes and route options and the potential environmental impacts of their choices.
4. Provide data to transportation managers, to accurately assess multi-modal trans-portation system performance.
The plan explores the transformative capabilities of wireless technology to make sur-face transportation safer, smarter and greener. The core of the research plan is a pro-gram called IntelliDriveSM[38], a multimodal initiative that aims to enable safe, interoperable wireless connectivity between vehicles, infrastructure and passengers’ devices to sup-port safety, mobility and environmental enhancements.
1.1.3 ITS in Europe
The PROMETHEUS (Program for European Traffic with Efficiency and Unprecedented Safety), initiated by the European car manufacturing industry, was the key starting step towards ITS in Europe [39]. As an initiative to make autonomous driving possible, in
1986 the Robot Car "VaMoRs" [40] demonstrated to drive all by itself on a street cleared of traffic for safety reasons.
To bring intelligence into transportation system, for people and goods across Europe, ERTICO [41], the network of Intelligent Transport Systems and Services stakeholders in Europe, is active in the following sectors as defined in [42]:
• Safe Mobility oriented towards zero accidents
• Co-operative Mobility oriented towards fully connected vehicles and infrastruc-ture
• Info Mobility oriented towards fully informed people
• Eco Mobility oriented towards a reduced impact on the environment
Field Operational Tests (FOTs) have been introduced by ERTICO as an evaluation method for driver support systems and other functions to demonstrate that such systems can deliver real world benefits. The FESTA (Field opErational teSt supporT Action) con-sortium issued a handbook [43] to provide guidelines for the conduction of FOTs. This handbook provides an overview of the whole process of planning, preparing, execut-ing, analyzing and reporting an FOT, and also gives related information regarding ad-ministrative, logistic, legal and ethical issues. The results of this project are monitored and considered by FOT related projects in Europe, eg., DriveC2X [44] develops a de-tailed system specification and a functionally verified prototype to be used in future field operational tests.
1.2 Currently Available Technologies to assist ITS
Intelligent Transport Systems (ITS) includes types of communications in vehicles, be-tween vehicles (e.g. to-car), and bebe-tween vehicles and fixed locations (e.g. car-to-infrastructure). Communication lies at the core of an ITS system [45], and the sys-tem architecture must meet a set of contrasting functional requirements, as imposed by the ITS system. The communication technology used should ensure adequacy with respect to critical services such as icy-road warning, fog warning, traffic-jam pile-up prevention, et cetera. In this section, currently available technologies to assist ITS are discussed.
1.2.1 Sign-based Communication
A variable message sign (VMS) [46], can be seen as one of the initial steps to bring intelligence to the transport system. It is an electronic traffic sign used on highways to give travelers information about special events. These signs alert drivers about traffic congestion, accidents, incidents, roadwork zones, or speed limits on a specific highway segment. They act as route guidance systems, suggesting drivers to take alternative routes, limit travel speed, warn of duration and location of incidents or just inform of the actual traffic conditions [47]. In some places, signs are set up with permanent, semi-static displays indicating predicted travel times to important traffic destinations such as major cities or interchanges along the route. As a proof of its longevity, these signs were widely introduced in France in the early 90’s under President François Mitterrand, and are, essentially, unchanged today.
1.2.2 Satellite Communication
Global Navigation Satellite Systems (GNSS) [48, 49, 50, 51] provide autonomous geo-spatial positioning with global coverage. GNSS allows small receivers to determine their location (longitude, latitude, altitude) to within a few meters using time signals transmitted along a line-of-sight by radio from satellites. With the help of such devices, users can easily navigate to their destinations by matching their location on a map. Examples of GNSS include the NAVSTAR Global Positioning System [52] (GPS) of USA, the Russian GLONASS [53], the European Union’s Galileo positioning system [54] and the People’s Republic of China’s Beidou navigation system [55]
1.2.3 Terrestrial Radio Broadcast
Radio Data System, or RDS, is a communication protocol standard for embedding small amounts of digital information in conventional FM radio broadcasts, [56, 57] for deliv-ering traffic and travel information to drivers. It is typically digitally coded using the FM-RDS system on conventional FM radio broadcasts. It allows access to accurate, timely and relevant information [58], in the language chosen by the user. Services, both public and commercial, are operational in many countries worldwide. RDS is also used for the digitally coded Traffic Message Channel (TMC), which is widely introduced all over Europe within funded European Union projects [59]. RDS-TMC is nowadays gen-erally used by GPS navigational devices, that use the TMC messages also for dynamic
re-routing [17].
1.2.4 Dedicated Short-Range Communications
Dedicated Short-Range Communications (DSRC) provide communications between a vehicle and the road-side units in specific locations, for example toll plazas. DSRC operates on radio frequencies in the 5.9 GHz Industrial, Scientific and Medical (ISM) band. This can be used to support specific Intelligent Transport System applications such as Electronic Fee Collection [60].
1.2.5 Cellular Mobile Communication
A cellular network [61] is a radio network made up of a number of radio cells (or just cells), each served by at least one fixed-location transceiver known as a cell site or base station. These cells cover different geographic areas, and can be combined to provide radio coverage over a wider area than the area of one cell. A variable number of portable transceivers can be used in any one cell and moved through more than one cell during transmission. GSM [62] and UMTS [63, 64] are typical examples of such a cellular network, These systems have an advantage in coverage e.g., the GSM network has full coverage of roads in many countries, and hence can be used to assist ITS in areas of sparse vehicular traffic e.g, fog or ice warning to vehicles on a rural road with low vehicular traffic flow. On the other hand, these systems are centralized and using them for enabling life-saving ITS services such as collision avoidance, etc., requires a minimal delays in the order of milliseconds. Therefore, it is difficult to achieve a large-scale deployment of ITS, using only centralized communication system such as GSM / UMTS, especially when low latency is a prime requirement [32] for critical ITS services.
1.2.6 Image Recognition
Image recognition [65] involves extraction of information from images in order to re-duce driver errors and thereby enhance the efficiency of traffic and transport safety. They can be applied to assist the driver in the following situations:
• Blind-spot detection
• Lane Departure Warning System • Adaptive Cruise Control
• Forward Collision Warning • Event Video Recoding
• Auto Parking Guideline System • Parking Assistance System
• Driver Fatigue Warning System and • Road Sign Recognition
These “advanced driver assistance systems” (ADAS) are limited in use as the process-ing is restricted and can only be focused on few, well defined detected objects, for ex-ample during heavy rain, there is inaccurate recognition of objects, leading to false con-clusions [66]. Nevertheless, even for these relatively simple situations, these systems cannot cope reliably with fixed obstacles [67, 68]. They also occasionally behave in an unexpected manner, causing surprise to the driver in ’cut-in’ [69] situations.
The technologies ranging from from VMCs to ADAS provide solve specific ITS prob-lems in a certain way . By appropriately supplementing them with co-operative com-munication from other vehicles [68], a large-scale ITS deployment can be achieved.
1.3 Enhancing ITS services using Vehicular Communication
Co-operative vehicular communication enables a wide range of ITS services [28, 15, 70, 71]. As such communication has not yet been implemented, a list of precise services is speculative and possible to change in the future. However, services related to safety and traffic efficiency will be prime targets for intelligent transport systems [28, 72]. Typically, ITS services can be broadly categorized as follows:
Safety: Vehicular accidents account for most of the injuries and fatalities among var-ious modes of transport. In the year 2009, dozens of people were injured, when 259 vehicles were involved in a pile-up due to heavy rain on the German Motorway near Braunschweig [73]. Safe routes should be provided to drivers even under adverse traf-fic conditions. Jacobs et al. statistically concluded [74] that road accidents as a cause of death or disability were by no means insignificant, earning the ninth place out of a total of over 100 separately identified causes of death. However, by the year 2020, fore-casts suggest that road fatalities will move to sixth place, and in terms of years of life
lost (YLL) and ‘disability adjusted life years’ (DALYs)1[74] will be on second and third place respectively.
As countries develop, a common conception is that death rates usually fall - but, deaths due to traffic accidents are a notable exception [75]: the growth in automobiles that usually accompanies economic growth of a country has also contributed to an increase in traffic accidents on roads. Diminishing road fatalities is a major focus of ITS efforts throughout the world and with vehicular communication in place, the efforts to dimin-ish the death toll can be accelerated.
Traffic Efficiency: The overall efficiency, and thus its durability, of a transport system can be improved by reducing travel times and congestion, and by encouraging multi-modality (combination of several means of transport to complete a trip). Traffic effi-ciency has dual impact - on society and life of an individual - both social and economic. For example, by knowing that there is a traffic jam ahead, a driver of a vehicle can re-duce speed, thereby allowing the traffic jam to clear before arriving to the jammed area - or re-route reach a destination via an alternative path, if possible. This at the same time pollutes less, by not having to have a vehicle idle on a jammed section of the road.
Ecology: ITS-based ecological improvement primarily, relies on improving traffic ef-ficiency. Reducing energy consumption and polluting less reduces the “burden” of social and environmental responsibility on an individual. Such ecological benefits can be achieved by providing traffic efficiency as described above. In addition, there are in-vehicle technologies for smart driving and eco-vehicles that reduce the impact on environment with lesser carbon emissions. In short, "efficiency" and "ecology" go to-gether and this is a major ITS area to be addressed, by vehicular communication, for the "egoistic" drivers, otherwise motivated by personal economic welfare. An example application is the traffic light optimal speed advisory, namely, to assist the driver to arrive during a green phase [76] and thereby avoid excess pollution at intersections, by preventing idling of vehicles.
Infotainment: Gone are the days where infotainment was supposed to be a film or TV program presenting the facts about a person or event. Infotainment [77] provide users with information services which make journeys comfortable. In the past decade, one of the biggest trends of the auto industry is developing technology to access phones, PDAs, music, maps, and advanced dashboard controls [78]. This demand is expected to grow further and infotainment can be one of the major automotive growth areas
1DALY’s express years of life lost to premature death and also years lived with a disability, adjusted for
in future [79]. So, vehicular communication should be able to take into account the demands posed by infotainment as well.
1.4 Socio-Economic Impact of ITS-based Vehicular
Communication
While transportation systems provide increasing levels of economic and social oppor-tunities [28], they also create well-known problems of congestion, safety and environ-mental degradation [72]. Vehicular communication offers an opportunity to enhance ITS and increase the capacity of the existing transport infrastructure. At the same time, ITS can help countries to meet climate change and energy-independence goals - all while improving mobility, safety and economy.
Operating the transportation system effectively is a daily process, vital to the economy. Congestion poses a particular challenge to the viability of the transportation system, notably in urban centers, metropolitan areas and core economic regions. In addition, traffic incidents on a congested road can compound the problem into a recurrent con-gestion [80], resulting in easy out-stripping of the road capacity. As an example, in the United States, traffic congestion leads to 4.2 billion hours in extra travel time and an ex-tra 2.9 billion gallons of fuel burned, for a total annual cost of $78 billion, according to a 2007 report from the Texas Transportation Institute [81]. The loss incurred due to traffic congestion alone, keeps increasing every year [81] and integrating vehicular communi-cation into the transport system, can save significant amount of money globally. Population growth and urbanization cause housing patterns to expand, as well as in-creasing the distance required by an individual to travel to workplace [15]. Travel times for trips by vehicles increase correspondingly, worsening road congestion, and new travel paths need to be taken between home and work. Even though expanding the capacity of the road network is possible, the sustainability of such a solution is ques-tionable in the long-run, due to fiscal and spatial constraints [80].
Vehicles emissions are a major source of air pollution [82]. ITS-based vehicular com-munication can improve quality of the air without adversely affecting the mobility of users. When vehicle users are informed about prevailing congested conditions well in advance, and are thus diverted to alternate uncongested routes, the air quality in the congested area can be significantly decreased. In addition, by optimizing travel activ-ity—reducing the number of miles traveled by vehicles, or shifting those miles to more
efficient modes of transportation, contribute to reduced carbon emissions.
Co-operative communication between vehicles and road-side units, can effectively re-duce road congestion, making travel quicker and more productive at the same time en-abling physical infrastructure to efficiently cope with large traffic volumes, increasing return on investment. The move toward communications-enabled vehicles thus has the potential to address difficult transportation problems that are currently challenging the society. The continued development and application of these systems can increase the capacity and productivity of existing transport infrastructure, in addition to improving road safety.
As a cooperative approach, vehicular communication is predicted to be more effective, in preventing accidents, traffic congestion and improving air quality [15], than if each vehicle tries to solve these problems individually using advanced driver assistance sys-tems and fuel technologies. Also, vehicular communication is regarded as a key to re-alize a large scale deployment of Intelligent Transport Systems [28, 36, 71, 72], reducing operating costs and allowing productivity improvements.
1.5 Broadcasting ITS events using Mobility Information of
Vehicles
Safety and traffic efficiency - the prime factors for enhancing ITS by improving the capacity of existing transport systems, require co-operative message exchange with ve-hicles around [15, 27, 75, 36]. To be able to do so, a vehicle should broadcast a mes-sage locally within a certain geographic area. A typical text on wireless networks will describe the term broadcasting as “ a method of transferring a data message to all re-cipients simultaneously”. The rere-cipients are distinguished by their ability to decode correctly, a transmitted signal (please refer to section 2.1.4 for further information). In a dynamic ad hoc network, such as a vehicular network, vehicles may enter or leave a network at any point of time. To provide efficient diffusion of a message in a net-work, several protocols depending on neighborhood information are available. No-table broadcast protocols are MPR [83], IRBP [84], AHBP [85], etc. These protocols use information about the links, maintained periodically via control messages, that exist in the network to forward a packet, and are called "topology-based" protocols. For exam-ple, in multi-point relay flooding [86], each node in a network selects a set of nodes in its 1-hop neighborhood which may re-transmit its messages. This set of selected
neigh-Figure 1.1: Multi-point relay
bor nodes is called the "Multi-point Relay" (MPR) set of that node. The neighbors of node N which are not in its MPR set, receive and process broadcast messages but do not retransmit them (see figure 1.1 for illustration of multi-point relays).
An alternative way of forwarding packets by exploiting availability of location infor-mation of nodes in the network. These position-aware protocols, are denoted “location-based” and examples include GOSSIP [87], CBS [88], LAB [89]. For example, LAB uses a distance-based scheme where every node makes a re-broadcast decision based on the distance between itself and each neighbor node that has previously re-broadcast a given packet. To identify redundant re-transmissions, LAB uses an angle-based scheme, which takes into account the relative direction of sending nodes of a particular message. The protocol assumes that a node should have at least one re-transmission of a message from various specified angles, before discarding the forwarding of the message.
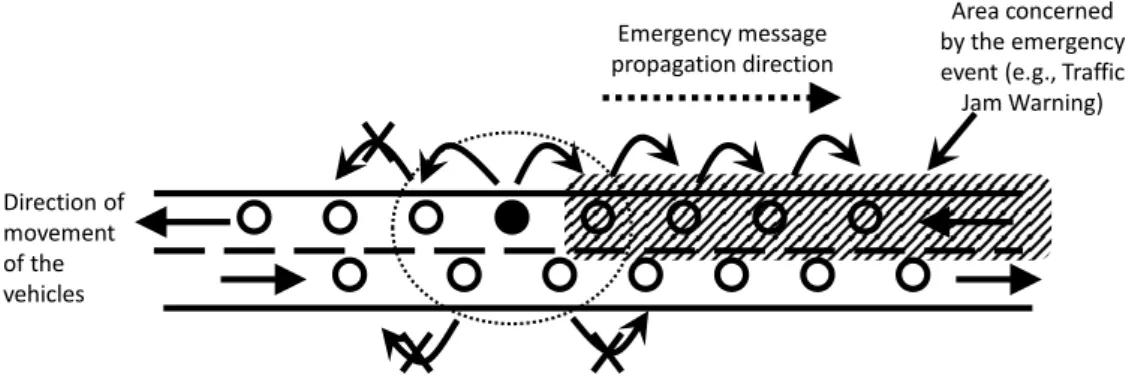
Connectivity of a network depends on radio range and physical location of individ-ual nodes. If there is a path (possibly over multiple hops) between any two nodes, the network is said to be connected. As long as there is at least one intermediate ve-hicle to forward a message (at every hop), broadcasting of a message may propagate among all vehicles on the road network. Assuming a highway of total length 50 km, a broadcast message on one end of the highway can easily reach other end through in-termediate nodes. If a traffic jam is present on only one direction of the highway (e.g., for about 3 km on a 500 km highway section), nodes can use their location information
Emergency message propagation direction
By using the location information of the nodes, directional message flooding can be achieved
Area concerned by the emergency event (e.g., Traffic Jam Warning) Direction of movement of the vehicles No forwarding of message in that direction Source of emergency event Transmission radius of the source
Figure 1.2: Nodes can use their location information and the location of the event in the message to determine whether or not to forward a message
to determine whether a traffic-jam alert message that is forwarded will be relevant to the direction of propagation of the message. Thus, un-necessary relay by nodes, other than a concerned section of the highway (the first 10 kms from the jammed section, for instance), can be avoided.
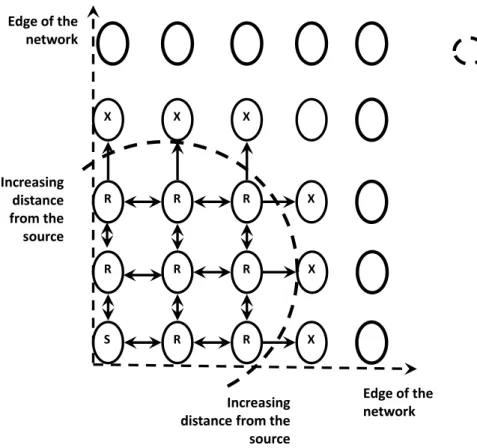
Also, the number of hops required to cover certain geographic distance depends upon the communication ranges, number of nodes, and the physical location of the individ-ual nodes. Thus, limiting message propagation, within a specific geographic area, can be conveniently done using “distance” as metric (see figure 1.3).
In this manuscript, it is assumed that nodes (vehicles and other stationary ITS equip-ment2 participating in a vehicular network) have access to their geographic location information using a positioning device. The sending vehicles, encode their location information along with the traffic incident messages. This will enable intermediate vehicles to decide whether to relay a message around a specific geographic area, de-pending upon the type of ITS event. The decision to forward a message is done by receiving nodes, providing a distance-based (restricted in terms of distance from the source of the ITS event) and directional flooding (to geographically contain propaga-tion of a message) in a vehicular network, using the geographic locapropaga-tion informapropaga-tion of
2A single road side equipment can be used to inform drivers about speed limit, speed bump, etc.,
Direction of movement of the vehicles Direction of movement of the vehicles
Using “hop count” metric, the sender cannot decide the number of hops that is exactly required to cover the dissemination distance of an ITS event. Depending upon the position of the nodes w.r.t. sender, during the instance of forwarding, the number of hops may vary. When location information of nodes are available, “distance” can be used as a simple metric.
Scenario 2: Scenario 1 3 hops required to cover the intended dissemination distance 2 hops required to cover the intended dissemination distance Emergency message propagation direction Area concerned by the emergency event (e.g., Traffic Jam Warning) Radio Range of Transmission
Figure 1.3: Encoding location information of the original sender in a message, enables receiving nodes to calculate their relative distance from the source. Depend-ing on the chosen ITS event, the nodes may decide to stop forwardDepend-ing a message, if the distance from the source is considered irrelevant for such an event e.g. traffic jam. Traditional hop-count metric does not work in this case.
vehicles.
1.6 Summary
This chapter provided an introduction to ITS, the major players involved, and methods adopted by them to merge existing ITS solutions with vehicular communication. The scope of vehicular communication within ITS and the socio-economic values attained by providing interoperable wireless connectivity between vehicles were also described. The core ITS areas such as safety, traffic efficiency, ecology and comfort that need an effective large-scale implementation, in order to sustain rapid economic development using vehicular communication were also covered.
The next chapter will describe how existing communication protocols can be applied or extended to enable Vehicular Communication for ITS.
2 Multi-hop Vehicular Communication
for ITS
The term vehicular communication is not limited to communication between vehicles, but also involves communication with fixed units on the road, known as Road Side Units (RSUs), and with infrastructures connected to the Internet. This type of commu-nication are collectively referred to as V2X commucommu-nication (see figure 2.1). The Car-to-Car Communication Consortium (C2C-CC) [90], proposed requirements for traffic efficiency applications where a pre-requisite is the necessity to have vehicle-to-vehicle communication involving support from the road-side units (RSUs) [91]. Thus vehicles communicating with RSUs form an integral part of the vehicular network communica-tion.
A vehicle can communicate wirelessly with another vehicle using radio waves. The communication may be direct or indirect. Vehicles within radio coverage of each other can communicate directly. A receiving vehicle is said to be in the radio coverage of a sending vehicle , if the receiving vehicle is able to correctly decode the transmitted signal from the sending vehicle. A sending vehicle can be an originator of a message or a forwarder of that message.
In a vehicular network, a source and a destination node may not be situated in the radio coverage of each other. Thus, a direct communication between them is not always possible. To enable in-direct "multi-hop” communication, intermediate nodes serve as relays to pass messages between source and destination. Different communication protocols designate, in different ways, the selection of intermediate nodes. This chapter gives an overview of existing multi-hop communication protocols that can be applied for vehicular communication in order to expand the ITS areas described in section 1.3. For consistency of description, in this chapter and the following ones, each vehicle or road-side unit in the network shall be denoted by “node”.
Road Side Unit (RSU) Vehicle-to-Vehicle Communication Vehicle-to-Infrastructure Communication
Figure 2.1: Vehicular Communications - V2X involves a combination of V2V and V2I
2.1 Radio Characteristics of Vehicular Networks
Wireless communication can be done using a number of modes such as radio, laser, inductive and capacitive coupling or sound . Radio waves provide a classical form of wireless communication, since they do not require a free line of sight, and communica-tion over medium ranges can be implemented.
2.1.1 Radio Range
Radio range of a wireless system is controlled by several key factors, and the driving factor among them is “transmission power”. The more energy put into a signal, the farther it can travel. The relationship between power output and distance traveled is a polynomial with an exponent of between 3 and 4 (non-line of sight propagation) [92]. So to transmit twice as far, 8 to 16 times as much energy must be emitted. Other factors that determine range include sensitivity of the receiver, gain and efficiency of the antenna and the channel encoding mechanism.
which means they can send and receive from any direction. For a given input power, directional antenna can reach farther with a clearer signal. Depending on ITS appli-cations, an appropriate antenna can be selected e.g., an RSU placed in a highway with directional antenna can disseminate traffic info messages related to all vehicles moving, in one particular direction, towards the RSU.
Several studies have shown that radio range varies significantly in different directions and the percentage of asymmetric links in a network depends on average distance be-tween nodes. Thus the communication ranges and physical locations of individual nodes define the connectivity of a network.
2.1.2 Causes of Radio Irregularity
Radio irregularity is a common and non-negligible phenomenon in wireless networks [93]- caused mainly by devices and propagation media.
Device factors include antenna type (directional or omni-directional), transmitting power, antenna gains (at both transmitter and receiver), receiver sensitivity, receiver threshold and the Signal-to-Noise Ratio (SNR). SNR [94] is a measure to quantify how much a received signal has been corrupted by noise. It is defined as the ratio of signal power to the noise power corrupting the signal.
Media factors include media type, background noise and some other environmental factors, such as temperature and obstacles within a propagation media.
2.1.3 Impact of Radio Irregularity
A radio wave is unguided (absence of solid medium to guide the wave between sender and receiver) - and a signal between a sender vehicle and a receiver encounters multiple mobile and reflecting objects, resulting in degradation of strength and quality of the signal received by a vehicle. This characteristic of the variation of signal strength at the receiver is known as “Fading” [95].
A radio signal can also take more than one path, depending upon objects present be-tween a sender and the receiver. Different paths have different length and signals will be received with different delays. These delayed signals may cause a destructive or constructive interference at a receiving vehicle. Causes of multiple path include:
• Reflection and refraction from water bodies and terrestrial objects such as moun-tains and buildings.
• Scattering by small objects cause multiple reflections of the signal, e.g. sign boards. • Diffraction due to sharp edges causing signal splitting.
Other sources of signal degradation are: noise – signal alteration due to effects in trans-mitter and receiver electronics, and interference – signal distortion due to superimposi-tion with other signals causing signal impairment. Vehicular network protocol design must be able to take into account these bad wireless propagation conditions.
2.1.4 Interference Computation and Signal Reception
A radio receiver tuned to a particular frequency channel will receive whatever is trans-mitted on that channel plus any other signal received on that channel plus any back-ground noise [96]. If the strength of a transmission is significantly stronger than the noise, then the receiver is able to effectively ignore the noise – the transmission (nor-mally called the “signal”) has a good-signal-to-noise ratio. If a signal is of equal strength as the background noise, the receiver will not be able to discriminate the signal from the noise – resulting in a poor-signal-to-noise ratio or SNR [95]. For a given SNR value, two signal reception models are commonly used in order to estimate successful signal recep-tion [97]: SNR threshold based and Bit Error Rate (BER) based models. SNR threshold based model uses the SNR value directly by comparing it with an SNR threshold, and accepts only signals whose SNR values have been above threshold at any time during the reception. BER based model probabilistically decides whether or not each set of bits (frame) is received successfully based on the set length and the BER deduced by SNR and modulation [94] scheme used at the transceiver.
2.2 Node Characteristics in a Vehicular Network
Vehicular Networks are an emerging category of wireless network due certain partic-ularities of the nodes in the network. These particpartic-ularities are to be considered for an effective local dissemination within a geographic area of an ITS event. A detailed de-scription of the node properties in a vehicular network is presented by Schoch et. al. in [98]. They are briefly described below (sections 2.2.1, 2.2.2, 2.2.3, 2.2.4), with the purpose of identifying their essential features and exploiting them for efficiently dis-seminating ITS events within a geographic area.
2.2.1 Node Speed
Nodes either denote vehicles or roadside units (RSUs) and their velocities may range from zero for stationary RSUs or when vehicles are stuck in a traffic jam to over 200 km/h on some highways [99] in Germany. For multi-hop message dissemination, the short encounters between two nodes can lead to message loss during transmission. For example, a vehicle performing map updates via an RSU on a highway can leave the communication coverage of RSU before the update can complete. With the presence of intermediate vehicles, a vehicle can continue to perform map updates with the RSU, until it is complete.
2.2.2 Node Mobility Pattern
Typically the movement of vehicles are restricted by the road topology. Roads are con-structed to allow vehicles to move in both directions. At intersections and roundabouts, according to the destination, a vehicle can move arbitrarily, making driving direction of the vehicles unpredictable. This, for example, is the case at intersections and round-abouts. Roads can be distinguished into three types:
• City roads: Inside cities, the number of roads is relatively high. There are lots of smaller roads, but also bigger, arterial roads [98]. Many intersections cut road segments into smaller proportions. Often, buildings right beside the roads limit radio propagation.
• Rural roads: These roads usually have much larger segments, which means that intersections are more rare than in cities. Traffic conditions often do not allow the formation of a connected vehicular network, because too few vehicles are on the road. The overall direction of rural roads changes more frequently than the direction of highways.
• Highways: Highways are generally large and multi-laned, with well defined ex-its and on-ramps. Movements are quasi one-dimensional, and highways usually keep their direction towards another city. Thus node mobility pattern on high-ways is typically limited to inter-city movement.
2.2.3 Node Density
Apart from speed and mobility pattern, node density is another key property of vehic-ular network. In mutual radio range, the number of other vehicles can vary from zero
to dozens or even hundreds. In case of absence of nodes within mutual radio coverage of a node, immediate message forwarding becomes impossible, in order to reach nodes further down the road. In such situation, a node can store an event and forward that after finding a node in its vicinity (by having a neighbor sensing mechanism) or period-ically broadcast it for a certain period of time (until it has quit the relevant geographic area of the event), in the absence of neighbor sensing mechanism. E.g., The presence of ice on a road warning can be stored and periodically broadcast by a vehicle, until the vehicle leaves the segment, to alert vehicles that are encountered before leaving the segment.
Node density is not only limited to the type of road, but also to the time of day. During daytime, density of vehicles on highways or in cities is high enough for immediate forwarding. However, during night, few vehicles are around and thus may necessitate repeated broadcasting of events during the night.
2.2.4 Node Heterogeneity
Different types of nodes participate in ITS. A basic distinction can be made between vehicles and RSUs. Vehicles can be further categorized as private vehicles, authority vehicles, road construction and maintenance vehicles [98]. Certain ITS services can be restricted to type of vehicle. For example, only an emergency vehicle should be able to issue warnings about its approach to the vehicles ahead in order to get way on the high-way. The situation is similar for RSUs. Depending on the capabilities of the road side units, nodes may simply emit data to the network or have complete ad hoc functional-ity, and thus may be used for forwarding like other vehicles. Moreover, infrastructural nodes may provide access to background networks (e.g., to inform a traffic operation center about road conditions). In contrast to vehicles, RSUs have widely different ca-pabilities. Regarding applications, they do not possess the same sensors as a vehicle and do not process messages for presentation to the driver or to take actions with the vehicle. Also, unlike vehicles, these nodes are stationary and do not have relation to any particular individual or companies, so RSUs do not need to protect their privacy.
2.3 Flooding in Vehicular Networks
The main goals of intelligent transportation systems are to improve road safety and traf-fic eftraf-ficiency [28, 15]. Vehicles can be enabled to communicate wirelessly and thereby
alert drivers of un-anticipated events in advance. To achieve traffic efficiency (depend-ing on the relevance of an ITS service e.g., traffic jam warn(depend-ing, green-light optimal speed advisory), dissemination of traffic event should occur within the specific geo-graphic area, taking into account the particularities presented in section 2.2.
The simplest approach to broadcast is using pure flooding, where every node that re-ceives a packet for the first time forwards it to its neighborhood. This manuscript fo-cuses on efficient selection of forwarders in order to have reduced redundant reception of packets in a network and thereby disseminate information to nodes over a vehicular network. The efficiency lies in selecting reduced number of forwarders and still cov-ering every node geographically within twice the transmission range of a sender. A sender node can be a source node or a forwarder node of an ITS event.
When efficiency is not considered, pure flooding is simple and reliably provides a total coverage of a network. However, in terms of efficiency, pure flooding causes redundant packet receptions. Redundant packet reception occurs, when two or more forwarders transmit a packet to a set of nodes, where at least one node belonging to the set, is covered in common by the forwarders’ mutual transmission range). This in-efficiency of pure flooding, in terms of redundant receptions, has caused different optimization methods to be employed [100, 88, 101, 83]. Notably Ni et al. [88] propose several schemes to reduce redundant reception. In addition, Williams et al. [102] present a comparison of different broadcasting schemes in wireless networks.
Several protocols depending on neighborhood information are proposed. These proto-cols assume to have periodic information about the presence of neighbors around, in order to update and maintain their neighbor table. With this neighbor table, the proto-cols attempt to reflect a state of their neighborhood, at any given instance in time, and thereby use that information to designate forwarders to disseminate the packet further. A notable example is the Multi-Point Relay [103] scheme. MPR extends the range of neighbor information to two-hop away neighbors. In MPR scheme, a node periodically exchanges the list of adjacent nodes with its neighbors so that each node can collect the information of two-hop away neighbors. Each node, based on the gathered informa-tion, selects the minimal subset of forwarding neighbors, which covers all neighbors within two-hop away. Each node piggybacks its chosen forwarding nodes (MPRNs) on the hello messages. A node re-broadcasts a flood packet if the sender chooses this node as a MPRN. Otherwise, this node does not relay the flood packet.
A large number of current protocols and algorithms are based on topological approach of (i) having a mechanism whereby the communications ability of the wireless
multi-hop network is reflected into a graph abstraction and (ii) employing adaptations of classic algorithms and protocols, in order to allow proper operation of these over a graph abstraction with a rapidly changing topology. Some examples include OLSR [86, 104], NHDP [105], and AODV [106].
An alternative way of managing a wireless multi- hop ad hoc network is to assume that a graph abstraction is unattainable at least, a graph abstraction whose topology remains valid for sufficiently long time to allow for an algorithm to converge and in its place assume that each node is able to identify its own geographic location infor-mation. This manuscript assumes such availability of location information of a node. A comprehensive list of schemes [88, 102] that can exploit the availability of location information (see sections 2.3.1, 2.3.2 and 2.3.3). The schemes basically differ in how a node estimates redundant reception and how it accumulates knowledge to assist in re-broadcasting decision.
2.3.1 Probabilistic Methods
The Probabilistic methods [88] are similar to Simple Flooding, except that nodes only re-broadcast with a random probability. In dense networks, multiple nodes share simi-lar transmission coverages. Thus, randomly having some nodes not re-broadcast saves node and network resources without harming delivery effectiveness. In sparse net-works, there is much less shared coverage; thus, nodes won’t receive all the broadcast packets with the Probabilistic scheme unless the probability parameter is high. When the probability is 100%, this scheme is identical to Simple Flooding.
2.3.2 Counter-Based Methods
Counter-based methods show an inverse relationship between the number of times a packet is received at a node, and the probability of that node being able to reach additional area on a re-broadcast [88]. Upon reception of a previously unseen packet, the node initiates a counter with a value of one and sets a timer T to wait (which is randomly chosen between 0 and Tmaxseconds). During the defer (waiting) period, the
counter is incremented by one for each redundant packet received. If the counter is less than a threshold value when the timer expires, the packet is re-broadcast. Otherwise, it is simply dropped. Threshold values above six yield little or almost no coverage in most of the cases [88]. The main features of the Counter-Based scheme are its simplicity
and its inherent adaptability to local topologies. That is, in a dense area of the network, some nodes won’t re-broadcast; in sparse areas of the network, all nodes re-broadcast. 2.3.3 Coverage-Based Methods
Coverage-based methods assume nodes to have similar radio ranges, and have access to their geographic location information (by using a positioning device, for example) and that of their senders (a sender can encode its location information in the packet transmitted). A node will re-broadcast only if its transmission will reach additional coverage area. Suppose a node receives a packet from a sender that is located only one meter away. If the receiving node re-broadcasts, the additional area covered by the retransmission is quite low. On the other extreme, if a node is located at the boundary of the sender node’s transmission distance, then a re-broadcast would reach significant additional area, 61% to be precise [88]. A node using Coverage-based methods can evaluate additional coverage area based on all received redundant transmissions. It is to be noted that the coverage-based methods only consider the coverage area of a transmission; not the presence of nodes within that “additionally covered” area. Under the coverage-based methods, the following sub-categories are available. They are:
Distance-Based: A node using the Distance-Based Scheme compares the distance
be-tween itself and each neighbor node that has previously re-broadcast a given packet. Upon reception of a previously unseen packet, a waiting timer WT is initiated and redundant packets are cached. When the WT expires, all source node locations are ex-amined to see if any node is closer than a threshold distance value. If true, the node doesn’t re-broadcast.
Location-Based: The Location-Based scheme [88] uses a more precise estimation of
expected additional coverage area in the decision to re-broadcast. In this method, each node must have the means to determine its own location, e.g., a Global Positioning System (GPS). Whenever a node originates or re-broadcasts a packet it adds its own location to the header of the packet. When a node initially receives a packet, it notes the location of the sender and calculates the additional coverage area obtainable were it to re-broadcast. If the additional area is less than a threshold value, the node will not re-broadcast, and all future receptions of the same packet will be ignored. Otherwise, the node assigns a RAD before delivery. If the node receives a redundant packet during the RAD, it recalculates the additional coverage area and compares that value to the threshold. The area calculation and threshold comparison occur with all redundant broadcasts received until the packet reaches its scheduled send time or is dropped.