OATAO is an open access repository that collects the work of Toulouse
researchers and makes it freely available over the web where possible
Any correspondence concerning this service should be sent
to the repository administrator:
[email protected]
This is an author’s version published in:
http://oatao.univ-toulouse.fr/27593
To cite this version:
Mayen, Laëtitia
and Jensen, Nicholai D. and Desbord, Maximilien
and
Laurencin, Danielle and Gervais, Christel and Bonhomme, Christian and
Smith, Mark E. and Porcher, Florence and Elkaim, Erik and Charvillat,
Cédric
and Gras, Pierre
and Rey, Christian
and Soulié, Jérémy
and
Combes, Christèle
Advances in the synthesis and structure of α-canaphite: a
multitool and multiscale study. (2020) CrystEngComm, 22 (18). 3130-3143.
ISSN 1466-8033
DOi: 10.1039/d0ce00132e
Introduction
Advances in the synthesis and structure of
a-canaphite: a multitool and multiscale studyt
Laëtitia Mayen,3 Nicholai D. Jensen.be Maximilien Desbord,
3Danielle Laurencin, E)
bChristel Gervais, E)
c
Christian Bonhomme, E)
c
Mark E. Smith, E)
def
Florence Porcher,9 Erik Elkaim,h Cédric Charvillat,3 Pierre Gras,
3Christian Rey,3
Jérémy Soulié
E)
a
and Christèle Combes
E)
*
3a-Canaphite (CaNa2P2Ü]-4H2O) is a layered calcium disodium pyrophosphate tetrahydrate phase of
significant geological and potential biological interest. This study overcomes the lack of a reliable protocol to synthesize pure a -canaphite by using a novel simple and reproducible approach of double decomposition in solution at room temperature. The pure a-canaphite is then characterized from the atomic to the macroscopic level using a multitool and multiscale advanced characterization strategy, providing for the first time full resolution of the a-canaphite monocLinic structure, including the hydrogen bonding network. Synchrotron X-ray diffraction and neutron diffraction are combined with multinuclear solid state NMR experimental data and computational modeling via DFT/GIPAW calculations. Among the main characteristics of the a-canaphite structure are some strong hydrogen bonds and one of the four water molecules showing a different coordination scheme. This peculiar water molecule could be the last to leave the collapsed structure on heating, leading eventuaUy to anhydrous a-CaNai'2� and could also
be involved in the internai hydrolysis of pyrophosphate ions as it is the closest water molecule to the pyrophosphate ions. Relating such detailed structural data on a-canaphite to its physico-chemical properties is of major interest considering the possible rotes of canaphite for biomedical applications. The vibrational spectra of a-canaphite (deuterated or not) are analyzed and Raman spectroscopy appears to be a promising tool for the identification/ diagnosis of such microcrystals in vitro, in vivo or ex vivo.
Condensed phosphate structures have received much Jess attention than the orthophosphate ones. Ali polyphosphates are indeed hydrolyzed in aqueous solutions, and it has long been considered that this hydrolytic degradation is the cause of the quasi-absence of polyphosphate geological minerais. Pyrophosphates (i.e. diphosphates P2O/) are the most stable polyphosphate anions, and interestingly, hydrated calcium
pyrophosphate salts are encountered in both geological and biological environments. M In the field of geological minerais, calcium disodium pyrophosphate tetrahydrate, also called canaphite (CaNa2P2O7•4H2O), has been identified as the first example of a condensed phosphate geological mineral.2 The only forms of persistent polyphosphates identified in biological extracellular media are the calcium pyrophosphate dihydrates Ca2P2�·2H2O (monoclinic and triclinic, m-CPPD and t-CPPD respectively), which occur in the joints of patients suffering from pseudogout.4•5 Pritzker et al. 6 also reported the possible formation of canaphite in vitro after 24 h at 10 °c or 37 °C in a crystallization mode! system involving sodium pyrophosphate and calcium chloride diffusion in cadaveric articular hyaline cartilage (raw or denatured). Moreover, Mandel et al. 7 studied m-CPPD and t-CPPD crystal deposition
by in vitro modeling, and their results revealed the formation of o.- and �canaphite crystals as minor phases in a biological grade gelatin gel at physiological pH.
• Cl RIMAT, Université de Toulouse, CNRS, Toulouse TNP ENSIACET, Toulouse, France. Email: [email protected]
b !CGM, Univ Montpellier, CNRS, ENSCM, Montpellier, France
• Sorbonne Université, CNRS, Laboratoire de Chimie de la Matière Condens ée de Paris, UMR 7574, Paris, France
4 Viœ Chancellor·s Office, Hig}ifield Campus, University of Southampt.on, University Road, Southampton, SO17 1B], UK
• Department ofChemist,y, lilllcaster University, Bailrigg, lilllcaster, LA! 4YB, UK fnepartment of Physics, University of Wanvick, CV47AL Coventry, UK
'Laboratoire Léon Brillouin, CEA Saclay, Gif sur Yvette, Franœ
• Synchrotron Soleil, L'Orme les Merisiers, St. Aubin, Gif sur Yvette, France
t Electronic supplememaiy information (ESI) available: Tables: S1 S4, figures: S1 SS. CCDC 1989793 and 1989794. For ES! and ciystall ographic data in CIF or other electronic format see DOi: 10.1039/d0ce00132e
Few studies related to canaphite have been published so far. Two polymorphs of canaphite, namely o. and
p,
have been identified as monoclinic structures and the y polymorph structure remains unknown.2•8 Cheng et al.9 obtained theinnovative bioactive bone substitute material based on
enzyme- and/or pH-driven pyrophosphate (P2O74) hydrolysis
into orthophosphate (PO43) to be better understood.17In this
context, the present study initially described a robust
protocol for the synthesis of pure α-canaphite. Then, an
advanced multiscale characterization methodology
combining synchrotron and laboratory experimental
techniques and computational modeling tools is applied to thoroughly characterize the phase from the atomic scale to the macroscopic scale. This provides a full solution of the crystal structure, including the positions of hydrogen atoms.
Materials and methods
Precursors
Calcium chloride dihydrate salt (CaCl2·2H2O, 100.2%, VWR
Chemicals) was used as received. The pyrophosphate
precursor, anhydrous tetrasodium pyrophosphate (Na4P2O7),
was prepared by heating disodium hydrogen phosphate
(Na2HPO4, 99%, Merck) at 400°C for 15 hours in a muffle
furnace. The purity of the as-prepared sodium pyrophosphate
precursor was checked by XRD, Raman and 31P solid state
NMR spectroscopies (no residual orthophosphate was
detected, Fig. S1†) before its use for α-canaphite synthesis. α-Canaphite synthesis
α-Canaphite powder was synthesized by double
decomposition in solution (precipitation) at room
temperature using an original protocol. Calcium and
phosphate reagent solutions were prepared separately by
dissolving 2.11 g of CaCl2·2H2O (0.0144 moles) in 80 mL of
deionized water, and 17.71 g of the as-prepared sodium
pyrophosphate (Na4P2O7) precursor (0.0666 moles) in 800
mL of deionized water. The calcium solution was then
added to the pyrophosphate solution at a constant
volumetric flowrate (32 mL min 1) using a peristaltic pump.
After complete addition, the suspension was left to mature for 24 hours under magnetic stirring, and then filtered and washed with 800 mL of deionized water. The precipitate
was finally dried at 37 °C overnight and then stored at 20
°C to prevent any structural evolution before
characterization. This synthesis has been performed at least in triplicate to check for its reproducibility.
In view of the fine structural study by neutron
diffraction and the FTIR and Raman band assignments, deuterated canaphite was prepared following the protocol
detailed above, but with the use of deuterated water (D2O,
Sigma Aldrich, deuterium oxide 99 atom% D) instead of deionized water to prepare both precursor solutions and washing after filtration. In addition, several precautions were taken at each step of the synthesis protocol to
prevent as much as possible any deuterium–hydrogen
exchange with water vapor present in the air during powder transfers and storage (hermetically sealed flasks, drying by lyophilization, storage first in a dessicator with a deuterated water saturated atmosphere). Finally, the β-canaphite phase by diffusion of solutions in hydrogel-like
media mimicking the synovial fluids, and they were able to determine its crystal structure. Subsequently, Cheng and
Pritzker8 synthesized the α-canaphite phase at room
temperature by adding a sodium pyrophosphate solution at neutral pH into a calcium salt solution. They showed that
this α phase crystallized in the monoclinic system with the Pc
space group, but the positions of hydrogen atoms were not determined. Later, Rouse et al.2 confirmed this monoclinic
structure and reported its extensive interatomic distance and angle data, making a comparison to the data from Cheng
and Pritzker.8 The hydrogen atom positions were still
missing.
Following these initial studies, Cave10 synthesized
α-canaphite according to a modified protocol from Cheng and Pritzker.8 This involved pouring together cationic and anionic solutions whereupon precipitation occurred without the need of neutralizing the pyrophosphate solution. The precipitate was then matured overnight. Examination of the
XRD pattern presented suggested that an amorphous phase
might be present in the as-synthesized α-canaphite sample. This observation was supported by the estimated number of structural water molecules from thermogravimetric analysis (3.5 per formula unit) as this is not consistent with the stoichiometry of pure α-canaphite. Another method claimed that α-canaphite could be prepared by mechanical grinding of a mixture of precursor salts for several hours in the presence of water, leading to a fairly pure phase, containing 5% w/w impurities.11 α- and β-canaphite both possess a layered structure which could exhibit specific dehydration and ion exchange properties. The reactivity of canaphite was successfully investigated by reflux reaction of canaphite for two hours in potassium nitrate saturated solution leading to
an anhydrous potassium pyrophosphate phase following a
structural rearrangement.10
A FTIR and Raman vibrational spectroscopic study of
synthetic α-canaphite did not present evidence of sample purity.12 To the best of our knowledge, no solid state NMR studies of canaphite polymorphs have been reported so far,
in contrast to other crystalline calcium pyrophosphate
phases, which have been studied by the 1H, 31P and 43Ca
magic angle spinning (MAS) solid state NMR techniques.13–16
A small number of papers concerning canaphite to date have
all referred to the synthesis protocol by Cheng and Pritzker,8 with some adaptations. However, both the protocol and its modifications are poorly described in the literature. In addition, the synthetic canaphite samples were not fully
characterized to check for their purity before further
structural investigations.
Considering the potential development of canaphite-based
biomaterials and/or canaphite identification/diagnosis in the biomedical field, it is essential to thoroughly study its structure. This will allow a better understanding of diseases
associated with calcium pyrophosphate-based crystal
deposition and the related material properties. In addition, this will allow the potential of such a compound as an
the water molecules. All the representations of the refined structure presented in this paper were obtained using Vesta.18
FTIR and Raman vibrational spectroscopic analysis. A Raman Labram HR 800 confocal microscope (Horiba Jobin Yvon) and laser radiation provided by a 532 nm argon diode laser with a power of 14 mW were used. Each spectrum was acquired with an integration time of 60 seconds and three accumulations. FTIR spectra were obtained using a Nicolet
IS50 FT-IR spectrophotometer (Thermo Scientific) at a 4 cm 1
resolution and 64 scan accumulation, by transmission from a
KBr pellet. α-Canaphite and its deuterated analogue were
both analyzed by FTIR and Raman spectroscopy.
Scanning electron microscopy (SEM). SEM observations were performed on a LEO 435 VP microscope. Samples were stuck onto double-faced carbon tape and silver sputter-coated before observation.
Thermal analyses. Thermogravimetric analysis (TGA) and differential thermal analysis (DTA) were performed in triplicate using a Setaram instrument (Setsys Evolution
System) from 20 °C to 1000 °C with a step of 30 min at 1000
°C and a heating rate of 4 °C per minute in an air flow. Inductively coupled plasma-optical emission spectrometry (ICP-OES). The analyses were performed on an ICP Ultima
Expert machine (argon flow: 15 L min1) to determine the
calcium, phosphorus and sodium concentrations in triplicate. Ultra-high performance liquid chromatography (UHPLC). A Waters Acquity apparatus coupled with an evaporative light scattering detector (ELSD) was used for the detection and titration of traces of chloride ions. Measurements were done in triplicate.
Solid state NMR. The experiments were performed on the
non-deuterated α-canaphite samples to analyze the local
environments of23Na,31P,43Ca and1H nuclei. All solid state NMR spectra were recorded at 14.1 T on a VNMRS-600 MHz
spectrometer, except for the 1H NMR experiments, which
were recorded at 20.0 T on a Bruker 850 MHz NMR
spectrometer (NEO 4 console). A1H spin-echo NMR spectrum
was acquired using a 1.3 mm HXY MAS probe tuned to1H (ν0
= 850.23 MHz). The experiment was performed at 40 kHz
MAS. The spectra were recorded using 2.1 μs 90° and 4.2 μs
180°1H pulses, with a 1 rotor period echo delay, and using a
2 s recycle delay. A total of 16 scans were collected. The experiments were performed with the temperature control
unit set to 10°C. The1H chemical shifts were referenced to
the methyl groups in alanine (δisoIJ1H) = 1.20 ppm). A 31P
single pulse experiment was performed using a 3.2 mm HXY
MAS probe tuned to 1H (ν0 = 599.82 MHz) and 31P (ν0 =
242.81 MHz) and spinning at 18 kHz. A 3 μs 90° excitation
pulse was used (RF≈ 83 kHz), with SPINAL-641H decoupling
(RF = 100 kHz) during acquisition. A recycle delay of 800 s was used for full relaxation, and 24 scans were collected. The
31P chemical shifts were referenced to the phosphate groups
in synthetic hydroxyapatite, Ca10IJPO4)6IJOH)2 (δisoIJ31P) = 2.8
ppm). A 23Na single pulse MAS NMR spectrum was recorded
using a 3.2 mm HXY MAS probe spinning at 20 kHz, with the sample was vacuum-packed in a plastic bag and stored in
a freezer before its analysis. α-Canaphite characterization
The as-synthesized α-canaphite powder was fully characterized using complementary multiscale laboratory and synchrotron and neutron techniques for structural, microstructural, molecular and elemental investigations, in combination with computational DFT modeling tools.
Powder X-ray diffraction (XRD). A preliminary XRD analysis was performed at room temperature using a laboratory X-ray diffractometer (INEL Symphonix 1000) with a cobalt anticathode (λ(Kα) = 1.788970 Å) and a curved counter
to rapidly check the sample purity. Then, the as-synthesized α-canaphite powder was further analyzed at a synchrotron facility to collect data for structure refinement. Synchrotron powder X-ray diffraction patterns of the synthesized α-canaphite were acquired at 21 °C on the two-circle diffractometer of the CRISTAL beamline at the SOLEIL synchrotron (Gif-sur-Yvette, France) as part of the project No. 20130932 “Structural investigations on hydrated calcium pyrophosphate phases of biological interest: study on synthetic and biological samples”. A monochromatic beam was selected, using a Si (111) double-crystal monochromator, and its wavelength (0.5815 Å) was determined using the NIST standard LaB6. The powder sample was placed in a 0.7
mm-diameter special glass capillary mounted on a spinner to improve averaging. High angular resolution was obtained with the 21 perfect Si (111) crystal rear analyzer mounted on the two-circle diffractometer. Detection was performed using Scionix YAP:Ce scintillation detectors.
Neutron diffraction analysis. In order to locate precisely the D atoms, neutron powder diffraction (NPD) measurements were performed on the synthesized deuterated α-canaphite. The experiment was carried out on the G44 diffractometer on the S2 cold source at the Orphée-LLB reactor (France). The diffractogram was recorded at 40 °C using a Ge004 monochromator at a neutron wavelength of 1.959 Å between 2θ = 6.00° and 161.30° with steps of 0.05°.
At 2θ between 149.00° and 152.00°, the cryofurnace used gave
rise to a parasitic peak and this zone had to be excluded from subsequent analyses.
Structure refinements. D atoms were located from difference Fourier maps calculated with the NPD data. Subsequent Rietveld refinements were performed using the JANA 2006 software from the joint NPD and synchrotron XRD data. Because this procedure imposed a common value of the cell parameters for the two sets of measurements (synchrotron X-ray and neutron diffraction measurements), both wavelengths were refined in order to account for potential discrepancies in the peak positions; the refined values remained close to the initial values. Distance (H–O distances within 0.001 Å) and angle (H–O–H = 104.45IJ1)°)
restraints and equivalence between all isotropic thermal
temperature control unit set to 0 °C. The experiment was
performed using a 0.5 μs 30° 23Na solid pulse (RF ≈ 83 kHz)
and spinal-64 1H decoupling (RF ≈ 100 kHz) during
acquisition. A 1 s recycle delay was used, and 6000 scans were
collected. The 23Na NMR chemical shifts were referenced to a
1.0 M NaCl aqueous solution (δisoIJ23Na) = 0 ppm). A 43Ca MAS
NMR spectrum was recorded using a 9.5 mm probe, spinning at 4 kHz. A 3 μs 43Ca excitation pulse was used (30° solid
pulse, RF ≈ 15 kHz), preceded by a DFS pulse of 4 ms, with a DFS sweep from 250 kHz to 60 kHz in order to increase sensitivity. The spectrum was recorded using a 5 s recycle delay and 31 700 scans were co-added. The chemical shifts were referenced to a 1 M CaCl2 aqueous solution (δisoIJ43Ca) =
0 ppm), while the powers were calibrated on a saturated
CaCl2 solution. No temperature control was applied.
Computational studies. The unit cell parameters were set to the combined neutron/synchrotron X-ray diffraction data and kept fixed during geometry optimizations to ensure
consistency between the experimental and optimized
structures. Atomic positions were then relaxed with the VASP
(Vienna ab initio simulation package) code19 based on the
Kohn–Sham density functional theory (DFT) and using the a
plane-wave pseudopotential approach. Two situations were tested: relaxing H positions only or all atomic positions. The
NMR parameters were then calculated within Kohn–Sham
DFT using the QUANTUM-ESPRESSO code,20,21 keeping the
atomic positions equal to the values previously calculated
with the VASP. The PBE generalized gradient approximation22
was used and the valence electrons were described by norm
conserving pseudopotentials23 in the Kleinman–Bylander
form.24The shielding tensor was computed using the gauge
including projector augmented wave (GIPAW) approach,25
which enables the reproduction of the results of a fully
converged all electron calculation.26 The isotropic chemical
shiftδisois defined asδiso= [σ σref] whereσ is the isotropic
shielding and σref is the isotropic shielding of the same
Table 1 Chemical composition (Ca, P and Na amounts in mmoles per 100 mg of sample and Ca/P and Ca/Na atomic ratios) of the synthesized α canaphite powder determined by ICP OES compared with the expected values for pure canaphite
Ca mmoles per 100 mg P mmoles per 100 mg Na mmoles per 100 mg Ca/P Ca/Na Synthesizedα canaphite 0.298 ± 0.002 0.587 ± 0.004 0.592 ± 0.001 0.508 ± 0.006 0.503 ± 0.003
Theoretical composition 0.301 0.602 0.602 0.5 0.5
Fig. 1 DTA (a) and TGA (b) curves of the synthesizedα canaphite powder.
nucleus in a reference system. σref was fixed so that the
average sums of the experimental and calculated shifts of a series of reference compounds coincide, typically calcium
phosphates and pyrophosphates for 31P and 43Ca,27 and
sodium phosphates and silicates for 23Na. The principal
components Vxx, Vyy, and Vzz of the electric field gradient (EFG)
tensor defined as |Vzz| ≥ |Vxx| ≥ |Vyy| are obtained by
diagonalization of the calculated tensor. The quadrupolar interaction can then be characterized by the quadrupolar coupling constant CQ and the asymmetry parameter ηQ, which
are defined as: CQ = eQVzz/h and ηQ = (Vyy Vxx)/Vzz (e is the
proton charge, h is Planck's constant and Q the quadrupole moment of the considered nucleus). Q values of 104 and 44.4 mb were used for 23Na and 43Ca, respectively, in agreement
with the values reported by Pyykkö and Bryce.28,29
Results and discussion
Composition of the synthesized powderPreliminary X-ray diffraction laboratory analysis of the as synthesized canaphite powders showed that these samples
correspond to the α-canaphite phase according to the ICSD
data (no. 26015) (Fig. S2†). The elemental composition (Ca,
Na and P) of the powder was determined by ICP-OES (Table 1). The experimental values were in agreement with the theoretical ones. In addition, attempts to detect chloride
ions (counter ions from the calcium salt precursor, i.e. CaCl2
·2H2O) using UHPLC were unsuccessful (below the detection
limit, i.e.<1.00 × 10⁶mol of Cl in 100 mg of sample). Such
thorough elemental characterization, which was not
performed in previously published studies, is essential to
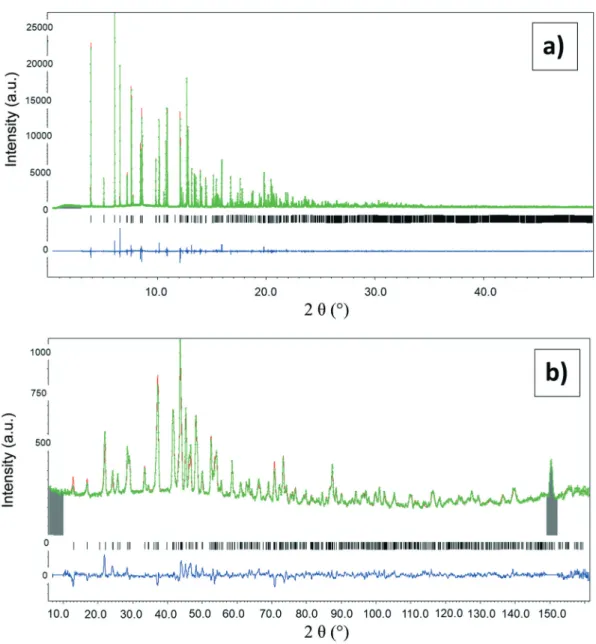
Fig. 3 Rietveld refinement plots from the powder synchrotron X ray diffraction data (a) and neutron diffraction data (b) of the synthesized α canaphite (non deuterated (a) and deuterated (b)). Experimental and simulated diagrams and difference are shown; vertical lines indicate the Bragg peak positions (the grey zone around 150° on the neutron diffraction pattern (b) corresponds to a parasitic peak related to the cryofurnace, which is excluded in data refinement).
further study and discuss the related structure and properties of α-canaphite.
TGA of the synthesized α-canaphite showed that the mass loss, related to the water release, occurred in two steps between ≈70 °C and ≈160 °C (confirmed by the first derivative curve in red, Fig. 1b). The mass loss is stabilized at ≈400 °C corresponding to the total removal of water. The total mass loss reached 21.4 ± 0.5% and allowed the determination of the number of water molecules associated with the as-synthesized α-canaphite: 3.92 ± 0.09. This value is close to that expected theoretically. The DTA curve (Fig. 1a) revealed the presence of an exothermic peak at about 440 °C which corresponds to a recrystallization phenomenon. The as-synthesized α-canaphite powder was treated at 400 °C and 600 °C for 15 h to identify the recrystallization product. The XRD analysis of both heat-treated powders (at 400 °C and 600 °C) revealed the formation of the same anhydrous crystalline phase: α-CaNa2P2O7 (triclinic) which has been already
described by Bennazha et al.30 However, a shift of the
diffraction peaks leading to slightly different unit cell parameters compared to the data reported in the literature was observed (data not shown). The current refined structural data of the as-prepared α-CaNa2P2O7 are presented in Table
S1.† The dehydration of α-canaphite will be discussed later, after the presentation of its fine structural characterization.
All together, the first results demonstrated that the original protocol developed for α-canaphite powder synthesis by double decomposition in solution at room temperature is reproducible and confirms the obtainment of the
α-canaphite crystalline phase (CaNa2P2O7·4H2O). The lack of
any small amount of an amorphous compound with a calcium disodium pyrophosphate tetrahydrate composition in the synthesized sample will be checked later by solid state NMR.
Morphological characterization of the synthesized α-canaphite crystals
SEM was used to determine the morphology of the α-canaphite particles (Fig. 2). The particles presented a
bundle-like morphology, including platelet-like crystals
gathered at the middle of the bundle. The characteristic size
of these platelets was approximately 11.0 μm in length, 2.0
μm in width and 0.1 μm in thickness (Fig. 2). The platelet
morphology of the individual α-canaphite crystals could be
related to its layered structure. The bundle-like organization
of the as-prepared α-canaphite crystals is similar to that of
natural canaphite mineral referenced in a mineralogy database (for example: mindat.org). It can be hypothesized that such bundle-like crystal agglomerates result from a spherulite formation process which generally occurs when the driving force for crystalllization (i.e. supersaturation) is quite high or when the crystal habit is highly oriented; the
platelet-like morphology of α-canaphite crystals could favor
this organization as a polycrystalline growth system.31
Category 1 spherulites are known to grow radially from the nucleation site whereas category 2 spherulites start to grow like thread fibers leading to a crystal sheaf after branching
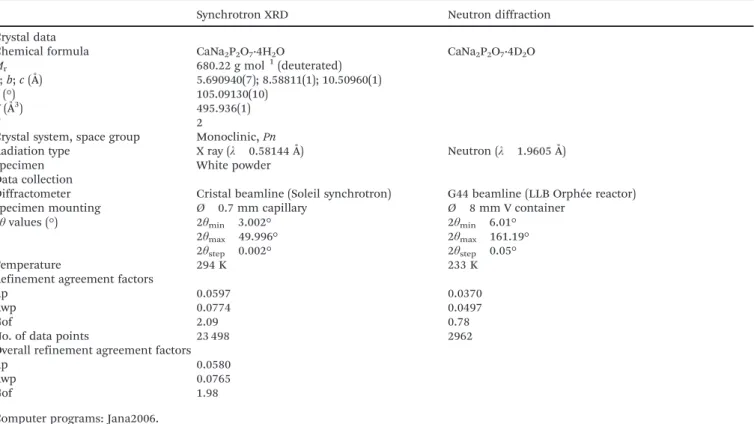
Table 2 Experimental and structure refinement details of the synchrotron X ray and neutron diffraction data
Synchrotron XRD Neutron diffraction
Crystal data
Chemical formula CaNa2P2O7·4H2O CaNa2P2O7·4D2O
Mr 680.22 g mol1(deuterated)
a; b; c (Å) 5.690940IJ7); 8.58811IJ1); 10.50960IJ1)
β (°) 105.09130IJ10)
V (Å3) 495.936(1)
Z 2
Crystal system, space group Monoclinic, Pn
Radiation type X ray (λ 0.58144 Å) Neutron (λ 1.9605 Å)
Specimen White powder
Data collection
Diffractometer Cristal beamline (Soleil synchrotron) G44 beamline (LLB Orphée reactor)
Specimen mounting Ø 0.7 mm capillary Ø 8 mm V container
2θ values (°) 2θmin 3.002° 2θmin 6.01°
2θmax 49.996° 2θmax 161.19°
2θstep 0.002° 2θstep 0.05°
Temperature 294 K 233 K
Refinement agreement factors
Rp 0.0597 0.0370
Rwp 0.0774 0.0497
Gof 2.09 0.78
No. of data points 23 498 2962
Overall refinement agreement factors
Rp 0.0580
Rwp 0.0765
Gof 1.98
which finally ends as a sphere after longer evolution times. The organization of α-canaphite platelet crystals observed by SEM (Fig. 2) corresponds to a category 2 spherulite growth (Fig. 2b and c). However, it appears that some of the observed category 2 spherulites are not perfectly symmetric and some of the platelet crystals are disassembled and/or fragmented (Fig. 2a); the 24 h-maturation under magnetic stirring, filtration, and washing are the steps for canaphite synthesis that could have altered the growth of these spherulites. The formation of category 2 spherulites was also identified for monoclinic calcium pyrophosphate tetrahydrate (m-CPPT β) and dihydrate (m-CPPD) crystal formation from amorphous calcium pyrophosphate evolution in solution at pH = 5.8 and 50 °C.32
Fine structural characterization of the as-synthesized α-canaphite phase
The as-synthesized non-deuterated and deuterated α-canaphite samples were analyzed by synchrotron X-ray diffraction and neutron diffraction, respectively (Fig. 3).
Then, Rietveld refinements were performed from the joint neutron and synchrotron-X-ray diffraction data (Table 2).
The solved α-canaphite structure presents molecular
groups that correspond to pyrophosphate ions and four water
molecules, as expected. The asymmetric unit has a
composition corresponding to the formula CaNa2P2O7·4H2O,
each atom occupying a 2a Wyckoff position of the Pn space
group. The pyrophosphate molecule is thus
non-centrosymmetric. Selected bond lengths and angles are
reported in Table 3. The structure of the α-canaphite is
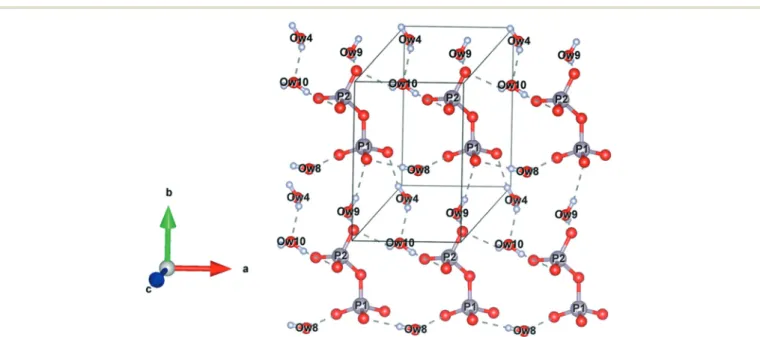
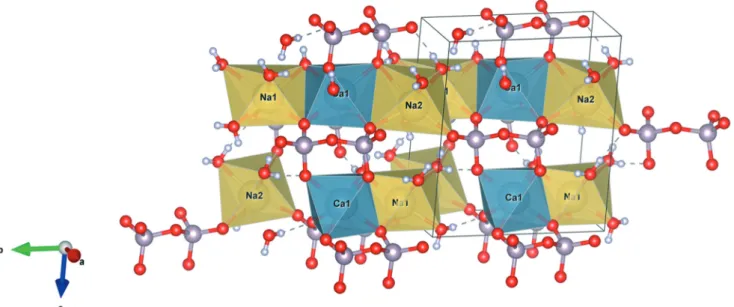
composed of alternating pyrophosphate and water layers (oriented along the plane (001)) separated by layers of calcium and sodium cations (Fig. 4). Hydrogen bonds ensure the cohesion of molecules within the layers (Fig. 5).
The P–O–P angle of the pyrophosphate group has often
been discussed as an adaptive parameter in a number of structures. Its value can be determined from structural data
(129.9IJ3)° and 129.8° as determined from both neutron/
synchrotron X-ray diffraction data refinement and DFT calculations, respectively, Table 3) or from vibrational
spectroscopic data as reported by Rulmont et al.33and other
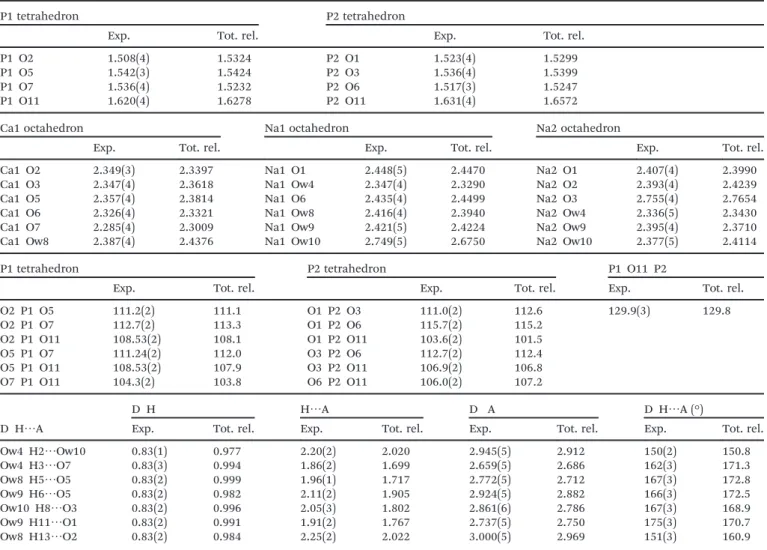
Table 3 Selected geometric parameters of theα canaphite structure (Å, °). P O, Ca O and Na O bond lengths (Å) (P1, P2, Ca1, Na1, Na2). Exp.: data obtained from the refinement of both neutron/synchrotron X ray diffraction data. Tot. rel.: data obtained after DFT relaxation of all positions, starting from the Exp. positions (see Materials & methods). O P O angles (°) and hydrogen bond lengths (Å) and angles (°) are given as well
P1 tetrahedron P2 tetrahedron
Exp. Tot. rel. Exp. Tot. rel.
P1 O2 1.508(4) 1.5324 P2 O1 1.523(4) 1.5299
P1 O5 1.542(3) 1.5424 P2 O3 1.536(4) 1.5399
P1 O7 1.536(4) 1.5232 P2 O6 1.517(3) 1.5247
P1 O11 1.620(4) 1.6278 P2 O11 1.631(4) 1.6572
Ca1 octahedron Na1 octahedron Na2 octahedron
Exp. Tot. rel. Exp. Tot. rel. Exp. Tot. rel.
Ca1 O2 2.349(3) 2.3397 Na1 O1 2.448(5) 2.4470 Na2 O1 2.407(4) 2.3990
Ca1 O3 2.347(4) 2.3618 Na1 Ow4 2.347(4) 2.3290 Na2 O2 2.393(4) 2.4239
Ca1 O5 2.357(4) 2.3814 Na1 O6 2.435(4) 2.4499 Na2 O3 2.755(4) 2.7654
Ca1 O6 2.326(4) 2.3321 Na1 Ow8 2.416(4) 2.3940 Na2 Ow4 2.336(5) 2.3430
Ca1 O7 2.285(4) 2.3009 Na1 Ow9 2.421(5) 2.4224 Na2 Ow9 2.395(4) 2.3710
Ca1 Ow8 2.387(4) 2.4376 Na1 Ow10 2.749(5) 2.6750 Na2 Ow10 2.377(5) 2.4114
P1 tetrahedron P2 tetrahedron P1 O11 P2
Exp. Tot. rel. Exp. Tot. rel. Exp. Tot. rel.
O2 P1 O5 111.2(2) 111.1 O1 P2 O3 111.0(2) 112.6 129.9(3) 129.8 O2 P1 O7 112.7(2) 113.3 O1 P2 O6 115.7(2) 115.2 O2 P1 O11 108.53(2) 108.1 O1 P2 O11 103.6(2) 101.5 O5 P1 O7 111.24(2) 112.0 O3 P2 O6 112.7(2) 112.4 O5 P1 O11 108.53(2) 107.9 O3 P2 O11 106.9(2) 106.8 O7 P1 O11 104.3(2) 103.8 O6 P2 O11 106.0(2) 107.2 D H⋯A D H H⋯A D A D H⋯A (°)
Exp. Tot. rel. Exp. Tot. rel. Exp. Tot. rel. Exp. Tot. rel.
Ow4 H2⋯Ow10 0.83(1) 0.977 2.20(2) 2.020 2.945(5) 2.912 150(2) 150.8 Ow4 H3⋯O7 0.83(3) 0.994 1.86(2) 1.699 2.659(5) 2.686 162(3) 171.3 Ow8 H5⋯O5 0.83(2) 0.999 1.96(1) 1.717 2.772(5) 2.712 167(3) 172.8 Ow9 H6⋯O5 0.83(2) 0.982 2.11(2) 1.905 2.924(5) 2.882 166(3) 172.5 Ow10 H8⋯O3 0.83(2) 0.996 2.05(3) 1.802 2.861(6) 2.786 167(3) 168.9 Ow9 H11⋯O1 0.83(2) 0.991 1.91(2) 1.767 2.737(5) 2.750 175(3) 170.7 Ow8 H13⋯O2 0.83(2) 0.984 2.25(2) 2.022 3.000(5) 2.969 151(3) 160.9
workers34with an empirical equation based on the relative position of the symmetric and antisymmetric stretching vibrations of the POP group. Such a determination for
α-canaphite, 129°,12is in agreement with that obtained from
the crystal structure. Torsions between the terminal groups are low, linking the canaphite structure to dichromate-type structures which are a common type of structure for hydrated calcium pyrophosphate compounds like triclinic calcium
pyrophosphate dihydrate (t-CPPD), monoclinic calcium
pyrophosphate tetrahydrate (m-CPPT β), anhydrous calcium
pyrophosphate and also the anhydrous calcium disodium pyrophosphateα phase (α-CaNa2P2O7).30,35,36
Both calcium and sodium atoms are 6-fold coordinated. Calcium is mainly bound to pyrophosphate ions, with only
one link to a water ligand through the“OW8” atom. On the
contrary, Na1 and Na2 have 4 and 3 coordination bonds with water molecules, respectively. Polyhedra are linked together by one side. Sodium polyhedra are linked to each other and also to calcium polyhedra. Calcium polyhedra, on the other hand, are linked only to sodium polyhedra. These units are spaced from each other by pyrophosphate molecules (Fig. 6).
The cationic chains thus formed are staged, linking Na1–
Ca1–Na2 blocks oriented along the [120] and [120] axes. We
can also note the different coordinations of the Ow4, Ow9 and Ow10 atoms, only with sodium ions, and Ow8 with
sodium–calcium binding (Fig. 4 to 6).
As mentioned by Cheng et al.,9 the α- and β-calcium
disodium pyrophosphate tetrahydrate structures are very similar, the main differences being the organization of the
Ca2+⋯P2O74⋯Ca2+ chains in relation to the (010) plane.
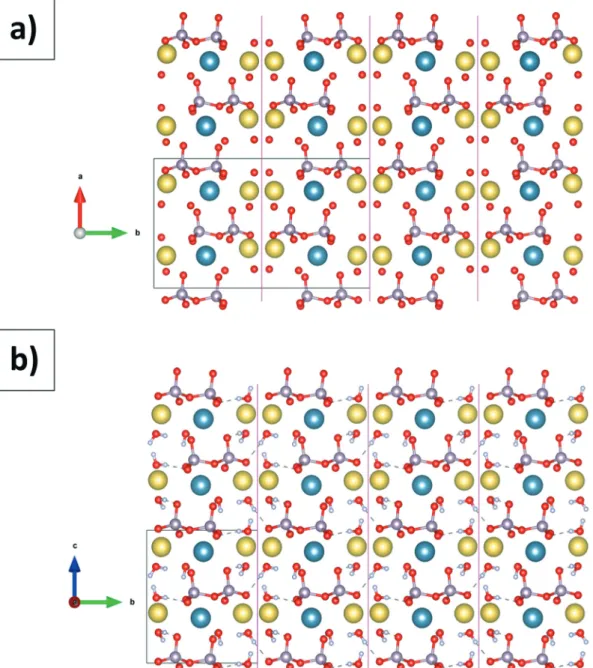
Fig. 7 highlights the close relationship between the two structures, including the organization of the CaNa2P2O7·4H2O
units. The most significant differences can be observed on the alternating orientations of pyrophosphate molecules. The intra- and intermolecular distances (Table 3) are significantly similar to those of theβ-canaphite structure.9
Complementarily, a methodology combining experimental
(solid state NMR) and computational methods (first
principles GIPAW calculations25) was implemented to
characterize in detail the structure of α-canaphite at the
atomic level. The 31P,1H, 23Na, and43Ca MAS NMR spectra
Fig. 5 Representation of hydrogen bonds within the layers of theα canaphite. Ow: oxygen atoms of water molecules (grey: phosphorus, red: oxygen, white: hydrogen, sodium and calcium cations are not represented in this figure).
Fig. 4 Three dimensional representation of the monoclinic elemental cell ofα canaphite, with placement of hydrogen atoms (obtained from refinement of both X ray and neutron diffraction data; yellow: sodium, blue: calcium, grey: phosphorus, red: oxygen, white: hydrogen).
and the corresponding extracted NMR parameters (isotropic
chemical shifts, quadrupolar constants, CQ, and quadrupolar
asymmetries, ηQ) are given in Fig. 8 and Table 4, respectively.
It should be noted that calculations were performed on the structural models derived from the structure previously presented (Fig. 4 to 6), in which either only H atom positions, or all atomic positions were relaxed by DFT. In the latter case, as discussed below, the agreement with the experimental NMR data is the best. Therefore, the P–O, Ca–O, Na–O and O–H bond lengths obtained after relaxation were added in Table 3. It appears that the P tetrahedra and Ca/Na octahedra geometries are not significantly modified by relaxation. On the other hand, the Ow–H bond lengths originally around 0.83 Å increase up to almost 1 Å after relaxation, a value closer to what is usually expected in water. In parallel, the
H⋯Ow distances decrease after relaxation since the O⋯O
distances are maintained. Moreover, the global architecture of the H-bond network is not modified since the O–H⋯O angles do not change significantly.
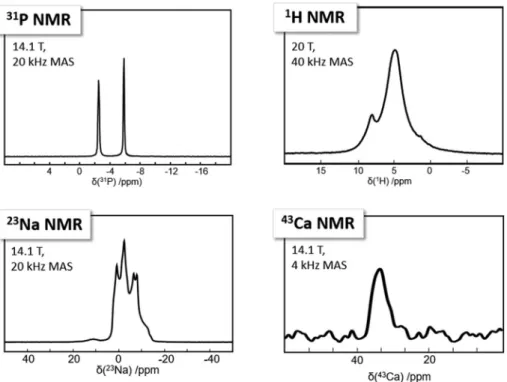
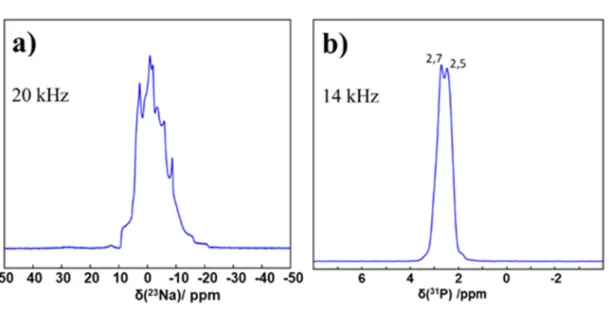
The 31P MAS NMR spectrum is characterized by two distinct
sharp isotropic peaks, in agreement with the presence of one unique pyrophosphate group (P1, P2) in the asymmetric unit. The high signal to noise ratio allows us to conclude safely that potential impurities are completely absent. It follows that 31P
MAS NMR spectroscopy can act as a highly reliable tool of investigation to check the purity of a given α-canaphite powder
sample. The 23Na MAS spectrum is more complex as 23Na is a
quadrupolar nucleus (I = 3/2). Nevertheless, it can be interpreted by the superposition of two contributions (Na1 and Na2, see Table 4) broadened by residual second-order quadrupolar interaction (it is well established that MAS cannot entirely suppress such a kind of second order broadening).
Though it is less direct than 31P MAS NMR analysis,23Na MAS
NMR remains a complementary method to check the sample
purity. The 43Ca NMR spectrum exhibits a rather
featureless
peak corresponding to the unique calcium atom in the asymmetric unit. The broadening of the line is mainly due to the residual second order quadrupolar effect as well, because
calcium-43 is a 7/2 spin quadrupolar nucleus. Finally, the1H
spin echo MAS NMR spectrum is probably the most difficult
to interpret as residual 1H–1H homonuclear dipolar coupling
broadens the line shapes (even spinning at 40 kHz at the
magic angle). The shifted 1H resonance (above 6 ppm) is in
agreement with the presence of some strong H-bonds within the canaphite structure.
GIPAW DFT calculations of the NMR parameters were performed on structural models derived from the neutron/ synchrotron X-ray structures, in which either only H atom positions or all atomic positions were relaxed by DFT (Table 4). These calculations were found to be in very good agreement with the experimental data, confirming the
accuracy of the final structure of α-canaphite. In the case of
31P NMR, the results obtained after total relaxation of the
α-canaphite atomic positions led to improved agreement with
the experimental shifts. More importantly, for 31P and 23Na,
the GIPAW calculations could be used for assigning both
sites resolved in NMR spectroscopy. Regarding1H NMR, the
overall range of calculated 1H chemical shifts was found to
be in complete agreement with the corresponding
experimental data shown in Fig. 8. Moreover, as previously observed for other pyrophosphate phases, such GIPAW DFT
calculations show the strong impact of H-bonding on the1H
isotropic chemical shifts.13If the positions of the protons are not precise enough, the GIPAW calculations usually diverge.
Vibrational spectroscopic analysis of the as-synthesized α-canaphite phase (deuterated and non-deuterated)
α-Canaphite was characterized by FTIR and Raman spectroscopy as well. The vibrational spectrum of crystals can
be interpreted using the factor group theory which predicts the number of lines expected and their activity in IR and Raman. Focusing on the internal vibration modes of H2O
(D2O) and P2O74 molecular units, respectively, 24 and 42
vibration lines should be expected (see details in the ESI† on vibrational spectroscopies and in Tables S2 and S3†). The Raman full spectrum of the as-synthesized α-canaphite powder is presented in Fig. S3† and the H2O (D2O) and P2O74
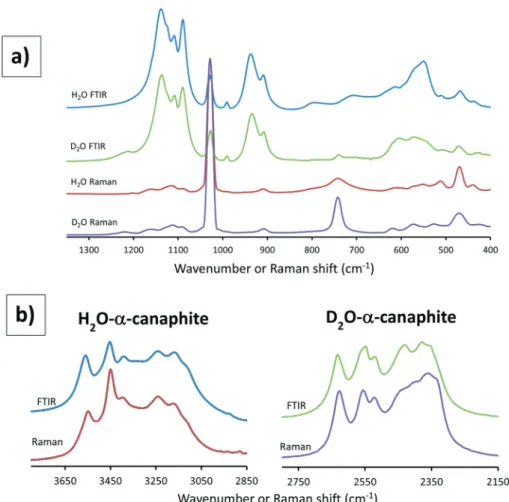
molecular vibrational domains (FTIR and Raman) are presented in Fig. 9. The different FTIR and Raman lines and their respective assignments for α-canaphite and its deuterated analogue are reported in Table S4.† Obviously, all the 66 lines predicted for the internal vibration modes cannot be distinguished, due to line broadening and superimpositions.
Generally several vibrational domains can be
distinguished depending of the vibration energy. For P2O74
stretching vibrations (1200–700 cm1), the two PO3 groups
and the POP bridge are considered and their vibration
domain is well identified (Fig. 9a). In the 1200–1000 cm1
range, the two PO3groups of each pyrophosphate ion should
show different lines (three for each group, distinguished as one symmetric and two antisymmetric vibrations), and the group factor effect could split again these lines. Generally
one very strong νs line is visible on the Raman spectrum of
α-canaphite and many other pyrophosphate salts.12,37For the
POP bridge, two stretching modes, symmetric and
antisymmetric, are found in the free ion (950–700 cm1); in
α-canaphite, these could also be split according to factor
Fig. 7 Comparison of theβ (a)9and α (b) canaphite structures, the (010) planes of interest are shown (yellow: sodium, blue: calcium, grey: phosphorus, red: oxygen, white: hydrogen).
group considerations. In the spectra obtained, only one νs
POP line is seen at the same position (740–743 cm 1) in the
Raman and FTIR spectra of the deuterated α-canaphite. In the FTIR spectrum of the H2O canaphite, this line seems
hindered by the broad water libration line at this position. This line, which is much more intense in Raman than in FTIR, is a specific signature of pyrophosphate ions. A νas POP
line is observed in all samples (FTIR and Raman) at 906–909 cm 1. In addition, a stronger line is seen at 938–934 cm 1
only in FTIR, the attribution of which is not clear. Lower energy vibrations corresponding to bending modes of the P2O7 group are also present, but they seem more difficult to
assign considering the other contributions, especially those
of generally broad water libration lines. For H2O vibrations,
the four water molecules in the formula unit show different environments and should exhibit 4 lines for eachνs,νasandδ
vibration modes of the molecule (Fig. 9b). These lines would also be split in virtue of group factor considerations. The Raman and FTIR lines (Fig. 9) are in close positions according to the group theory treatment predicting identical irreducible representations, vibrational energy levels and transitions, for both techniques. This observation confirms
the absence of an inversion centre in the P2O74 groups as
already noted from the structural data.
Fig. 8 31P,23Na, and43Ca MAS NMR spectra at 14.1 T and1H spin echo MAS NMR spectrum at 20.0 T of the as synthesizedα canaphite powder. All experimental details are given in the Materials and methods section.
Table 4 31P,23Na,43Ca, and1H experimental and extracted data for the as synthesizedα canaphite powder. Computational details related to GIPAW calculations25are given in the Materials and methods section. Tot. rel. calc.: GIPAW data obtained after DFT relaxation of all positions (see caption of Table 3). Rel. H calc.: GIPAW data obtained after DFT relaxation of H positions only
Rel. H calc. Tot. rel. calc. Experimental
δiso/ppm CQ/MHz ηQ δiso/ppm CQ/MHz ηQ δiso/ppm CQ/MHz ηQ
P1 −1.8 −5.5 −5.8 (0.1) P2 2.6 −1.4 −2.5 (0.1) Na1 0.2 −2.4 0.99 0.4 2.5 0.82 −0.3 (0.1) 2.20 (0.05) 0.78 (0.02) Na2 4.6 2.0 0.44 3.3 2.1 0.50 4.0 (0.1) 2.00 (0.05) 0.30 (0.02) Ca 48.2 −1.5 0.30 33.9 −1.4 0.45 H2 3.3 3.7 H3 7.8 7.6 H4 2.1 2.3 H5 7.8 8.5 H6 4.3 4.8 H8 6.5 7.3 H11 7.2 6.5 H13 5.2 5.1
The deuteration allows us to distinguish water bands from pyrophosphate ones especially in the bending domains where water libration lines can be easily shifted towards lower wavenumbers (Fig. 9). In particular, such H2O lines can be
identified at about 800, 706, and 548 cm 1. The faint line at
791 cm 1, in the deuterated sample FTIR spectrum, is
attributed to incomplete deuteration of the samples (about
20% residual H2O), possibly due to exchange with air during
sample preparation and analysis. Deuteration shifts the water lines to the low energy region (590, 520 and 410 cm 1)
overlapping the P2O74 ones especially in FTIR. The shift ratio
between the H2O and D2O stretching lines, about 1.35, is in
agreement with the theoretical and experimental
determinations.38 The FTIR and Raman determination of the
POP angle using Harcharras' diagram37 based on Lazarev's
observations is close to 129°, in agreement with the value obtained from the diffraction data.
Further analyses upon heat-treatment
We showed by thermogravimetric analysis that α-canaphite recrystallized at about 440 °C into the anhydrous calcium disodium pyrophosphate triclinic phase (α-CaNa2P2O7). The
latter phase is not a layered structure (Fig. S4†) and the
orientation of the pyrophosphate molecules are very different
from that in the α-canaphite structure in which strong
hydrogen bonds are also involved as demonstrated by the present fine structural analysis by the diffraction methods, solid state NMR and DFT calculations. These observations suggest that this transformation (crystallization) is probably complex with strong structural reorganization. In addition, the observed dehydration mechanisms could be related to the different coordinations of the Ow4, Ow9 and Ow10
atoms, only with sodium ions, and Ow8 with sodium–
calcium binding (Fig. 4 to 6). Indeed, the latter related water molecule (involving Ow8) could be the last one to leave the
structure due to the two cation Na+/Ca2+ binding. This
hypothesis is supported by the fact that one water molecule
was also differentiated in another hydrated calcium
pyrophosphate layered compound, monoclinic calcium
pyrophosphate tetrahydrate beta (m-CPPT β), and identified
as the last one to leave the structure upon heating and also the one involved in pyrophosphate internal hydrolysis into
orthophosphate.34 In the case of the α-canaphite structure,
we can hypothesize that the Ow8-related water molecule
which is also the one closer to pyrophosphate (distance Ow8–
O11 = 3.123 Å) could be the one involved in the internal
hydrolysis of pyrophosphate ions. Fig. S5† shows the Raman
Fig. 9 FTIR and Raman spectra of the synthesizedα canaphite (deuterated and non deuterated) showing the domains where appear the P2O74− stretching and bending lines and the H2O and D2O bending and libration lines (a) and the O H (or O D) water stretching vibrations (b).
property determination. Both are essential to fully exploit the
structural and physico-chemical properties of α-canaphite in
materials science, especially for biomedical applications.
Author contributions
LM and MD carried out the synthesis and routine
characterization of the canaphite samples, NJ and MS the NMR experiments, CG the DFT calculations, FP the neutron diffraction analysis and the refinement of diffraction data, EE the synchrotron XRD analysis, PG the preliminary refinement of the diffraction data, CCH the laboratory XRD and TGA-DTA, and CR the vibrational spectroscopy analysis. DL and CB coordinated the NMR and DFT studies and
secured funding. JS coordinated the canaphite
characterization and supervised LM and MD (PhD students). CCO was the scientific coordinator of the study and of the paper, supervised LM and MD (PhD students) and secured funding. All authors read, participated to correct and approved the final manuscript.
Conflicts of interest
There are no conflicts to declare.Acknowledgements
The authors would like to thank the Agence Nationale de
la Recherche (PyVerres project – grant no.
ANR-16-CE19-0013) for supporting this research work and the
Laboratoire Léon Brillouin and Synchrotron Soleil for the
provision of beamtimes (proposals no. 745 and no.
20130932, respectively). The 850 MHz solid-state NMR facility used in this research was funded by the EPSRC and BBSRC, as well as the University of Warwick via part funding through the Birmingham Science City Advanced Materials Projects 1 and 2 supported by the Advantage
West Midlands (AWM) and the European Regional
Development Fund (ERDF). NMR spectroscopic calculations were performed using HPC resources from GENCI-IDRIS (Grant 097535).
References
1 D. R. Peacor, P. J. Dunn, W. B. Simmons and F. J. Wicks, Mineral. Rec., 1985, 16, 467–468.
2 R. C. Rouse, D. R. Peacor and R. L. Freed, Am. Mineral., 1988, 73, 168–171.
3 K. P. Pritzker, in Calcium phosphates in Biological and
Industrial Systems, ed. Z. Amjad, Kluwer Academic
Publishers, 1998, pp. 277–301.
4 N. Khon, R. E. Hughes, D. J. McCarty and J. S. Faires, Ann. Intern. Med., 1962, 56, 738–745.
5 P. Richette, T. Bardin and M. Doherty, Rheumatology, 2009, 48, 711–715.
6 K. P. Pritzker, P. T. Cheng, S. A. Omar and S. C. Nyburg, J. Rheumatol., 1981, 8, 451–455.
spectrum of α-canaphite dried at 250 °C, an intermediary temperature, i.e. higher than 37 °C but lower than that leading to α-canaphite full dehydration (440 °C). We can observe the appearance of a new band of low intensity at 950 cm1 characteristic of νs PO4, supporting the hypothesis of
the formation of orthophosphate via pyrophosphate internal hydrolysis. Currently, we are thoroughly investigating the effect of temperature on the α-canaphite phase and especially its transformation up to the dehydrated phase (α-CaNa2P2O7)
involving among others the hydrolysis of pyrophosphate ions upon moderate heating. This hydrolysis leads to the formation of orthophosphate ions which could stabilize a potential intermediary amorphous phase formation; this study will be published in a forthcoming manuscript.
Conclusion
Canaphite is a layered phosphate of biological interest from the perspective of in vivo calcium pyrophosphate-based crystal-associated diseases or as an innovative bone substitute material based on enzyme- and/or pH-driven pyrophosphate (P2O74 ) hydrolysis into orthophosphate
(PO43 ). The novel synthesis protocol developed here is
simple, reproducible and enables pure α-canaphite, CaNa2P2O7·4H2O, to be obtained. Various observations of the
phase development are presented. Most importantly, for the first time, the monoclinic crystal structure of α-canaphite was fully solved (including the positions of hydrogen atoms) by a combination of synchrotron X-ray and neutron diffraction, solid state NMR and DFT calculations. This detailed structural analysis identifies the presence of some strong H-bonds within the α-canaphite structure. One of the four oxygen atoms from water molecules has a different coordination, i.e. the two-cation binding of Ow8 to Na+ and
Ca2+. It is therefore probable that this water is the last one to leave the structure during canaphite dehydration. In addition, the Ow8-related water molecule is much more likely to be involved in the internal hydrolysis of pyrophosphate ions as it is the closest to a pyrophosphate molecule. A thorough study of the α-canaphite dehydration process is now necessary which will be fully described in a forthcoming paper. The very high signal-to-noise ratios observed from 31P and 23Na
MAS NMR spectroscopies are suitable to confirm the purity of
any sodium pyrophosphate precursor and α-canaphite. 31P
MAS NMR provides much sharper spectral lines such that both P atoms of the unique pyrophosphate group in the asymmetric unit are completely resolved. The first principles GIPAW calculations provide unambiguous assignments for both 31P
and 23Na resonance peaks and an interpretation for the
dispersion of the 1H isotropic chemical shifts related to the
H-bond network in the α-canaphite structure. Finally, vibrational spectroscopies, especially Raman, are a promising tool for fast in vitro, in vivo or ex vivo calcium disodium pyrophosphate microcrystal identification/diagnosis needing only a small amount of the sample. This study provides a full
7 N. S. Mandel, G. S. Mandel, D. J. Carroll and P. B. Halverson, Arthritis Rheum., 1984, 27, 789–796.
8 P. T. Cheng and K. P. H. Pritzker, Acta Crystallogr., Sect. B: Struct. Sci., 1980, 36, 921–924.
9 P. T. Cheng, S. C. Nyburg, M. E. Adams and K. P. H. Pritzker, Cryst. Struct. Commun., 1979, 8, 313–317.
10 M. R. Cave, Investigation of layered calcium phosphates and related materials for biomaterial applications, PhD thesis, University of Birmingham, United Kingdom, 2010.
11 T. V. Safronova, V. I. Putljaev, P. A. Sechejko and J. D. Tret'jakov, Russian Pat., RU2499767C1, 2012.
12 I. Hubert Joe, G. Aruldbas and G. Keresztury, J. Raman Spectrosc., 1991, 22, 537–539.
13 P. Gras, A. Baker, C. Combes, C. Rey, S. Sarda, A. J. Wright, M. E. Smith, J. V. Hanna, C. Gervais, D. Laurencin and C.
Bonhomme, Acta Biomater., 2016, 31, 348–357.
14 C. Slater, D. Laurencin, V. Burnell, M. E. Smith, L. M. Grover, J. A. Hriljac and A. J. Wright, J. Mater. Chem., 2011, 21, 18783–18791.
15 A. P. Legrand, H. Sfihi, N. Lequeux and J. Lemaître, J. Biomed. Mater. Res., Part B, 2009, 91, 46–54.
16 Y. Yu, H. Guo, M. Pujari-Palmer, B. Stevensson, J. Grins,
H. Engqvist and M. Edén, Ceram. Int., 2019, 45,
20642–20655.
17 L. Mayen, N. D. Jensen, D. Laurencin, O. Marsan, C. Bonhomme, C. Gervais, M. E. Smith, C. Coelho, G. Laurent, J. Trebosc, Z. Gan, K. Chen, C. Rey, C. Combes and J. Soulié, Acta Biomater., 2020, 103, 333–345.
18 K. Momma and F. J. Izumi, Appl. Crystallogr., 2011, 44, 1272–1276.
19 G. Kresse and J. Hafner, Phys. Rev. B: Condens. Matter Mater. Phys., 1994, 49, 14251.
20 P. Giannozzi, S. Baroni, N. Bonini, M. Calandra, R. Car, C. Cavazzoni, D. Ceresoli, G. L. Chiarotti, M. Cococcioni, I. Dabo, A. Dal Corso, S. de Gironcoli, S. Fabris, G. Fratesi, R. Gebauer, U. Gerstmann, C. Gougoussis, A. Kokalj, M.
Lazzeri, L. Martin-Samos, N. Marzari, F. Mauri, R.
Mazzarello, S. Paolini, A. Pasquarello, L. Paulatto, C. Sbraccia, S. Scandolo, G. Sclauzero, A. P. Seitsonen, A. Smogunov, P. Umari and R. M. Wentzcovitch, J. Phys.: Condens. Matter, 2009, 21, 395502.
21 S. Baroni, S. de Gironcoli, A. Dal Corso and P. Giannozzi, Rev. Mod. Phys., 2001, 73, 515–562.
22 J. P. Perdew, K. Burke and M. Ernzerhof, Phys. Rev. Lett., 1996, 77, 3865–3868.
23 N. Troullier and J. L. Martins, Phys. Rev. B: Condens. Matter Mater. Phys., 1991, 43, 1993–2006.
24 L. Kleinman and D. Bylander, Phys. Rev. Lett., 1982, 48, 1425–1428.
25 C. Pickard and F. Mauri, Phys. Rev. B: Condens. Matter Mater. Phys., 2001, 63, 245101.
26 K. Lejaeghere, G. Bihlmayer, T. Björkman, P. Blaha, S. Blügel, V. Blum, D. Caliste, I. E. Castelli, S. J. Clark, A. Dal Corso, S. de Gironcoli, T. Deutsch, J. Kay Dewhurst, I. Di Marco, C. Draxl, M. Dułak, O. Eriksson, J. A. Flores-Livas, K. F. Garrity, L. Genovese, P. Giannozzi, M. Giantomassi, S. Goedecker, X. Gonze, O. Grånäs, E. K. U. Gross, A. Gulans, F. Gygi, D. R. Hamann, P. J. Hasnip, N. A. W. Holzwarth, D.
Iuşan, D. B. Jochym, F. Jollet, D. Jones, G. Kresse, K.
Koepernik, E. Küçükbenli, Y. O. Kvashnin, I. L. M. Locht, S.
Lubeck, M. Marsman, N. Marzari, U. Nitzsche, L.
Nordström, T. Ozaki, L. Paulatto, C. J. Pickard, W. Poelmans, M. I. J. Probert, K. Refson, M. Richter, G.-M. Rignanese, S. Saha, M. Scheffler, M. Schlipf, K. Schwarz, S. Sharma, F. Tavazza, P. Thunström, A. Tkatchenko, M. Torrent, D. Vanderbilt, M. J. van Setten, V. Van Speybroeck, J. M. Wills, J. R. Yates, G.-X. Zhang and S. Cottenier, Science, 2016, 351, aad3000.
27 C. Gervais, D. Laurencin, A. Wong, F. Pourpoint, J. Labram, B. Woodward, A. P. Howes, K. J. Pike, R. Dupree, F. Mauri, C. Bonhomme and M. E. Smith, Chem. Phys. Lett., 2008, 464, 42–48.
28 P. Pyykkö, Mol. Phys., 2008, 106, 1965.
29 K. M. N. Burgess, Y. Xu, M. C. Leclerc and D. L. Bryce, Inorg. Chem., 2014, 53, 552.
30 J. Bennazha, A. Boukhari and E. M. Holt, Solid State Sci., 1999, 1, 373–380.
31 L. Granasy, T. Pusztai, G. Tegze, J. Warren and J. Douglas, Phys. Rev. A: At., Mol., Opt. Phys., 2005, 72, 011605.
32 P. Gras, Etude physico-chimique et structurale de
pyrophosphates de calcium hydratés: application aux micro-calcifications associées à l'arthrose, PhD thesis, Université de Toulouse, France, 2014.
33 A. Rulmont, R. Cahay, M. Liegeois-Duyckaerts and P. Tarte, Eur. J. Solid State Inorg. Chem., 1991, 28, 207–219.
34 P. Gras, C. Rey, O. Marsan, S. Sarda and C. Combes, Eur. J. Inorg. Chem., 2013, 34, 5886–5895.
35 T. Balić-Žunić, M. R. Christoffersen and J. Christoffersen,
Acta Crystallogr., Sect. B: Struct. Sci., 2000, 56, 953–958. 36 N. L. Davis, G. S. Mandel, N. S. Mandel and R. E. Dickerson,
J. Crystallogr. Spectrosc. Res., 1985, 15, 513–521.
37 M. Harcharras, A. Ennaciri, A. Rulmont and G. Gilbert, Spectrochim. Acta, Part A, 1997, 53, 345–352.
1
Supporting information
Advances in the synthesis and structure of α-canaphite: a multitool and
multiscale study
Laëtitia Mayen
a, Nicholai D. Jensen
b,c, Maximilien Desbord
a, Danielle Laurencin
b, Christel Gervais
c,
Christian Bonhomme
c, Mark E. Smith
d,e,fFlorence Porcher
g, Erik Elkaim
h, Cédric Charvillat
a, Pierre Gras
a,
Christian Rey
a, Jérémy Soulié
a, Christèle Combes
a,*
a
CIRIMAT, Université de Toulouse, CNRS, Toulouse INP - ENSIACET, Toulouse, France
b
ICGM, Univ. Montpellier, CNRS, ENSCM, Montpellier, France
c
Sorbonne Université, CNRS, Laboratoire de Chimie de la Matière Condensée de Paris, UMR 7574, Paris, France
d
Vice-Chancellor’s Office, Highfield Campus, University of Southampton, University Road, Southampton, SO17 1BJ,
University of Southampton, UK, and Department of Chemistry, Lancaster University, Bailrigg, Lancaster, LA1 4YB,
UK
e
Department of Chemistry, Lancaster University, Bailrigg, Lancaster, LA1 4YB, UK
f
Department of Physics, University of Warwick, CV47AL Coventry, UK
g
Laboratoire Léon Brillouin, CEA Saclay, Gif-sur-Yvette, France
h