Geophysical Research Letters
Bar Code Events in the Juno-UVS Data: Signature ∼10 MeV
Electron Microbursts at Jupiter
B. Bonfond1 , G. R. Gladstone2 , D. Grodent1 , J.-C. Gérard1 , T. K. Greathouse2 , V. Hue2 , J. A. Kammer2 , M. H. Versteeg2 , M. W. Davis2 , H. N. Becker3 , A. Radioti1 , S. S. Elliott4 , M. Imai4 , C. P. Paranicas5 , S. J. Bolton2 , S. M. Levin3 ,
and J. E. P. Connerney6,7
1STAR Institute, LPAP, Université de Liège, Liège, Belgium,2Southwest Research Institute, San Antonio, TX, USA,3JPL,
Pasadena, CA, USA,4Department of Physics and Astronomy, University of Iowa, Iowa City, IA, USA,5APL, Laurel, MD, USA, 6Space Research Corporation, Annapolis, MD, USA,7NASA Goddard Spaceflight Center, Greenbelt, MD, USA
Abstract
One of the most intriguing discoveries of Juno is the quasi-systematic detection of upgoing electrons above the auroral regions. Here we discuss a by-product of the most energetic component of this population: a contamination resembling bar codes in the Juno-UVS images. This pattern is likely caused by bursts of ∼10 MeV electrons penetrating the instrument. These events are mostly detected when Juno’s magnetic footprint is located poleward of the main emission relative to the magnetic pole. The signal is not periodic, but the bursts are typically 0.1–1 s apart. They are essentially detected when Juno-UVS is oriented toward Jupiter, indicating that the signal is due to upgoing electrons. The event detections occur between 1 and 7 Jovian radii above the 1-bar level, suggesting that the electron acceleration takes place close to Jupiter and is thus both strong and brief.Plain Language Summary
Someone’s noise is always someone else’s signal. Here we use the Juno-UVS ultraviolet spectrograph on board the Juno spacecraft as a particle detector rather than a photon collector. We analyze artifacts looking like a bar code in ultraviolet images of Jupiter’s aurora to investigate a very specific kind of radiation above the poles. These bar code events are caused by very sporadic bursts of relativistic electrons arising from the aurora itself, rather than the radiation belts. This indicates the existence of a very efficient mechanism accelerating electrons upward right above Jupiter’s atmosphere.1. Introduction
When the Ulysses spacecraft flew by Jupiter in 1992, its outbound trajectory brought it to high southern lati-tudes on the duskside of the magnetosphere. As it cruised through the large-scale magnetopause boundary layer, its instruments measured intense bursts of radio emissions and energetic particles (both electrons and protons), with timescales ranging from 2 to 80 min (Karanikola et al., 2004; MacDowall et al., 1993; McKibben et al., 1993; Zhang et al., 1995). In general, the radio emissions increased before the particle fluxes did. At the onset of the electron and proton bursts, the pitch angle distributions were field aligned and monodirectional, with the particles originating from Jupiter’s aurora. They then evolved after a few minutes into bidirectional beams. McKibben et al. (1993) suggested that these particles originating from the aurora might be a signif-icant source for the high-energy particles found in the outer magnetosphere. These puzzling findings thus called for a closer examination of the Jovian auroral regions, in order to unveil the mechanisms causing the acceleration of these particles. The instrument suite and the polar orbit of the Juno spacecraft are well suited to perform this investigation (Bagenal et al., 2017; Bolton et al., 2017; Connerney et al., 2017).
Indeed, early results from Juno’s particle instruments revealed large fluxes of upward electron beams above the polar regions, in the energy range of both Jovian Auroral Distributions Experiment (100 eV to 100 keV; Allegrini et al., 2017; Szalay et al., 2017) and Jupiter Energetic-particle Detector Instrument (20 keV to 1 MeV; Clark et al., 2017; Mauk et al., 2017) particle instruments and even above (Becker et al., 2017; Paranicas et al., 2018). The wide energy distribution of most of these upgoing beams suggests that they are related to stochas-tic parstochas-ticle acceleration processes associated with wave-parstochas-ticle interactions. Above the upward electron acceleration region, these narrow beams become a source for whistler waves, subsequently resulting in pitch
RESEARCH LETTER
10.1029/2018GL080490
Key Points:
• Rapidly varying noise caused by
∼10 MeV penetrating electrons creates bar code patterns in Juno-UVS data
• The typical timescale is∼0.1-1 s • The magnetic footprints of these
bar code events are mostly located poleward of the main auroral emission relative to the magnetic pole Supporting Information: • Supporting Information S1 Correspondence to: B. Bonfond, b.bonfond@uliege.be Citation: Bonfond, B., Gladstone, G. R., Grodent, D., Gérard, J.-C.,
Greathouse, T. K., Hue, V., et al. (2018).
Bar code events in the Juno-UVS data:
Signature∼10-MeV electron microbursts at Jupiter. Geophysical
Research Letters, 45.
https://doi.org/10.1029/2018GL080490
Received 14 SEP 2018 Accepted 1 NOV 2018
Accepted article online 5 NOV 2018
©2018. American Geophysical Union. All Rights Reserved.
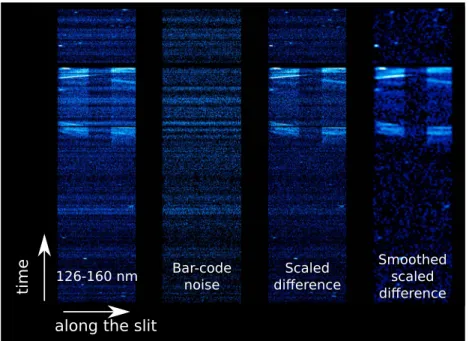
Figure 1. Example of a bar code event. The first strip represents the signal collected in the 126- to 160-nm range, typical of H2far-ultraviolet auroral emissions. This strip is a pseudo-image where thexaxis is the spatial axis along the slit. Counts along theyaxis vary with time as Juno spins. The second strip is a similar pseudo-image in an area of the detector where only penetrating electrons generate counts. The third and fourth strips are the scaled difference of the two, without and with some smoothing applied, respectively. It is noticeable that when the bar code signal is correctly subtracted, only the aurora and the stars are visible, indicating that the bar code signal is indeed originating from penetrating particles. The central and darker part of the auroral image corresponds to the narrow segment of the slit. This darkening is absent from the bar code signal, which is another indication that this signal is caused by penetrating electrons rather than photons.
angle scattering of these upgoing electrons away from the magnetic field line (Elliott et al., 2018; Tetrick et al., 2017). This differs from typical radiation belt pitch angle scattering, which deals with electrons being scattered into the loss cone. Looking at the auroral counterpart of these in situ observations, most of these upgoing particle fluxes are connected to the aurorae located poleward of the main emission relative to the magnetic pole. According to the auroral morphology and dynamics in the ultraviolet (UV) and in the infrared (IR), this poorly understood region can be subdivided into three parts, the active region (UV) or Bright Polar Region (IR) on the outer duskside, the dark region (UV) or rotating Dark Polar Region (IR) on the outer dawnside, and the swirl region (UV) or fixed-Dark Polar Region (IR) approximately in the center (Grodent et al., 2003; Stallard et al., 2003).
Inspired by the study of Steffl et al. (2012), here we make use of the Juno-UVS instrument (Gladstone et al., 2017), not as a UV spectrograph but as a particle detector. Indeed, the detector not only records UV photons but also impacts from relativistic electrons penetrating the instrument (Davis et al., 2016). Following a descrip-tion of the data set in secdescrip-tion 2, we analyze the temporal characteristic of this background signal during time intervals during which the radiation varies intensely (section 3). Then, in section 4, we focus on the location of Juno during these peculiar events and we connect them to the aurora.
2. Data Set
The Juno-UVS data set is a stream of detection events often interrupted by data gaps. These gaps are mostly due to the too rapid filling of the instrument’s buffers. Moreover, the limited data storage on board the space-craft and the limited telemetry do not allow the retrieval of every recorded count. The data stream is organized into frames of 32,768 detection events, and each frame receives a quality tag depending, among others, on the frame fill duration (Kammer et al., 2018). A frame acquired when looking at the aurora gets filled much faster than a frame filled when looking away from it and thus receives a higher quality number. Only the frames with the highest quality number are downlinked to Earth. Therefore, depending on the highly variable total count rate from photon and penetrating radiation and depending on the amount of data allocated to Juno-UVS for each orbit, the extent of the data gaps varies.
Geophysical Research Letters
10.1029/2018GL080490
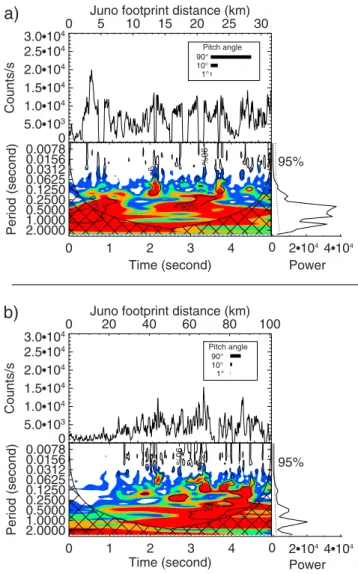
Figure 2. (a and b) Two examples of 5-s-long bar code time series. In each panel, the top plot shows a time series of the detected noise, together with the gyroradius of a 10-MeV electron with pitch angles of 1∘, 10∘, and 90∘, respectively. The bottom plots show wavelet spectrograms of the time series and the integrated power on the side (in arbitrary units). When the time is converted into the distance covered by the Juno’s magnetic footprint on the planet (top axis of the top plots), it appears that Juno’s footprint covered a 3 times larger distance in the second case, but the characteristics of the signal remained similar.
In order to create quick previews of the auroral images, we build strip images where the horizontal axis is the spatial direction along the slit and the lines on the vertical axis accounts for successive time intervals (Figure 1). These pseudo images provide a first but geometrically distorted preview of the aurora as seen by Juno-UVS. They also bear the signature of the narrow segment of the slit in its center. On some of these strips, irregu-lar banded patterns, simiirregu-lar to bar codes, are sometimes superimposed to the auroral signal. This background signal appears uniformly on the detec-tor and thus corresponds to penetrating electrons rather than photons, which the grating would disperse along the detector x axis as a function of the wavelength. In order to isolate this electron impact noise from the typ-ical auroral signal, we select the counts between pixels 345 and 550 along the detector x axis (the spectral direction) and between pixels 20 and 225 along the y axis (the spatial direction along the slit). This area broadly cor-responds to wavelengths between 59.7 and 80.9 nm (extreme UV), which is a region with both very weak auroral emission and poor instrumental throughput (Hue et al., 2018). In order to build the second strip, which isolates the bar code signal, we summed the counts along the spectral direction for each 0.017-s time interval and then concatenated the result-ing vectors into an image. Removresult-ing this bar code signal extracted from the extreme UV part of the detector to the far UV part of the signal effec-tively cleans the images, with only the auroral and stars signal remaining (third and fourth strips).
Then remains the question of the nature of the penetrating particles. Geant4 shielding analysis was performed for the Juno-UVS using the methodology described in Becker et al. (2017) to determine the pene-tration efficiencies of omnidirectional high-energy electrons and protons. Based on simulations with modeled Jovian environment spectra for the trapped radiation belts, the>10 MeV electron population is expected to make the dominant contribution to recorded UVS count rates at Jupiter. This of course would be dependent on the relative hardness of the external environment spectrum.
3. Variability of the Bar Code Signal
Regularities and typical timescales in geophysical time series are rarely periodic enough over long intervals for Fourier or Lomb-Scargle analysis to efficiently identify them. On the other hand, decomposing these time series in the time-frequency space via wavelet analysis allows for a finer understanding of how variabilities evolve though time (e.g., Torrence & Compo, 1998). The results of the wavelet analyses of two 5-s bar code sig-nal intervals are shown in Figure 2. A strictly periodic sigsig-nal would appear as a red horizontal line on the wavelet spectrograms at the bottom of each panel. Instead, the wavelet spec-trograms show spotty islands of high power, indicating that the most significant timescales vary with time and lie between 0.1 and 1 s (see also the integrated power on the side plot). Juno being a spinning spacecraft flying at great velocity (a few tens of kilometers per second) above the Jovian pole, these modulations could either be of angular, spatial, or temporal nature.
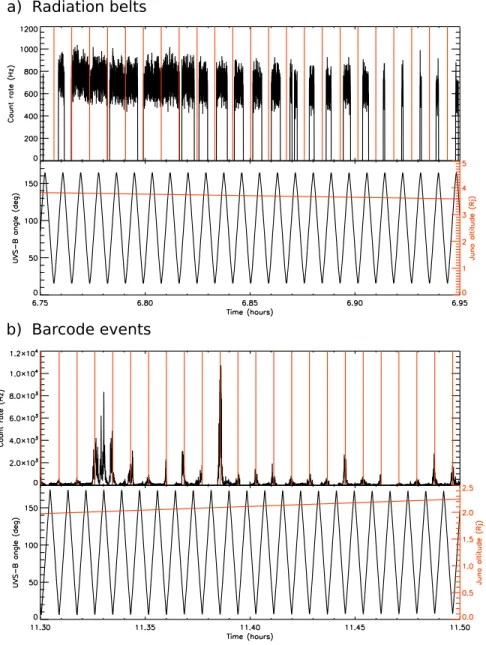
During Juno’s perijove 12 (PJ12; 1 April 2018), the data allocation allowed a greater proportion of the frames to be recovered. As a result, a recording of the bar code signal for several consecutive complete Juno spins was made possible. Figure 3 shows two examples of the measured noise count rate above the southern hemi-sphere. The top one corresponds to a period when Juno was in a steady, strong radiation belt and the bottom one to a period when Juno encountered a bar code event. For each case, the top plot represents the count rate and the bottom one the angle between the Juno-UVS aperture and the magnetic field direction. The times corresponding to the minima of this angle (i.e., to times when Juno-UVS is oriented toward Jupiter above the south pole) are shown as red vertical bars in the top plots. The sharp drops in the radiation belt time series
Figure 3. (a) The top plot shows an example of the penetrating particle count rate in the radiation belts during the PJ12 perijove (1 April 2018). Count rates equal to 0 correspond to data gaps. The bottom plot shows the angle between the Juno-UVS aperture and the magnetic field as modeled with JRM09 (Connerney et al., 2018). The red line shows the evolution of the altitude of the spacecraft. (b) Similar plots, but for data acquired during bar code events. It is noteworthy that the count rate only rises when the Juno-UVS is pointing toward Jupiter (vertical red lines). The only exception stands at 11.33, when an intermediate peaks occurs, indicative of a bidirectional field-aligned beam.
are artifacts due to data gaps. If we ignore these data gaps within the radiation belt, the count rate does not vary much as Juno spins, indicative of a nearly isotropic pitch angle distribution of the penetrating particles (Figure 3a). On the other hand, there is a clear angular modulation by the rotation angle in this long time series of the radiation signal during the bar code event (Figure 3b). The count rate peaks when the Juno-UVS aperture points along the field line toward Jupiter. For a highly field-aligned external environment, we would expect the count rate to peak when the instrument’s detector normal is parallel to the incoming beam. How-ever, the detector normal is almost perpendicular to the aperture orientation (Gladstone et al., 2017). The fact that the peaks occur when the magnetic field is aligned with the Juno-UVS aperture (and therefore perpen-dicular to the detector normal) may suggest that the penetrating particles are just energetic enough to create appreciable count rates through the instrument’s shielding facing outward but not as efficiently through the entire spacecraft in the opposite direction. This may also suggest that the energy of the electrons is less than 10 MeV. In any case, this behavior indicates that the penetrating electrons essentially originate from the Jovian
Geophysical Research Letters
10.1029/2018GL080490
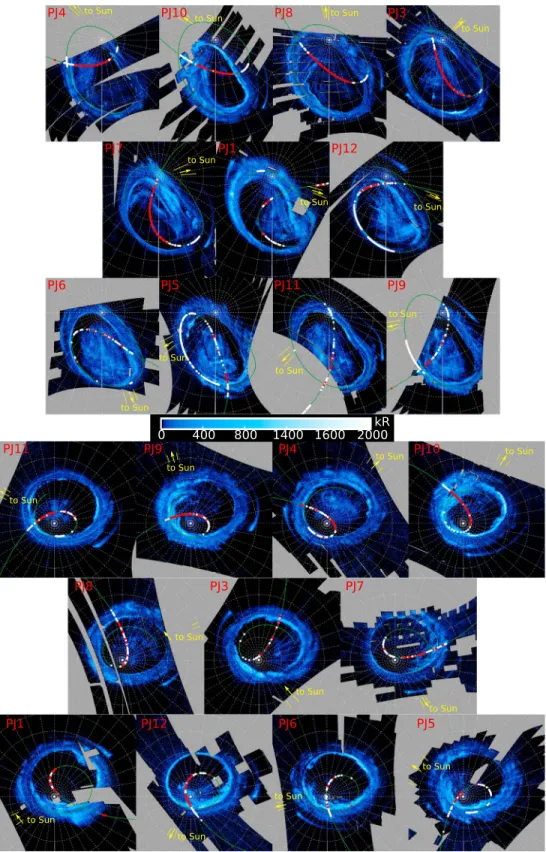
Figure 4. Polar projection of the far-ultraviolet aurora for the northern (top part) and southern hemispheres (bottom part). The different maps are ordered as a function of the System III longitude of the closest approach. The green curve is the Juno magnetic footprint according to the JRM09 magnetic field model (Connerney et al., 2018). The white dots represent the usable time segments, and the red ones represent the detected bar code events. The yellow tick marks show the Sun’s position at the beginning and the end of the exposure.
polar regions. The only exception is around 11:33 hr, when an intermediate peak appears. At this particular time, Juno-UVS was pointing away from Jupiter, indicative of a bidirectional field-aligned beam.
It should however be noted that this angular modulation every 30 s does not explain the rapid variations of the noise over ∼0.1–1 s. With a single spacecraft, disentangling temporal from spatial variations is always dif-ficult. Are the rapidly changing count rates due to the fast crossing of an alternation of empty and filled flux tubes, or are they caused by successive bursts of energetic electrons throughout a wider region? One way to discriminate is to compare the distance covered by Juno between two consecutive count rate peaks and the gyroradius of 10 MeV electrons. Indeed, the very concept of flux tube, which is only loosely applicable to rel-ativistic particles, certainly cannot be defined for separations smaller than at least a few gyroradii. Figure 2 shows two typical sequences, with the top x axes expressed in terms of distance along Juno’s magnetic foot-path on the planet. The gyroradius of a 10-MeV electron is shown for three pitch angles (90∘, 10∘, and 1∘). This radius is barely smaller than the typical interval between peaks, indicating that the variations are most prob-ably temporal. Another way to determine if the variations are spatial or temporal consists in comparing the typical timecales through time. As Juno approaches the perijove, its velocity across the field lines increases. As a consequence, the Juno footprint along the magnetic field lines accelerates along its footpath as well. If the variations are of spatial origin, then the typical timescale of the variations should increase accordingly. In Figure 2, we compare two northern hemisphere sequences acquired on 11 December 2016 (third perijove). The Juno footprint velocity increased by a factor of 3 from Figures 2a to 2b, but the bar code timescale does not vary much. These two arguments favor the scenario in which the observed variations reflect temporally varying bursts of relativistic electrons originating from below the Juno spacecraft.
4. Location of the Bar Code Events
In order to understand the origin of these mostly upgoing relativistic particles, it is crucial to understand whether these bar code events are related to a particular region or feature in the aurora. To do so, we use a simple method to automatically identify the bar code event. First, our algorithm looks for all continuous obser-vation sequences longer than 0.3 s. Each subplot of Figure 4 shows the location of the Juno magnetic footprint in the aurora 400 km above the 1-bar level (Bonfond et al., 2015) during these time intervals (white dots) according to the JRM09 magnetic field model (Connerney et al., 2018). For each perijove, the Juno magnetic footpath (green line) is superimposed to a brightness map of the UV aurora acquired around the detection times. Then, the events are identified as the time intervals during which the variance of the count rate is at least twice as large as the mean. These events are shown with red dots. For each hemisphere, the maps are organized as a function of the System III longitude of the closest approach.
A first result is that a vast majority of the events are found poleward of the main auroral emission relative to the magnetic pole. Detections corresponding to emissions located between the main emissions and the Io footpath are very rare and may be false positives triggered by our rather crude identification method in the radiation belt horns. Detections on the main emission should be considered with care, since inaccuracies of the magnetic field mapping may lead to uncertainties on the exact location of the Juno footprint. A closer look at the aurora below the positive detections shows that the events can be found above all three regions of the polar aurora. Moreover, their location does not seem related to the auroral brightness below Juno, since bar code events are found above both very bright and very dark regions (see PJ10 north, for example). For the northern maps, there is a clear variation of the number of bar code events as a function of the ori-entation of the dipole relative to the Sun. The five perijoves for which the largest number of bar code events are found (PJ4, PJ10, PJ8, PJ3, and PJ7) had a closest approach System III longitude ranging between 275∘ and 50∘. The northern pole was directed away from the Sun at these times. This local time trend is less striking for the south. Another way to present this result, through histogram of the detection rate as a function of the subsolar longitude, can be found in the supporting information as Figure S2.
If we now consider the third dimension, the distance between Juno and the aurora along the field line ranges between 1 and 7 Jovian radii (1 RJ = 71,492 km), with a majority of cases in the 1.5–2.5 RJrange. Thus, the acceleration of these penetrating particles must be very efficient and takes place between the surface (1-bar level) and ∼ 1 RJ.
Geophysical Research Letters
10.1029/2018GL080490
5. Discussion and Conclusions
Juno-UVS has the advantage of very high time resolution compared to other instruments on Ulysses or Juno, which are better suited to determine the pitch angle distribution and the energy of the electrons and ions. This characteristic allows for the discovery of sequences of very short (0.1–1 s) bursts of relativistic electrons penetrating Juno-UVS. Significantly different from the mostly uniform noise observed in the radiation belts, this signal is not periodic and is mostly observed over polar regions poleward of the main auroral oval relative to the magnetic pole. The presence of the bar code events is independent of the auroral brightness under the field lines connected to Juno.
The characteristics of the bar code events resemble those of the relativistic electron microburst events observed at Earth, both with regard to the energies involved (a few megaelectron volts) and to the typi-cal timestypi-cales (less than 1 s; Imhof & Nightingale, 1992). The microburst events have been associated with large-amplitude oblique whistler waves in the radiation belt (Cattell et al., 2008; Kersten et al., 2011). Simula-tions carried out for the Earth case show that such large-amplitude oblique whistler waves are able to transfer up to 4 MeV to the electrons within tens of milliseconds and to considerably modify the pitch angle of the electrons (Cattell et al., 2008; Omura et al., 2007). Thus, the terrestrial microburst events could be caused by oblique whistler waves in the radiation belts either impulsively accelerating electrons up to energies of a few megaelectron volts or scattering relativistic electrons into the loss cone, which requires a preexisting reservoir of relativistic particles, or both (Breneman et al., 2017; Kersten et al., 2011). However, at Jupiter, the observed relativistic electrons originate from the polar regions rather than the radiation belts or the plasma sheet. Thus, the existence of such a reservoir is excluded. Only a mechanism involving local acceleration of electrons close (less than 1 RJ) to the planet could explain the Juno-UVS bar code events reported here. For example, these events could be related to the high-energy tail of the electron distribution associated with the interaction between upgoing electrons and upgoing whistler waves described by Elliott et al. (2018). Future comparisons with observations from the other instruments on board Juno will allow us to test this scenario.
References
Allegrini, F., Bagenal, F., Bolton, S., Connerney, J., Clark, G., Ebert, R. W., et al. (2017). Electron beams and loss cones in the auroral regions of Jupiter. Geophysical Research Letters, 44, 7131–7139. https://doi.org/10.1002/2017GL073180
Bagenal, F., Adriani, A., Allegrini, F., Bolton, S. J., Bonfond, B., Bunce, E. J., et al. (2017). Magnetospheric science objectives of the Juno mission.
Space Science Reviews, 213(1), 219–287. https://doi.org/10.1007/s11214-014-0036-8
Becker, H. N., Alexander, J. W., Adriani, A., Mura, A., Cicchetti, A., Noschese, R., et al. (2017). The Juno Radiation Monitoring (RM) investigation.
Space Science Review, 213, 507–545. https://doi.org/10.1007/s11214-017-0345-9
Becker, H. N., Santos-Costa, D., Jrgensen, J. L., Denver, T., Adriani, A., Mura, A., et al. (2017). Observations of MeV electrons in Jupiter’s inner-most radiation belts and polar regions by the Juno radiation monitoring investigation: Perijoves 1 and 3. Geophysical Research Letters, 44, 4481–4488. https://doi.org/10.1002/2017GL073091
Bolton, S. J., Lunine, J., Stevenson, D., Connerney, J. E. P., Levin, S., Owen, T. C., et al. (2017). The Juno mission. Space Science Reviews, 213(1), 5–37. https://doi.org/10.1007/s11214-017-0429-6
Bonfond, B., Gustin, J., Gérard, J.-C., Grodent, D., Radioti, A., Palmaerts, B., et al. (2015). The far-ultraviolet main auroral emission at Jupiter Part 2: Vertical emission profile. Annales de Geophysique, 33(10), 1211–1219. https://doi.org/10.5194/angeo-33-1211-2015
Breneman, A. W., Crew, A., Sample, J., Klumpar, D., Johnson, A., Agapitov, O., et al. (2017). Observations directly linking relativistic electron microbursts to whistler mode chorus: Van Allen Probes and FIREBIRD II. Geophysical Research Letters, 44, 11,265–11,272.
https://doi.org/10.1002/2017GL075001
Cattell, C., Wygant, J. R., Goetz, K., Kersten, K., Kellogg, P. J., Rosenvinge, T. V., et al. (2008). Discovery of very large amplitude whistler-mode waves in Earth’s radiation belts. Geophysical Research Letters, 35, L01105. https://doi.org/10.1029/2007GL032009
Clark, G., Mauk, B. H., Paranicas, C., Haggerty, D., Kollmann, P., Rymer, A., et al. (2017). Observation and interpretation of energetic ion conics in Jupiter’s polar magnetosphere. Geophysical Research Letters, 44, 4419–4425. https://doi.org/10.1002/2016GL072325
Connerney, J. E. P., Adriani, A., Allegrini, F., Bagenal, F., Bolton, S. J., Bonfond, B., et al. (2017). Jupiter’s magnetosphere and aurorae observed by the Juno spacecraft during its first polar orbits. Science, 356, 826–832. https://doi.org/10.1126/science.aam5928
Connerney, J. E. P., Kotsiaros, S., Oliversen, R. J., Espley, J. R., Joergensen, J. L., Joergensen, P. S., et al. (2018). A new model of Jupiter’s magnetic field from Juno’s first nine orbits. Geophysical Research Letters, 45, 2590–2596. https://doi.org/10.1002/2018GL077312 Davis, M. W., Greathouse, T. K., Cooke, C. M., Blase, R. C., Gladstone, G. R., & Retherford, K. D. (2016). MeV-level electron and gamma ray
sensitivites of modern far ultraviolet sensitive microchannel plate detectors. High Energy, Optical, and Infrared Detectors for Astronomy VII,
9915, 99152B. https://doi.org/10.1117/12.2232755
Elliott, S. S., Gurnett, D. A., Kurth, W. S., Clark, G., Mauk, B. H., Bolton, S. J., et al. (2018). Pitch angle scattering of upgoing electron beams in Jupiter’s polar regions by whistler mode waves. Geophysical Research Letters, 45, 1246–1252. https://doi.org/10.1002/2017GL076878 Elliott, S. S., Gurnett, D. A., Kurth, W. S., Mauk, B. H., Ebert, R. W., Clark, G., et al. (2018). The acceleration of electrons to high energies
over the Jovian polar cap via whistler-mode wave-particle interactions. Journal of Geophysical Research: Space Physics, 123, 7523–7533. https://doi.org/10.1029/2018JA025797
Gladstone, G. R., Persyn, S. C., Eterno, J. S., Walther, B. C., Slater, D. C., Davis, M. W., et al. (2017). The Ultraviolet Spectrograph on NASA’s Juno mission. Space Science Reviews, 213(1), 447–473. https://doi.org/10.1007/s11214-014-0040-z
Grodent, D., Clarke, J. T., Waite, J. H., Cowley, S. W. H., Gérard, J.-C., & Kim, J. (2003). Jupiter’s polar auroral emissions. Journal of Geophysical
Research, 108(A10), 1366. https://doi.org/10.1029/2003JA010017
Acknowledgments
James W. Alexander, Ingrid J. Daubar, Shawn Kang, and William J. McAlpine are gratefully acknowledged for their work on the Geant4 analysis. B. B. is a Research Associate of the Fonds de la Recherche Scientifique-FNRS. We are grateful to NASA and contributing institutions which have made the Juno mission possible. This work was funded by NASA’s New Frontiers Program for Juno via contract with the Southwest Research Institute. B. B., D. G., A. R., and J.-C. G. acknowledge financial support from the Belgian Federal Science Policy Office (BELSPO) via the PRODEX Programme of ESA. The research at the University of Iowa was supported by NASA through contract 699041X with the Southwest Research Institute. The data included herein are either archived or on schedule to be archived in NASA’s Planetary Data System (http://pds-atmospheres.nmsu.edu/ data_and_services/atmospheres_data/ JUNO/juno.html).
Hue, V., Kammer, J., Gladstone, G. R., Greathouse, T. K., Davis, M. W., Bonfond, B., et al. (2018). In-flight characterization and calibration of the Juno-Ultraviolet Spectrograph (Juno-UVS). In J.-W. A. den Herder, S. Nikzad, & K. Nakazawa (Eds.), Space telescopes and instrumentation
2018: Ultraviolet to gamma ray (Vol. 10699, pp. 1069931). Austin Texas United States: International Society for Optics and Photonics.
https://doi.org/10.1117/12.2311563
Imhof, W. L., & Nightingale, R. W. (1992). Relativistic electron enhancements observed over a range of L shells trapped at high altitudes and precipitating at low altitudes into the atmosphere. Journal of Geophysical Research, 97, 6397–6403. https://doi.org/10.1029/92JA0022 Kammer, J. A., Hue, V., Greathouse, T. K., Gladstone, G. R., Davis, M. W., & Versteeg, M. H. (2018). Planning operations in Jupiter’s
high-radiation environment: Optimization strategies from Juno-UVS. In J.-W. A. den Herder, S. Nikzad, & K. Nakazawa (Eds.), Space
telescopes and instrumentation 2018: Ultraviolet to gamma ray (Vol. 10699, pp. 106993A). Austin Texas United States: International Society
for Optics and Photonics. https://doi.org/10.1117/12.2312261
Karanikola, I., Athanasiou, M., Anagnostopoulos, G. C., Pavlos, G. P., & Preka-Papadema, P. (2004). Quasi-periodic emissions (15–80 min) from the poles of Jupiter as a principal source of the large-scale high-latitude magnetopause boundary layer of energetic particle. Planetary
and Space Science, 52, 543–559. https://doi.org/10.1016/j.pss.2003.10.002
Kersten, K., Cattell, C. A., Breneman, A., Goetz, K., Kellogg, P. J., Wygant, J. R., et al. (2011). Observation of relativistic electron microbursts in conjunction with intense radiation belt whistler-mode waves. Geophysical Research Letters, 38, L08107. https://doi.org/10.1029/ 2011GL046810
MacDowall, R. J., Kaiser, M. L., Desch, M. D., Farrell, W. M., Hess, R. A., & Stone, R. G. (1993). Quasiperiodic Jovian radio bursts: Observations from the Ulysses Radio and Plasma Wave Experiment. Planetary and Space Science, 41, 1059–1072. https://doi.org/10.1016/ 0032-0633(93)90109-F
Mauk, B. H., Haggerty, D. K., Paranicas, C., Clark, G., Kollmann, P., Rymer, A. M., et al. (2017). Juno observations of energetic charged particles over Jupiter’s polar regions: Analysis of monodirectional and bidirectional electron beams. Geophysical Research Letters, 44, 4410–4418. https://doi.org/10.1002/2016GL072286
McKibben, R. B., Simpson, J. A., & Zhang, M. (1993). Impulsive bursts of relativistic electrons discovered during Ulysses’ traversal of Jupiter’s dusk-side magnetosphere. Planetary and Space Science, 41, 1041–1058. https://doi.org/10.1016/0032-0633(93)90108-E
Omura, Y., Furuya, N., & Summers, D. (2007). Relativistic turning acceleration of resonant electrons by coherent whistler mode waves in a dipole magnetic field. Journal of Geophysical Research, 112, A06236. https://doi.org/10.1029/2006JA012243
Paranicas, C., Mauk, B. H., Haggerty, D. K., Clark, G., Kollmann, P., Rymer, A. M., et al. (2018). Intervals of intense energetic electron beams over Jupiter’s poles. Journal of Geophysical Research: Space Physics, 123, 1989–1999. https://doi.org/10.1002/2017JA025106 Stallard, T. S., Miller, S., Cowley, S. W. H., & Bunce, E. J. (2003). Jupiter’s polar ionospheric flows: Measured intensity and velocity variations
poleward of the main auroral oval. Geophysical Research Letters, 30(5), 1221. https://doi.org/10.1029/2002GL016031
Steffl, A. J., Shinn, A. B., Gladstone, G. R., Parker, J. W., Retherford, K. D., Slater, D. C., et al. (2012). MeV electrons detected by the Alice UV spec-trograph during the New Horizons flyby of Jupiter. Journal of Geophysical Research, 117, A10222. https://doi.org/10.1029/2012JA017869 Szalay, J. R., Allegrini, F., Bagenal, F., Bolton, S., Clark, G., Connerney, J. E. P., et al. (2017). Plasma measurements in the Jovian polar region
with Juno/JADE. Geophysical Research Letters, 44, 7122–7130. https://doi.org/10.1002/2017GL072837
Tetrick, S. S., Gurnett, D. A., Kurth, W. S., Imai, M., Hospodarsky, G. B., Bolton, S. J., et al. (2017). Plasma waves in Jupiter’s high-latitude regions: Observations from the Juno spacecraft. Geophysical Research Letters, 44, 4447–4454. https://doi.org/10.1002/2017GL073073
Torrence, C., & Compo, G. P. (1998). A practical guide to wavelet analysis. Bulletin of the American Meteorological Society, 79(1), 61–78. https://doi.org/10.1175/1520-0477(1998)079<0061:APGTWA>2.0.CO;2
Zhang, M., McKibben, R. B., Simpson, J. A., Cowley, S. W. H., Staines, K., Anglin, J. D., et al. (1995). Impulsive bursts of energetic particles in the high-latitude duskside magnetosphere of Jupiter. Journal of Geophysical Research, 100, 19,497–19,512. https://doi.org/10.1029/ 95JA02099