HAL Id: dumas-00913211
https://dumas.ccsd.cnrs.fr/dumas-00913211
Submitted on 3 Dec 2013HAL is a multi-disciplinary open access archive for the deposit and dissemination of sci-entific research documents, whether they are pub-lished or not. The documents may come from teaching and research institutions in France or abroad, or from public or private research centers.
L’archive ouverte pluridisciplinaire HAL, est destinée au dépôt et à la diffusion de documents scientifiques de niveau recherche, publiés ou non, émanant des établissements d’enseignement et de recherche français ou étrangers, des laboratoires publics ou privés.
Analyse du gène Lacaune d’hyperprolificité dans la
population Lacaune Viande Ovi-Test
Pauline Martin
To cite this version:
Pauline Martin. Analyse du gène Lacaune d’hyperprolificité dans la population Lacaune Viande Ovi-Test. Sciences agricoles. 2013. �dumas-00913211�
Mémoire de Fin d'Études
Diplôme d’Ingénieur de l’Institut Supérieur des Sciences Agronomiques,
Agroalimentaires, Horticoles et du Paysage
Année universitaire : 2012-2013 Spécialité : Ingénieur Agronome
Spécialisation ou option : Ingénierie Zootechnique
Analyse du gène Lacaune d’hyperprolificité dans la population Lacaune Viande Ovi-Test
Par : Pauline MARTIN
Volet à renseigner par l’enseignant responsable de l’option/spécialisation* Bon pour dépôt (version définitive) ou son représentant
Date : …./…/… Signature Autorisation de diffusion : Oui Non
Devant le jury : Soutenu à Rennes le : 18/09/2013
Sous la présidence de : Catherine Disenhaus
Maîtres de stage : Jérôme Raoul (Idele) et Loys Bodin (INRA) Enseignant référent : Sophie Allais
Autres membres du jury (Nom, Qualité) : Frédéric Lecerf (Enseignant Chercheur) "Les analyses et les conclusions de ce travail d'étudiant n'engagent que la responsabilité de son auteur et non celle d’AGROCAMPUS OUEST".
* champs obligatoires AGROCAMPUS OUEST CFR de Rennes 65 rue de Saint-Brieuc CS 84215 35042 Rennes cedex INRA – SAGA BP 52627 31326 Castanet-Tolosan Institut de l’Élevage Antenne de Toulouse BP 42118 31321 Castanet-Tolosan Cedex
Extrait du Guide du mémoire de fin d’étude - Document validé par le CE plénier 7/02/2013 et le CEVE plénier du 31/01/2013
Fiche de confidentialité et de diffusion du mémoire
Cadre lié à la confidentialité :
Aucune confidentialité ne sera prise en compte si la durée n’en est pas précisée.
Préciser les limites de la confidentialité (2) :
Confidentialité absolue : oui non
(ni consultation, ni prêt)
Si oui 1 an 5 ans 10 ans
Le maître de stage(4),
Cadre lié à la diffusion du mémoire :
A l’issue de la période de confidentialité et/ou si le mémoire est validé diffusable sur la page de couverture, il sera diffusé sur les bases de données documentaires nationales et internationales selon les règles définies ci-dessous :
Diffusion de la version numérique du mémoire : oui non Référence bibliographique diffusable(3) : oui non
Résumé diffusable : oui non
Mémoire papier consultable sur place : oui non
Reproduction autorisée du mémoire : oui non
Prêt autorisé du mémoire papier : oui non
……….
Diffusion de la version numérique du résumé : oui non Si oui, l’auteur(1) complète l’autorisation suivante :
Je soussigné(e) , propriétaire des droits de reproduction dudit résumé, autorise toutes les sources bibliographiques à le signaler et le publier.
Date : Signature :
Rennes, le
L’auteur(1), L’enseignant référent
ou son représentant
(1) auteur = étudiant qui réalise son mémoire de fin d’études
(2) L’administration, les enseignants et les différents services de documentation d’AGROCAMPUS OUEST s’engagent à respecter cette confidentialité.
(3) La référence bibliographique (= Nom de l’auteur, titre du mémoire, année de soutenance, diplôme, spécialité et spécialisation/Option)) sera signalée dans les bases de données documentaires sans le résumé.
Ce stage fait partie du programme DEGERAM (Développement de la
Génomique des Races locales du Massif Central), porté par le CORAM
(collectif des Races de Massifs). Ce programme bénéficie du soutien
financier de l’Union Européenne.
Remerciements
Un cycle se termine et c’est le moment de se quitter. (Ne vous en faites pas, je ne vais pas bien loin, et j’aurai encore l’occasion de venir vous embêter de mes questions farfelues et/ou d’amener quelques petits gâteaux). Au cours de ces six mois, j’ai beaucoup appris et ai pu faire mûrir mon projet professionnel, portée par vos conseils. J’ai pris un grand plaisir à travailler avec vous et, pour tout ça, je voudrais vous dire un énorme MERCI.
Merci à l’ensemble de l’équipe ovine de la Saga pour leu appui scientifique et leurs remarques pertinentes qui ont fait avancer mon travail. Un merci tout particulier à Ingrid qui m’a consacré vraiment beaucoup de temps et délivré des conseils avisés.
Merci à Jean de m’avoir fait découvrir l’intérieur d’Ovi-Test et de m’avoir amenée partout avec toi pendant une semaine. Je te souhaite de bien profiter de ta retraite.
Merci à Annette, maman en chef de l’antenne de Toulouse. Sans toi, j’aurais souvent été perdue. Les démarches administratives, c’est vraiment tordu !
Merci à Valérie, grande prêtresse de SAS et toujours prête à rendre service. Tu m’as beaucoup aidé sur tous les plans et je te décerne officiellement le titre de 3ième maître de stage.
Plus j’avance et plus j’ai du mal à trouver les mots pour décrire mes sentiments et ma gratitude. Et pour vous deux, Loys et Jérôme, c’est vraiment compliqué. Vous avez été d’excellents maîtres de stage. Complémentaires, exigeants, toujours présents et disponibles quand j’en avais besoin. Je vous dois beaucoup. Il n’y a que le mot merci, mais ressentez tous les messages subliminaux que celui-ci contient.
Enfin, un grand merci à tous les membres de l’antenne de l’Institut de l’Élevage de Toulouse pour votre accueil, votre gentillesse et votre bonne humeur. De vos discussions animées aux éclats de rire quotidiens, vous avez construit mon bonheur. Gardez toujours cette ambiance géniale.
Table des matières
Introduction
1
Partie I : Étude de la fréquence du gène Lacaune, de son effet
sur différents caractères et de son action sur l’index de
Prolificité
4
Article en cours de soumission à GSE :
Effect of the FecL major gene in the Lacaune meat sheep population 4
Principaux éléments abordés dans l’article 5
Partie II : Analyse des accouplements par IA réalisés par
Ovi-Test depuis 2010
7
Matériels et méthodes
7
Résultats 8
Discussion
8
Partie III : Conséquences des résultats de cette étude pour
Ovi-Test
9
Conclusion
11
Bibliographie 12
Annexes 14
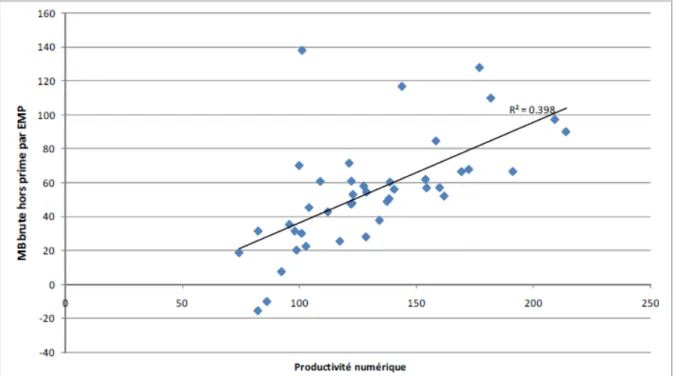
Figure 1 : Marge brute (hors prime) en fonction de la productivité numérique pour l’atelier Ovin allaitant des fermes de référence ovin viande Midi-Pyrénées 2010
Introduction
La productivité numérique, en élevage ovin, correspond au nombre d’agneaux produits sur une année (vendus ou gardés pour le renouvellement du troupeau) par brebis de plus de 12 mois (brebis en âge de produire). Elle est calculée le plus souvent sur la campagne de reproduction ou sur l’exercice civil de l’exploitation (Benoit et Laignel, 2006). La productivité numérique est, en élevage ovin allaitant, particulièrement importante du point de vue économique. En effet, pour les producteurs d’agneaux de boucherie, les recettes proviennent quasi exclusivement de deux origines : les ventes d’agneaux et l’ensemble des aides, la part relative de ces deux facteurs variant selon les types d’élevages (Jousseins et al., 2012a). Or, si certaines charges croissent avec le nombre d’agneaux, leur augmentation reste inférieure à l’augmentation de produits. La marge brute augmente donc en moyenne avec la productivité numérique (figure 1) (Jousseins et al., 2012b).
La productivité numérique est basée sur trois composantes (Benoit et Laignel, 2006) : le taux de mises bas (nombre de mises bas annuel par brebis de plus de 12 mois), le taux de mortalité (nombre d’agneaux morts, des avortements tardifs identifiés jusqu’aux agneaux d’1 an, sur le nombre d’agneaux nés) et la prolificité. La prolificité correspond au nombre d’agneaux nés, vivants ou morts (avortons compris), sur le nombre de mises bas (avortement compris). L’importance économique de la productivité numérique se retrouve en partie dans la prolificité. En race Blanche du Massif Central, à partir de deux modélisations des systèmes d’élevages majoritaires, l’effet d’une augmentation d’un point de prolificité a été évalué à une marge brute supplémentaire de 0,41 € par brebis (Dieny, 2011).
La sélection génétique a pour but de produire des animaux qui répondent au mieux aux attentes des éleveurs et de la filière. Pour cela, les individus ayant les meilleurs niveaux génétiques sur des objectifs donnés sont utilisés pour procréer la génération suivante. La prolificité est un des objectifs de sélection prioritaires des ovins allaitants (Bodin et al., 2011). Bien que la viabilité soit elle aussi sélectionnée, la prolificité est actuellement le principal levier pour améliorer génétiquement sur la productivité numérique, le taux de mises bas dépendant pour une part essentielle des choix de l’éleveur et pour une petite part des caractéristiques propres à la race (capacité au désaisonnement par exemple). On distingue deux types de prolificité : la prolificité après un œstrus naturel et la prolificité après induction de l’œstrus par des traitements hormonaux de synchronisation des chaleurs. Un œstrus induit est à l’origine d’une augmentation de la prolificité de l’ordre de 0,2 à 0,3 point dans la majorité des races (Bodin et Elsen, 1989). La prolificité naturelle et la prolificité sur œstrus induit sont fortement corrélées génétiquement mais considérées comme deux caractères différents (corrélation proche de +0,80 en race Lacaune) bien que contrôlés par un grand nombre de gènes communs (Baelden et al., 2005). Les héritabilités utilisées pour l’évaluation sont respectivement de 0,10 pour la prolificité naturelle et 0,08 pour la prolificité sur œstrus induit (Tiphine et al., 2011). Les héritabilités très faibles de ces caractères rendent longs et difficiles les progrès génétiques dans le cas d’une hérédité totalement polygénique (Bodin et al., 2011).
La coopérative Ovi-Test est la première structure d’insémination ovine française, en nombre d’inséminations, avec plus de 330 000 brebis inséminées sur la campagne 2011-2012. Cette coopérative gère un programme de sélection distinct dans chacun des deux rameaux de la race Lacaune (lait et viande). Le programme lait occupe la plus grande part des activités de la
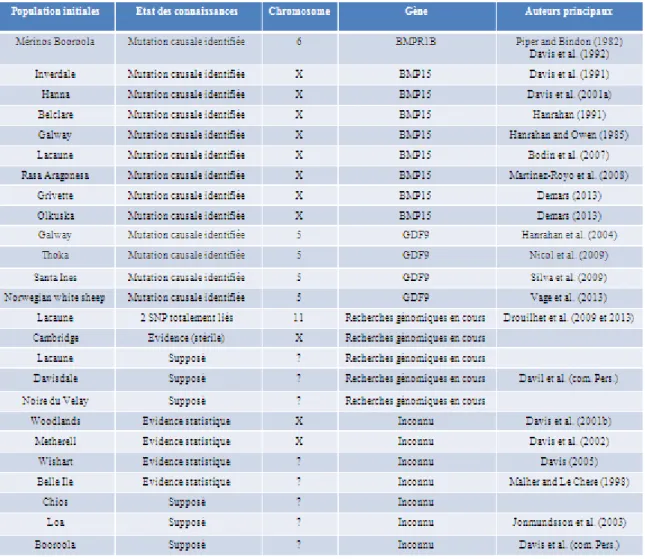
Tableau 1 : Récapitulation des gènes d’hyper prolificité connus ou suspectés (Source : Bodin et al., 2011, mis à jour en 2013)
coopérative, la majorité des brebis Lacaune étant orientée vers la production laitière et fromagère (le roquefort en particulier). Le programme viande est composé d’un noyau de sélection (ensemble des éleveurs adhérents au contrôle de performances et à l’Organisme de sélection) qui comprenait, en 2012, 16 sélectionneurs et 10 élevages en support de testage (Ovi-Test, 2013). En 2012, le schéma de sélection a diffusé 4 955 agnelles, 75 béliers ainsi que 50 000 doses d’IA. Ce programme de sélection fonctionne selon le principe présenté en Annexe 1.
Lors de la création de la coopérative en 1972, l’objectif de sélection du programme viande était strictement composé des qualités maternelles (prolificité, valeur laitière, précocité sexuelle et viabilité des agneaux). Entre les années 70 et les années 90, le progrès génétique observé sur la prolificité a été supérieur à celui espéré. En effet, la prolificité naturelle moyenne des brebis primipares mises à la lutte à moins de 11 mois, par exemple, est passée de 1,28 en 1975 à 1,98 en 1996 (Bodin et al., 2002). Ces résultats, cumulés à d’autres signes comme l’apparition de portées de taille exceptionnelle (jusqu’à huit agneaux), ont suscité l’hypothèse de la présence d’un gène majeur d’hyperprolificité. En effet, depuis 1982, de nombreuses études sur différentes races ovines ont pu montrer ou suspecter que, chez ces races, l’ovulation des brebis était sous le contrôle concomitant d’un gène majeur et d’une multitude de gènes à petits effets (Bodin et al., 2002). Un état des lieux de ces gènes majeurs d’hyperprolificité est présenté Tableau 1.
Deux gènes ont ainsi pu être mis en évidence dans la population Lacaune viande Ovi-Test : ‐ BMP15 (Bone Morphogenetic Protein 15). Ce gène, situé sur le chromosome X, joue
sur la modulation de l’ovulation (Davis et al., 1991). Huit mutations différentes ont été identifiées en ovin. Six, dont une en Lacaune, induisent des phénotypes identiques (Bodin et al., 2011) : les femelles hétérozygotes présentent, par rapport aux femelles ne possédant pas la mutation, une augmentation du nombre d’ovulation de 1 à 1,5 ovule selon les races. Les femelles possédant deux allèles mutés sont en revanche stériles, leur développement ovarien se stoppant au stade fœtal. Deux nouvelles mutations ont été identifiées récemment dans des populations Grivette et Olkuska et laissent apparaître un phénotype un peu différent (Demars et al., 2013) mais aucune de ces deux mutations n’a pu être mise en évidence dans la population Lacaune.
‐ FecL appelé communément gène Lacaune. Ce gène a été localisé dans une zone très précise du chromosome 11 (Lecerf, 2003 ; Drouilhet, 2010), mais la mutation causale n’a pas encore été identifiée. L’allèle muté, noté L, et l’allèle sauvage, noté +, sont codominants. On note un effet additif sur le taux d’ovulation d’environ 1,5 ovule supplémentaire par copie de l’allèle muté (Bodin et al., 2011). Le génotypage du gène
FecL a, dans un premier temps, été réalisé grâce à un ensemble de 7 marqueurs
définissant un haplotype porteur. Mais la découverte d’un SNP, DLX3, en déséquilibre de liaison quasi complet avec la mutation, a permis de faire évoluer la technique de génotypage (Drouilhet, 2010).
Ni le gène BMP15 ni le gène FecL ne sont intéressants pour les éleveurs à l’état homozygote. En effet, les animaux homozygotes mutés sur BMP15 sont stériles et les brebis de génotype LL, chez qui les portées de 4 agneaux ou plus sont relativement fréquentes, sont trop prolifiques pour les éleveurs. En revanche, à l’état hétérozygote, ces mutations ont potentiellement de l’intérêt. En 2006, une étude a permis d’estimer les fréquences de ces
mutations dans la population Lacaune Viande Ovi-Test (Bessière, 2006). La fréquence des brebis porteuses de la mutation Lacaune était alors estimée à 45 % tandis que la fréquence de la mutation BMP15 n’était que de 15 %. L’idée d’une sélection concomitante sur les deux gènes a été écartée, les brebis doubles hétérozygotes présentant en effet un phénotype similaire à celui des animaux LL et donc trop prolifique pour les éleveurs. Une situation où les deux mutations seraient éradiquées n’est pas non plus envisageable, car cela entraînerait une forte baisse de la prolificité dans la population, ce qui ne serait pas acceptable économiquement. Au vu des fréquences, et par crainte de la stérilité des homozygotes BMP15, la coopérative Ovi-Test a fait le choix d’éradiquer de la population la mutation BMP15 et d’intégrer la gestion de la mutation Lacaune dans son programme de sélection.
Face à l’augmentation continue de la prolificité et des portées de plus de trois agneaux, une stratégie de plafonnement des index avait été mise en place dès 1996, avant la mise en évidence du gène Lacaune. Il s’agissait d’écarter systématiquement les animaux avec un index de prolificité supérieur à 0,3 pour les femelles et 0,25 pour les mâles. Si cela permettait d’éviter de diffuser massivement des animaux très prolifiques et porteurs de la mutation suspectée, toutes les conséquences n’étaient pas positives. En effet, la prolificité ne dépend pas uniquement du gène Lacaune et on écartait aussi des animaux non porteurs, mais prolifiques par leurs gènes à petits effets. Or, ces derniers étaient intéressants pour le schéma. La stratégie de plafonnement des index n’était donc pas satisfaisante. Le gène Lacaune a ensuite été découvert et à partir de 2002, les mâles d’IA ont été génotypés. Les champs d’action restaient toutefois limités et l’utilisation de génotypage des femelles pour améliorer la gestion du gène dans la population a été envisagée. Diverses stratégies de gestion de la mutation ont alors été étudiées (Astruc, 2010) et notamment :
‐ La constitution d’une base de sélection composée de 100 % de brebis L+
‐ La constitution d’une base de sélection composée de 50 % de brebis L+ et de 50 % de brebis ++
La coopérative a pris le parti d’adopter la deuxième de ces stratégies. La première raison a été d’ordre économique. En effet, ces stratégies de sélection sont basées sur le génotypage des agnelles de renouvellement ce qui représente un investissement important de la part de la coopérative. La stratégie 50 % L+ et 50 % ++ nécessite le génotypage d’environ deux fois moins d’animaux que la stratégie 100 % L+ et est donc moins coûteuse. Cette stratégie présente en plus l’avantage de ne pas provoquer d’élimination systématique d’animaux sur la base de leur génotype. Une agnelle ++ d’un niveau génétique excellent par ailleurs ne pourrait pas être conservée pour le renouvellement dans le cas d’une base avec 100 % de L+. Enfin, pour des raisons de temps de travail ou encore de place en bergerie, une majorité d’éleveurs préfère conserver un troupeau mixte en termes de génotype, d’autant plus que la stratégie 50 % L+ 50%++ correspond déjà à une augmentation de la fréquence de l’allèle muté et donc à un maintien voire une augmentation de la prolificité moyenne de la population.
Le choix a donc été fait en 2010 de génotyper systématiquement toutes les agnelles de renouvellement (de façon à ce qu’à terme le génotype de toutes les femelles du troupeau soit connu) et d’accoupler par insémination les brebis L+ avec des mâles ++ et les brebis ++ avec des mâles L+, afin d’éviter la création d’animaux LL, tout en choisissant les animaux de renouvellement de façon à obtenir progressivement une base de sélection composée de 50 % de brebis L+ et de 50 % de brebis ++. En monte naturelle, seuls des béliers ++ sont utilisés, car sinon cela nécessiterait de constituer des lots de lutte en fonction du génotype ce qui serait
très contraignant. On comprend bien que la stratégie n’est applicable que dans le cas d’un schéma avec un fort taux d'IA (environ 40 % des agneaux sont issus d’IA dans la base de sélection et les animaux de renouvellement sont choisis uniquement parmi ces 40 %).
Le but de ce stage est d’évaluer l’impact du gène Lacaune sur les performances des brebis, et ce avec un nombre de données bien plus important que ce qui a pu être fait dans le passé. Ce stage sera également l’occasion de faire un état des lieux de la distribution du gène Lacaune dans la population Lacaune viande Ovi-Test sans biais d’échantillonnage, ainsi que de s’intéresser à la gestion de ce gène par la coopérative depuis 2010. De plus, la chaîne nationale d’indexation étant basée sur un modèle exclusivement polygénique, nous chercherons à évaluer l’importance du probable biais lié à la présence d’un gène majeur et à montrer qu’une prise en compte des génotypes dans le modèle d’indexation peut s’avérer nécessaire.
L’étude de l’effet du gène sur différents caractères, des fréquences génotypiques et de l’impact de ce gène majeur sur l’index prolificité, a fait l’objet d’un article scientifique (en cours de soumission à Genetic Selection Evolution (GSE)) qui sera présenté en partie I. Les accouplements par IA réalisés depuis 2010 seront étudiés dans une deuxième partie. Enfin, les conséquences de l’ensemble de ces résultats pour la coopérative seront discutées.
Partie I : Étude de la fréquence du gène Lacaune, de son effet sur
différents caractères et de son action sur l’index de prolificité
Cette partie de l’étude a fait l’objet de l’écriture d’un article scientifique, en cours de soumission au journal GSE. Cet article est présenté ci-après dans sa version originale, excepté la façon dont est citée la bibliographie. Pour faciliter la lecture, les références sont ici présentées par nom d’auteur(s) et non selon le format numérique choisi par GSE. L’article est suivi d’un résumé en français faisant état des principaux résultats et éléments de discussion.
- 1 -
Effects of the FecL major gene in the Lacaune meat
sheep population
Pauline Martin1§, Jérome Raoul1, Loys Bodin2
1
Institut de l’Elevage, BP 42118, 31321 Castanet Tolosan cedex, France
2
INRA, UR631 Station d'Amélioration Génétique des Animaux, F-31320 Castanet-Tolosan, France § Corresponding author Email addresses: PM: [email protected] JR: [email protected] [email protected] LB: [email protected]
- 2 -
Abstract
Background
The major gene of prolificacy FecL has been discovered in the Lacaune Ovi-Test meat sheep in 1998. Some studies have tried to estimate the gene effect on prolificacy but there were only few amounts of data available. In 2010, the cooperative Ovi-Test decided to genotype for FecL every replacement ewe lamb. The large amounts of data accumulated now allow a better estimation of the gene effects.
Methods
The animals used for this study were the ewes genotyped since 2010 and the sires genotyped since 2002. Performances and pedigree have been extracted from the French national database for genetic evaluation and research. The gene effect on different traits has been analysed with GLM or logistic models with SAS or genetic 'animal models' of linear or multinomial mixed models using the Asreml software.
Results
The female population is composed of 72% of homozygous wild type (++), 26 % of heterozygous (L+) and 2% of homozygous mutated ewes. The L+ ewes have on average 0.5 lamb more than ++ ones. The gene effect on prolificacy is not only on the means but on the variability too. The litter size variability of the ++ ewes is indeed lower than that of the L+. Under some conditions, the L+ have a higher fertility after insemination than the ++ ewes. In respect to the progeny of genotyped ewes, lambs of ++ dams are heavier (+300g) than lambs of L+ dams and the mortality of the twin lambs of ++ dams is lower than the mortality of the twin lambs of L+ dams. Moreover, the bias in the calculation of the estimated breeding values which ignores the existence of the major gene has been quantified.
Conclusions
The gene effect on prolificacy has been better estimated and some effects have been observed on other traits than prolificacy. With the different effects combined, the L+ ewes have produced more kilograms of lamb 30 days after lambing than the ++ ones.
- 3 -
Background
The Lacaune breed is the major sheep breed in France with around 1.2 million ewes. Within this breed, different strains exist depending on the purpose (dairy or meat) they are selected for. In 1975, the artificial insemination (AI) cooperative Ovi-Test designed a selection program to improve prolificacy in meat production farms. Prolificacy is famed difficult to select because of its low polygenic inheritance. However the improvement turned out to be better than expected and between 1975 and 1996, the mean prolificacy of ewe lambs mated in June-July at about 11 months of age increased from 1.28 to 1.98 (Bodin et al., 2002). This fast selection response, together with several other indications, suggested a non-polygenic inheritance and the segregation of a major gene in this population (Bodin et al., 2002).
Since 1982 and the first evidence of a major gene of prolificacy in Booroola Merinos (Davis et al., 1982; Piper and Bindon, 1982), various studies have demonstrated or suspected the existence of major genes in different breeds (Silva et al., 2010; Bodin et
al., 2011). In the Lacaune meat sheep population, two major genes of prolificacy were
evidenced. The FecXL (mutation C53Y of BMP15 gene, located on the X
chromosome, leads to high ovulation rate (1.5 additional ova) for heterozygous ewes and sterility for homozygous mutated ones (Bodin et al., 2007). The other gene, FecL, is located on the chromosome 11 and two SNP close or within the B4GALNT2 gene are candidate causal mutations (Drouilhet et al., 2009) (Drouilhet et al., 2013). There are two alleles of this gene and each copy of the mutated allele (named L) gives around 1.5 additional ova compared to the wild allele (named +).
In 2006, the frequency of these genes in the population was estimated by genotyping males of the AI centre (Drouilhet et al., 2009). The proportion of ewes with the mutated allele was estimated at 15% for FecXL and at 45% for FecL.
For these two genes, homozygous mutated animals are unsuitable for breeders (sterility for FecXL and too much prolificacy for FecL). Moreover, few on farm observations and experimental data (Bodin et al., 2006), showed that double heterozygous reach similar mean prolificacy to homozygous FecL animals. Because of the relative frequencies of each gene, the sterility induced by the BMP15 mutation, the too high prolificacy of homozygous FecL ewes and the too low prolificacy of wild type ones, the cooperative chose to eradicate the BMP15 mutation and manage the
FecL gene at the heterozygous state. Therefore, since 2002, all sires are genotyped for
the two genes and since 2010, every replacement ewe lamb is genotyped for FecL. In 2006, a study gave a first estimation of the FecL mutation effect on prolificacy (Bodin et al., 2006) but at this time, only few ewes of commercial flocks were genotyped and the study compared daughters of carrier and non-carrier sires. With the recent systematic genotyping, a large amount of data is now available. This study is aimed at estimating the effect of the FecL mutation on prolificacy based on a large and no selected sample. Potential effects on fertility after AI, progeny lamb growth and mortality will be analysed also. In addition, this study displays a bias in the calculation of estimated breeding values (EBV) for prolificacy in the Lacaune population, since they are estimated at the present time, with a model which does not take into account the segregation of major genes.
- 4 -
Materials and methods
Ovi-Test breeding program
The cooperative nucleus consists in 26 breeder flocks with 430 ewes per flock on average (from around 150 to 1000), which represents 11 201 ewes in june 2013. Most of the flocks perform 3 lambing in 2 years.
Male candidates to use in the nucleus are preselected in the farms when they are about 45 days old and they are genotyped for FecL at the entrance of the individual control station. They are there selected on their own performances of growth, fatness and conformation. The poorest ones (about 50%) are used for natural mating in the nucleus, sold outside or slaughtered; while the best ones follow the selection process and are submitted to a progeny test set up on farm by AI. The female used for replacement are chosen among the AI born lambs (around 40% of the lambs are born from AI in the nucleus). Then, their first mating will be a natural mating (AI were not allowed on ewe lambs in this breeding program).
In order to manage the FecL gene in accordance with the optimum prolificacy whished by the breeders, the Ovi-Test cooperative has fixed some mating rules. The objective is to achieve 50% of heterozygous ewes (named L+) and 50% of homozygous wild ewes (named ++) on average in the nucleus and to avoid creating homozygous mutated ewes (named LL). In case of AI, L+ and LL ewes have to be mated with ++ rams, and ++ females with L+ rams. Only ++ rams can be used for natural mating.
Genotyping
From 2004 to 2009, the presence of the FecL mutation was predicted by an allelic combination of three microsatellites determining an L-haplotype which was never found in wild-type chromosomes (Bodin et al., 2002; Drouilhet et al., 2009). Since 2009 all FecL genotyping done in the nucleus are made through DLX3:c.*803A>G (GenBank accession number FJ654646) which is a SNP in a high linkage disequilibrium with the FecL mutation (<1% recombination) and located in the DLX3 gene 3' UTR sequence (Drouilhet et al., 2009). Until a recent past, it was the best suitable marker that INRA could transfer to Aveyron-labo: the commercial genotyping company which at the present time, performs genomic analysis for the Lacaune breed.
Origin and selection of data
All the data concerning the animals (performances and pedigree) have been extracted from the national database for genetic evaluation and research managed by the Institut de l’Elevage (French Livestock Production Institute) and the CTIG (Centre de Traitement de l'Information Génétique, Jouy en Josas, France).
Only females born since 2010 (Beginning of the constant replacement ewe genotyping) and sires genotyped since 2002 and used in the nucleus have been kept for the study (n=5850 and 1025 respectively). For some analysis, there were too few LL ewes for an accurate estimation of this genotype level, In this case, they were removed and comparison were about ++ and L+ genotypes only.
- 5 -
Statistical analysis
Genotypic frequencies
Estimations of the allelic and genotypic frequencies were calculated separately on the female and male populations. The potential changes between year as well as the Hardy Weinberg equilibrium were tested with a Chi-squared test.
Analyse of the gene effect on different traits
There were many variation factors which could affect the 4 traits analysed in addition to the genotype of the ewe. All these variation factors have been coded as close as possible to those of the national genetic evaluation. Not all the factors could have been tested for each model because of the structure of the data. The list of the variation factors tested for each trait is presented in table 1. The fixed effects and all one-way interactions with biological meaning included in the models were preliminary selected step-by-step by comparing the R² of the different models.
Litter size (LS)
As for the other traits, linear models to adjust the environmental effects were fitted using the GLM procedure of SAS version 9.2 (SAS®, 1999). To be more precise, the flock effect for a lambing was defined in these models by a combination of the farm number, the year of lambing and the season of lambing. The age at first lambing was codified into three classes (between 3 and 16 months, between 16 and 19 days and between 19 and 50 months). Once the final model was chosen, estimation of fixed effects and variances were obtained running “animal models” using Asreml software (Gilmour et al., 2002). In these genetic analyses, the genetic effects are correlated and the correlation expected form polygenic additive genetic effects were derived from the pedigree information provided in the pedigree file. The distribution of raw LS is displayed by genotype on table 2.
Litter size is a categorical trait that has to be analysed by a threshold model (Gianola, 1982) assuming the existence of an underlying normal variable and a set of thresholds which determine the observed categories. In this study, a threshold animal mixed model (Model_1) was fitted with animal as a random effect and the fixed effects chosen at the previous step (table 1). The model considered one set of thresholds common to ++ and L+ genotypes as well as their interaction with the genotype; resulting in a set of thresholds for each genotype. To avoid extreme case problems, the few LL ewes as well as some small flocks were removed from this analysis and litters higher than 3 were gathered in a unique class.
Two linear animal mixed models on the observed scale (Model_2 and _3) which provided estimations of variances, heritability and estimations of effects easier to interpret were fitted also on the whole data set (including LL ewes). In Model_2, the genotype was included as a fixed effect, and as a factor of residual variance heterogeneity, while in Model _3 the genotype effect was totally ignored. This last model, was aimed at estimating the importance of the major gene on the genetics parameters. Heritabilities were computed at the ratios of animal variances on the sum of the animal and the residual variances. Model_1 involved 4260 records from ++ and L+ ewes while Model _2 and _3 included 5595 litter size.
Lambweight at 30 days of age (30dLW)
This analyse aimed to observe the effect of the dam genotype on the lambweight at 30 days of age. It was carried out only on 17 flocks weighing of all lamb born at about 30 days of age. The analysed variable was the estimated weight at 30 days (30dLW) which is used as maternal abilities selection criterion in the Ovi-Test breeding program. Since not all the lambs were weighed at exactly 30 days, the 30dLW was calculated by a linear regression using the actual weight at the given age and a fixed
- 6 -
birth weight for each lamb category (sex ; litter size). The 30dLW was analysed on 3905 lambs with the GLM procedure of SAS version 9.2 (SAS®, 1999).
Mortality from birth to 30 days of age
The effect of the dam’s genotype on lambs survival has been studied through the lamb mortality from birth to 30 days of age. It was not possible to include the sex as a fixed effect because the stillborn genders are unknown. The rearing type and rearing method (maternal, fostering, artificial) have been discarded for similar reasons. The flock effect and the physiological status of the dam used in the national genetic evaluation needed to be split to avoid some quasi-complete separation of data points. The LL ewes have been discarded. This analysis was made on 8338 lambs using the Logistic procedure of SAS version 9.2 (SAS®, 1999).
Gene effect on AI fertility
Since ewe lambs should never be inseminated in this selection nucleus, the data sample to evaluate the effect of the genotype on the AI success concerned a particular sample of ewes. They were ewes older than 14 months and already primiparous when inseminated. Due to the very low number of inseminated LL ewes, they have been discarded, so as the ewes which have suckled 3 or more lambs at their last suckling. The fixed effects which were considered for this trait are showed in the table 1. However for this sample, the interval since the last lambing was considered as a covariate and the season has been divided into three periods (November to March, April, and May to July). Finally, for the 1208 available ewes, the AI was considered as fertile if a lambing occurred between 142 and 152 days after it was made. As mortality, AI success is a discrete variable which has been analysed using the Logistic procedure of SAS version 9.2 (SAS®, 1999). Furthermore, to obtain estimates easier to interpret, a GLM procedure with the same sample was run too.
Estimated breeding values
The analyses were conducted with AI rams born in 2009 in one hand, and all the genotyped ewes born in 2011 on the other hand. The EBVs were issued from the national breeding evaluation system run by INRA for the suckling sheep. At the present time an animal model on the normal scores (transformed variable) is running without considering the presence of the Lacaune major gene. In this study, for a given animal, two type of EBV were considered. The “current EBV” was directly obtained from the national breeding evaluation; it takes into account a combination of the animal’s own performances and those of all its family,. The “mid-parental EBV” was calculated as the average EBVs of its parent; it gives an indication about the mid-parental genetic value calculated on ancestry (i.e. full sib have in essence the same "mid-parental EBV" but different "current EBV"). This indicator is a little bit distorted because the performances of an animal are taken into account in its parent EBVs but it is the best simple indicator we could easily dispose.
The average change by genotype between “mid-parental EBV” and “current EBV” and differences between genotypes were compared with Student t-tests. This analysis was carried out on prolificacy EBV. Nine ++ sires and 8 L+ sires as well as 856 ++ and 309 L+ ewes were used.
Results
Genotypic frequencies
The genotypic frequencies of the female genotyped population are shown in Table 3 by year of birth and the genotypic frequencies of the sires are shown in Table 4. The frequency of the mutation (L allele) in the replacement females was 15.2%. For these
- 7 -
females the frequencies of genotypes were very stable and did not depend on the year of birth (P (²) =0.99); globally they did not satisfy the Hardy-Weinberg equilibrium (P (²) =0.05). Moreover, these frequencies varied between the farms; from 62.1 to 81.7% (µ [] = 70.5 [5.2]) for ++, from 17.9 to 34.7% (27.3 [4.6]) for L+ and from 0.0 to 6.3 (2.15 [1.4]) for LL ewes.
The frequency of the mutation was slightly higher in sires genotyped from 2002 to 2013 (17.4%) resulting in slightly different genotypic frequencies than in females (P(²) = 0.02) but satisfying the proportion of the Hardy-Weinberg equilibrium (P(²) = 0.99).
Litter size
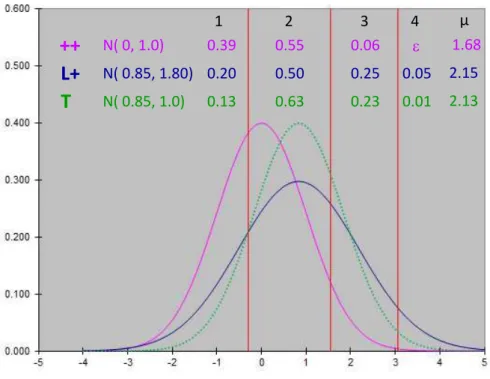
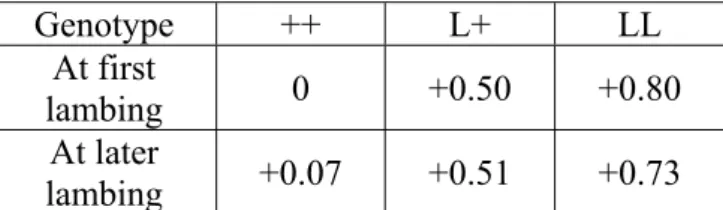
In Model_1, the interaction between thresholds and genotype was significant (P<0.01); that means that considering a set of thresholds for each genotype fitted the data better than using a common set of thresholds and an effect of the genotype on the mean of the underlying variable. As expected, the estimations of thresholds were lower for the prolific L+ ewes than for the ++ ewes (table 1; annexe 1), but there was not a simple translation of the set of thresholds between genotypes. The gap between the 2 first thresholds was indeed higher for the ++ ewes (=1.83) than for the L+ ones (=1.37) and the ratio of these gaps was similar to the ratio of the gaps between the third and the second thresholds. These proportional transformation of the thresholds between ++ and L+ ewes is totally equivalent to a change of the underlying variance on a common set of thresholds and can be viewed as an increase of 81% of the underlying variance of the L+ ewes (table 1 ; annexe 1). The figure 1 displays, the distribution of LS of ++ according to the thresholds estimated for ++ and the distribution of L+ ewes according to the same set of threshold but standardized by the variance of the L+ ewes. This figure shows also the theoretical distribution of a population having the increased L+ mean but conserving the ++ variance. The thresholds estimated by this model permitted to calculate for the ++ and L+ ewes the estimated percentages of each litter free of the other fixed effects. These percentages are displayed in table 5 along with the raw observed distribution of LS. The resulted prolificacy was 1.67 for ++ ewes and 2.14 for L+ ewes which corresponded to a difference of 0.47 lamb between these genotypes.
The linear mixed model (Model_2) ran on the whole data set, provided a highly significant effect of the genotype (P<0.001); the LS difference between ++ and L+ ewes on this observed scale was 0.50 (table 6). That was higher than the significant difference between L+ and LL ewes (+0.35 for LL). However an interaction with the lambing rank was found (P<0.01); the genotype effect was higher at first lambing than later (table 7). An induced oestrus increased the prolificacy by 0.12 (P<0.01), and no interaction was found between the genotype and the type of oestrus. The flock and the month of lambing were the two other factors having a significant effect on the LS. On this observable scale the increase of prolificacy induced by the gene effect was associated with a larger residual variance. Consequently the presence of the major gene lead to a lower polygenic heritability which was 0.13 for the ++ genotype and 0.08 for the L+ one (table 6). As expected, the additive genetic variances were higher with the Model_3 which did not include the genotype (²a =0.084 in Model_3
vs 0.055 in Model_2). In this population, heritability of LS was 0.15 if the presence of the major gene was ignored.
- 8 -
Lambsweight at 30 days of age
The genotype of the dam, the flock, the month of lambing, the physiological status of the dam, the lamb sex, its birth type and rearing type had all a significant effect on the 30dLW. Males were heavier than females and the weight decreased when the birth type or the rearing type increased. Although all possible variation factors linked to the dam prolificacy but independent of the FecL genotype were taken into account, at 30 days of age lambs of ++ dams were about 300g heavier (p<0.01) than lamb of L+ or LL dams. This difference accounted for about 3% of the lamb weight at this age.
Lamb mortality
The flock, the interaction between the flock and the year, the month of lambing, the birth type, the interaction between the birth type and the dam genotype and the lambing rank had a significant effect on the risk of mortality. The difference between the genotypes was significant only in case of a twin litter (P=0.0003). In order to characterize better this effect, the model was run again with twin lambs only. The twin lambs of a L+ dam had a higher probability of dying than twin lambs of a ++ dam (15% VS 11% with the raw data) and the odd ratio (++/L+) was 0.68 (confidence interval: [0.55-0.84]).
AI fertility
The raw fertility observed after AI wass high (0.74) and higher for L+ (0.79) than for ++ (0.72) ewes. According to the results of the logistic model, the L+ ewes were significantly more fertile than the ++ ones (P=0.008) and the fertility decreased with a higher number of lambs suckled at the later suckling (P<0.0001). The flock and the interval between the previous lambing and the insemination affected the fertility too (P<0.0001 and P=0.044 respectively). The GLM procedure comforted these results. The estimates of fertility by genotype and by last suckled litter size, and the comparison of the estimates between genotypes are presented in table 8. L+ ewes were more fertile than ++ ones whatever the suckled litter size but the difference between genotype was significant only for a suckled litter size of one lamb.
Breeding values of prolificacy
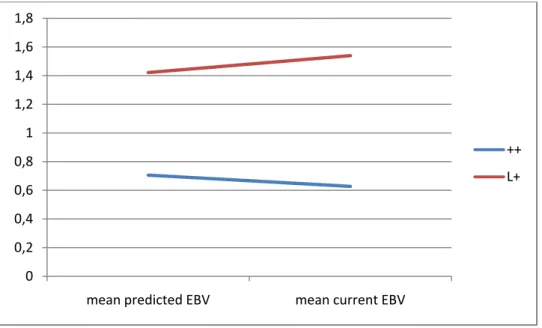
The results are presented in Figure 2 for the sires and Figure 3 for the ewes. They are expressed in EBVs standard deviation units, which means that the raw EBV are divided by the EBV standard deviation of all the animals of a given sex born the same year (=0.16 for the males of 2009 and =0.10 for the females of 2011).
The mid-parental EBV were higher for L+ than for ++ ewes (P<0.0001) and it was the same for the current EBV (P<0.0001). The current EBV was higher than the mid-parental EBV for L+ ewes (P<0.0001) and the opposite was observed for ++ ewes (P<0.0001).
There was no significant difference between mid-parental EBVs of the ++ males and the L+ ones (P=0.28) but, as for females, the L+ sires tended to have a higher current EBV than the ++ ones (P=0.06). The individual differences between the mid-parental and the current EBV were not significant whatever the genotype, but the probabilities were not far from the tendency (P=0.14 for ++ and P=0.11 for L+).
- 9 -
Discussion
Allelic and genotypic frequencies
The genotypic frequencies observed in females were not exactly the same as those estimated in 2006 (Ovi-Test, personal communication). Two reasons can explain these differences. Firstly, the study of 2006 was based only on probabilities with few genotyped animals. This study was also less precise. Moreover, before genotyping constantly replacement ewes, the cooperative had a strategy of limitation on animals genetically estimated as very prolific. Males with an estimated breeding value (EBV) on prolificacy higher than 1.5 standard deviation units, and ewe with an EBV higher than 3 standard deviation units, were automatically discarded from the breeding program. This strategy, put into practice between 1996 and 2010 to avoid too prolific animals, has probably reduced the proportion of L+ animals.
The high genotype stability observed since 2011 is not really surprising despite the objective of the cooperative to achieve 50% of L+ ewes. The first year with a large number of genotyped ewes ready for insemination was 2012 and a too sudden change would not be suitable.
The large difference of genotypic frequencies observed between flocks was relatively surprising since all replacement ewes in the nucleus are issued from collective AI sires. This rule was set up at the beginning of the selection scheme in 1975 and is still compulsory. Therefore these differences might result on strategy differences set up by individual breeders in selecting their replacement ewes. Some breeders could select ewe lambs born as triplet, and likely issued from carrier dams, while other would avoid keeping these smaller ewe lambs. This counter-selection together with the higher mortality of progeny issued of prolific carrier ewes explains also the deviation to the Hardy-Weinberg equilibrium observed for females. In contrast, the male selection strategy is decided by the cooperative as a group strategy. It favours a little bit the carrier males counterbalancing their higher mortality and brings back the male genotypic frequencies into the Hardy-Weinberg equilibrium.
Effects on prolificacy
On these farm data, where ovulation rate could not be recorded, the major effect of the FecL gene is on the prolificacy mean. The increase of about 0.5 lamb per lambing for one copy of the gene is of the same order of magnitude as the effect of all other known major gene. However, that is slightly lower than the 0.9-1.2 LS increase of Booroola ewes carrying a single copy of the gene as reported by Piper et al. (Bindon
et al., 1985). This effect is also similar to the lowest effect of the Booroola gene stated
in the extensive review made by Fogarty (Fogarty, 2008). It is also lowest than the effect of a single copy the BMP15 gene; either carrying the Hanna (Davis et al., 1991) or the Inverdale (Davis et al., 1992) mutations, the Belclare or Galway mutations (Hanrahan et al., 2004), as well as the Rasa Aragonesa (Monteagudo et al., 2009), the Lacaune (Bodin et al., 2007) or the Olkuska (Demars et al., 2013) mutations. However this effect seems much higher than the effect of the Grivette mutation of the same BMP15 gene (Demars et al., 2013). The 4 known mutations of the GDF9 genes induce also slightly higher increase of LS at the heterozygous status in their respective Belclare (Hanrahan et al., 2004), Thoka (Nicol et al., 2009), Santa Ines (Silva et al., 2010) or Norwegian White Sheep populations (Vage et al., 2013). As for most mutations which do not induce sterility at the homozygous level, the mean prolificacy of homozygous LL ewes is too high (+0.85 comparing to ++ ewes) and cannot be useful for breeders.
- 10 -
The significant interaction between the set of thresholds and the genotype associated with the proportional gap between the thresholds can be interpreted as a double effect of the genotype: on the mean and on the residual variance of the underlying variable. If the gene had an effect on the mean only, it would induce a similar increase of the prolificacy mean but with a much more concentrated distribution of LS; in particular the change from ++ to L+ would increase the percentage of twin lambing up to 63% (figure 1). The increase of variability also appeared with the linear mixed model in which a heterogeneous residual variance was associated to the genotype. However in this case the variance increase might come from a mixture of a scale effect and an actual genotypic effect, which is by essence not the case with the threshold model. At our knowledge, it is the first time that a major gene controlling the LS is reported to have an effect on the variability of the trait. The low number of LL ewes did not allow to estimate if the homothetic change of thresholds is still conserved when adding a second copy of the gene and if with new LS class, the figure is totally changed.
This effect is perhaps not general to all major genes affecting LS in sheep and could results of the particular physiology of the Lacaune gene. We know that in contrast to other mutations, the FecL mutation induces shorter delays of pre-ovulatory LH and FSH surges after sponge withdrawal (Drouilhet et al., 2010). We also know that treatments of oestrus synchronisation which also modify these events have an important effect on the variability of LS (Bodin and Elsen, 1989). It would be of great interest to know if L+ ewes synchronized with the classical synchronisation treatment (vaginal sponge impregnated with FGA and PMSG injection at withdrawal) present a further increase of their LS variability comparing with the non-treated L+ ewes.
The analysis of genetic parameters done with the linear mixed model provided heritability in agreement with the literature (Matos et al., 1997; Janssens et al., 2004; Baelden et al., 2005). However the additive genetic variance which is in the upper limit of the classical range included in our case the permanent environmental variance which could not be separated efficiently. Although the heritability of LS ignoring the existence of the major gene was biased, the value was lower than the very high estimates found in the same Lacaune population in 1988 after 12 years of intensive selection for prolificacy (h²=0.37 (Bodin et al., 1988), or in 2001 after 25 years of selection (h²=0.39 (SanCristobal-Gaudy et al., 2001). The lower value found at the present time would result of strong management rules applied since about 12 years to avoid a too fast dissemination of the gene and overall the creation of homozygous animals. It would result also of the eradication of the BMP15 C53Y mutation which was segregating at this time (Bodin et al., 2007). Finally, according to the gene effect and its frequency in the present Lacaune population the FecL gene accounted for a very large part (35%) of the total additive genetic variance; that might explain the fast increase of genetic progress observed in this population.
30dLW
The effect of the FecL gene of the dam on lambs ‘weight at 30 days is quite surprising; no similar effect have ever been described for a major gene of prolificacy. The measured variable does not allow determining if the difference between lambs comes from the birth weight, the growth between 0 and 30 days or both. A birth weight difference could result from a higher rate of embryonic loses in the mutated ewes. It has been seen that in case of embryonic loses, the remainders foetus are lighter than foetus issued of similar litter size but without embryonic loses (Hinch et
al., 1985). The possible influence of the dam’s genotype on embryonic mortality need
- 11 -
days of age comes from different maternal abilities between the two genotype. It can be assumed that this difference of dairy capacities exist but is not directly a gene effect. In the breeding program, animals are selected on a synthetic index combining prolificacy and dairy EBVs. Thus an animal with a very good prolificacy EBV will be selected even if its dairy EBV is not very high and conversely an animal with a very high dairy value will be selected even if its prolificacy value is slightly below the average. But L+ animals have on average a higher prolificacy EBV than ++ ones. It is therefore possible that the large difference of prolificacy EBV between ++ and L+ animals had led to a counter-selection on the maternal ability of the L+ ewes.
Lamb mortality
The probability of dying is higher for twins lambs issued from a L+ than from a ++ dam. This result is surprising. Indeed, the birth type effect of the lamb on their mortality is well documented (see for instance (Gama et al., 1991; Matos et al., 1997)), and the effect of the Lacaune genotype most probably results from the higher ovulation rate and pregnancy wastage of the L+ ewes as it occur for F+ Booroola ewes (Hinch et al., 1985). But there is no clear explanation about the interaction between these two effects, except the low statistical power of the test due to the number of single issued from L+ ewes and triplets born from ++ ewes. However, if such differences exist, they are probably lower than the one observed for the litter size of 2, in particular for the mode of litter size of 1 which has already a large amount of data and a high associated P value.
Gene effect on fertility
AI success was very high in this sample and higher than the value reported in dairy Lacaune (David et al., 2008) even though this strain is famed to get very high AI results. In our sample, the age of the ewes and the insemination periods are favourable; these factors associated with a good year could explain this high success rate.
Only the fertility of ewes which have suckled 1 lamb at their previous lambing differs significantly between the genotype. However, even though this difference is not significant, the L+ ewes which had suckled 2 lambs, were more fertile than ++ ones by 5 points of percentage (66% VS 71%). To make significant such a difference, it should have had 3 times more ewes, and with the current number of ewes rearing twins, only differences higher than 8 points of percentage would have been evidenced. significantly. We can supposed that L+ are more fertile than ++ ewes whatever the number of previous suckled lambs, but the power of the design was not high enough to make this difference significant. Moreover no biological hypothesis could be made to explain why the interaction between the genotype and the previous number of reared lambs was significant for fertility. .
If the higher fertility of Lacaune carrier ewes is confirmed, it would be, at our knowledge, the first report that a major gene controlling prolificacy presents an effect on fertility, excepting some BMP15 and GDF9 mutations when they are at the homozygous status.effect. This effect could be explained by the particular endocrine profile of the LL ewes compared with ewes carrying mutations of the other major genes (BMPR1B, BMP15, GDF9) (Drouilhet et al., 2010). Indeed, after FGA sponge withdrawal, FSH and LH surges appear 20 hours earlier in LL than in ++ ewes (Drouilhet et al., 2010). Although these results were observed without the PMSG injection which follows the progestative treatment at the time of insemination, the difference of delay in the LH surge might explain the effect on fertility due to a
- 12 -
difference in the optimum time for AI after sponge withdrawal. However the higher fertility of L+ ewes indicates that the delay between the end of treatment and AI is not optimum for the ++ Lacaune ewes. Before changing this delay, more data have to be accumulated and analysed taking into account other potential variation factors (David
et al., 2008) which were not available in our study. Prolificacy EBV
As expected, mid-parental EBV on ancestry are on average underestimated for L+ ewes and overestimated for ++ ewes. The difference between mid-parental and current EBVs was higher than 1 standard deviation and clearly shows a bias in the EBV estimation on “ancestry” when the presence of the major gene is not considered in the evaluation model. Before changing all the evaluation system, a first improvement could be made by simply estimating a pseudo polygenic mid-parental EBV by removing or adding a standard genetic effect of the genotype from the individual mid-parental EBV. Since this genotype is known before selection for replacement is decided, that would permit a better selection of males on their polygenic value.
The difference between mid-parental EBV according to the genotype of the progeny is another point important to notice. If some parental matings (i.e. sire ++ x dam L+ and sire L+ x dam ++) give ++ and L+ progeny without difference of mid-parental EBV, some ++ progeny are issued from ++ sires and ++ dams which do not have a centered mid-parental EBV. It is therefore possible to split the mid-parental ewe EBV of each genotype according to the type of mating as presented in Figure 3. The low number of sires used in this analysis might explain the absence of difference of the mid-parental EBV for ++ and L+ sires. The selection strategy which is a little bit different between males and females might lead also to a lower difference or an absence of difference of EBV on ancestry between the genotypes.
It can be noticed too that the evolution between EVB on ancestry and the current EBV is stronger for the males than for the female. This difference comes from the number of own performances (or progeny’s performance) between males and female. The females have only 2 or 3 lambing while two years old males have already between 30 and 50 daughters having each 1 to 3 lambings. Thus the importance of ancestry in the calculation of the current EBV is widely higher for the females than for males.
Conclusions
The large amount of FecL genotyping accumulated in the Lacaune Ovi-Test population since 2011 allowed a better knowing of the genotypic frequencies as well as of the gene effect on few important traits for the breeders. At first lambing, combining the genotype effects on prolificacy, lamb mortality and growing rate until 30 days lead to a superiority of +6% more kilo of lambs produced at 30 days by L+ ewes. If the weight difference remained after the age of 30 days and since lambs are all slaughtered at the same weight, then the L+ dams would produce 15% more kilo of lambs than the ++ dams. However, lambs of L+ dams would have to be fattened a little bit longer. The higher litter size variability of the L+ ewes would lead to a higher need of workload and equipment for artificial rearing. This may decrease the gene interest.
- 13 -
Competing interests
The authors declare that they have no competing interests.
Authors' contributions
PM, JR and LB jointly conceived the design of the study and discussed the results. PM extracted, computed the data and performed the statistical analysis. PM wrote the first draft of the manuscript, which was then modified by LB and discussed with other co-authors. All authors read and approved the final manuscript.
Acknowledgements
The authors would like to thank the OVI-Test breeding associations for the data provided, and XXX for linguistic revision.
References
Baelden, M., Tiphine, L., Poivey, J.P., Bouix, J., Bibe, B., Robert-Granie, C., Bodin, L., 2005. Estimation of genetic parameters for litter size after natural and hormone-induced oestrus in sheep. Livestock Production Science 97, 275-281.
Bindon, B.M., Piper, L.R., Cummins, L.J., O'Shea, T., Hillard, M.A., Findlay, J.K., Robertson, D.M., 1985. Reproductive endocrinology of prolific sheep : studies of the booroola merino. Genetics of Reproduction In Sheep chapter 23, 217-235. Bodin, L., Bibe, B., Blanc, M.R., Ricordeau, G., 1988. Genetic relationship between
prepuberal plasma FSH levels and reproductive performance in Lacaune ewe lambs. Genet. Sel. Evol. 20, 489-498.
Bodin, L., Di Pasquale, E., Fabre, S., Bontoux, M., Monget, P., Persani, L., Mulsant, P., 2007. A novel mutation in the bone morphogenetic protein 15 gene causing defective protein secretion is associated with both increased ovulation rate and sterility in Lacaune sheep. Endocrinology 148, 393-400.
Bodin, L., Elsen, J.M., 1989. Variability of litter size of French sheep breeds following natural or induced ovulation. Anim Prod 48, 535-541.
Bodin, L., Lecerf, F., Bessière, M., Mulsant, P., 2006. Features of major genes for ovulation in the Lacaune population. Proceedings of the 8th WCGALP, Bello Horizonte, Brazil.
Bodin, L., Raoul, J., Demars, J., Drouilhet, L., Mulsant, P., Sarry, J., Tabet, C., Tosser-Klopp, G., Fabre, S., Boscher, M.Y., Tiphine, L., Bertrand, C., Bouquet, P.M., Maton, C., Teyssier, J., Jouannaux, C., Hallauer, J., Cathalan, D., Gueux, J., Pocachard, M., 2011. Etat des lieux et gestion pratique des gènes d'ovulation détectés dans les races ovines françaises. 18èmes Rencontres Recherches Ruminants, Paris, France, 7-8 Décembre 2011, pp. 393-400.
Bodin, L., SanCristobal, M., Lecerf, F., Mulsant, P., Bibe, B., Lajous, D., Belloc, J.P., Eychenne, F., Amigues, Y., Elsen, J.M., 2002. Segregation of a major gene
influencing ovulation in progeny of Lacaune meat sheep. Genet. Sel. Evol. 34, 447-464.
- 14 -
David, I., Robert-Granie, C., Manfredi, E., Lagriffoul, G., Bodin, L., 2008.
Environmental and genetic variation factors of artificial insemination success in French dairy sheep. Animal 2, 979-986.
Davis, G.H., McEwan, J.C., Fennessy, P.F., Dodds, K.G., Farquhar, P.A., 1991. Evidence for the presence of a major gene influencing ovulation rate on the X chromosome of sheep. Biol. Reprod. 44, 620-624.
Davis, G.H., McEwan, J.C., Fennessy, P.F., Dodds, K.G., McNatty, K.P., O, W.S., 1992. Infertility due to bilateral ovarian hypoplasia in sheep homozygous (FecXIFecXI) for the Inverdale prolificacy gene located on the X chromosome. Biol. Reprod. 46, 636-640.
Davis, G.H., Montgomery, G.W., Allison, A.J., Kelly, R.W., Bray, A.R., 1982. Segregation of a major gene Influencing fecundity in progeny of Booroola sheep. NZJAR 25, 525-529.
Demars, J., Fabre, S., Sarry, J., Rossetti, R., Gilbert, H., Persani, L., Tosser-Klopp, G., Mulsant, P., Nowak, Z., Drobik, W., Martyniuk, E., Bodin, L., 2013. Genome-Wide Association Studies Identify Two Novel BMP15 Mutations Responsible for an Atypical Hyperprolificacy Phenotype in Sheep. Plos Genetics 9.
Drouilhet, L., Lecerf, F., Bodin, L., Fabre, S., Mulsant, P., 2009. Fine mapping of the FecL locus influencing prolificacy in Lacaune sheep. Anim Genet 40, 804-812. Drouilhet, L., Mansanet, C., Sarry, J., Tabet, C., Bardou, P., Woloszyn, F., Lluch, J.,
Harichaux, G., Viguie, C., Monniaux, D., Bodin, L., Mulsant, P., Fabre, S., 2013. The highly prolific phenotype of Lacaune sheep is associated with an ectopic expression of the B4GALNT2 gene within the ovary. Plos Genetics in press. Drouilhet, L., Taragnat, C., Fontaine, J., Duittoz, A., Mulsant, P., Bodin, L., Fabre, S.,
2010. Endocrine Characterization of the Reproductive Axis in Highly Prolific Lacaune Sheep Homozygous for the FecL(L) Mutation. Biol. Reprod. 82, 815-824. Fogarty, N.M., 2008. Environmental modulation of FecB expression. International
Workshop on Booroola Gene, Pune, India.
Gama, L.T., Dickerson, G.E., Young, L.D., Leymaster, K.A., 1991. Genetic and phenotypic variation in sources of preweaning lamb mortality. Journal of Animal Sciences 69, 2744-2753.
Gianola, D., 1982. Theory and analysis of threshold characters. J Anim Sci 54, 1079-1096.
Gilmour, A.R., Gogel, B.J., Cullis, B.R., Welham, S.J., Thompson, R., 2002. ASReml User Guide Release 1.0. V. I.
Hanrahan, J.P., Gregan, S.M., Mulsant, P., Mullen, M., Davis, G.H., Powell, R., Galloway, S.M., 2004. Mutations in the genes for oocyte-derived growth factors GDF9 and BMP15 are associated with both increased ovulation rate and sterility in Cambridge and Belclare sheep (Ovis aries). Biol. Reprod. 70, 900-909.
Hinch, G.N., Kelly, R.W., Davis, G.H., Owens, J.L., Crosbie, S.F., 1985. Factors affecting lamb birth weights from high fecundity Booroola ewes. Anim Reprod Sci 8, 53-60.
Janssens, S., Vandepitte, W., Bodin, L., 2004. Genetic parameters for litter size in sheep: natural versus hormone-induced oestrus. Genet. Sel. Evol. 36, 543-562. Matos, C.A.P., Thomas, D.L., Gianola, D., Tempelman, R.J., Young, L.D., 1997.
Genetic analysis of discrete reproductive traits in sheep using linear and nonlinear models .1. Estimation of genetic parameters. J Anim Sci 75, 76-87.
Monteagudo, L.V., Ponz, R., Tejedor, M.T., Lavina, A., Sierra, I., 2009. A 17 bp deletion in the Bone Morphogenetic Protein 15 (BMP15) gene is associated to
- 15 -
increased prolificacy in the Rasa Aragonesa sheep breed. Anim Reprod Sci 110, 139-146.
Nicol, L., Bishop, S.C., Pong-Wong, R., Bendixen, C., Holm, L.E., Rhind, S.M., McNeilly, A.S., 2009. Homozygosity for a single base-pair mutation in the oocyte-specific GDF9 gene results in sterility in Thoka sheep. Reproduction 138, 921-933. Piper, L.R., Bindon, B.M., 1982. Genetic segregation for fecundity in Booroola
Merino sheep. Proceedings of the World Congress On Sheep And Beef Cattle Breeding, Palmerston North, NZ, pp. 395-400.
SanCristobal-Gaudy, M., Bodin, L., Elsen, J.M., Chevalet, C., 2001. Genetic components of litter size variability in sheep. Genet. Sel. Evol. 33, 249-271. Silva, B.D.M., Castro, E.A., Souza, C.J.H., Paiva, S.R., Sartori, R., Franco, M.M.,
Azevedo, H.C., Silva, T., Vieira, A.M.C., Neves, J.P., Melo, E.O., 2010. A new polymorphism in the Growth and Differentiation Factor 9 (GDF9) gene is associated with increased ovulation rate and prolificacy in homozygous sheep. Anim Genet 42, 89-92.
Vage, D.I., Husdal, M., Kent, M.P., Klemetsdal, G., Boman, I.A., 2013. A missense mutation in growth differentiation factor 9 (GDF9) is strongly associated with litter size in sheep. Bmc Genetics 14.
- 16 -
Figures
Figure 1: Illustration of
- the estimated thresholds for ++
- the underlying variable (in purple) with mean 0 and variance 1 providing the estimated proportions of each ++ LS.
- the underlying variable (in blue) with the standard deviation which
corresponds to the L+ ewes providing the estimated proportion of each L+ LS. - a theoretical underlying variable (in dot green) with the difference of the underlying mean between L+ and ++ ewes but the same uderlying residual variance than ++ ewes.
++
L+
0.39 0.55 0.06 0.20 0.50 0.25 0.05 N( 0.85, 1.80) N( 0, 1.0)T
N( 0.85, 1.0) 0.13 0.63 0.23 0.01 1.68 2.15 2.13 1 2 3 4 µ- 17 -
Figure 2: Difference in EBVs standard deviation units between genotype for the mean “mid-parental EBV” and the mean “current EBV” of the AI males born in 2009 0 0,2 0,4 0,6 0,8 1 1,2 1,4 mean predicted EBV mean current EBV ++ L+
- 18 -
Figure 3: Difference in EBVs standard deviation units between genotype for the mean “mid-parental EBV” and the mean “current EBV” of the genotyped ewes born in 2011 0 0,2 0,4 0,6 0,8 1 1,2 1,4 1,6 1,8 mean predicted EBV mean current EBV ++ L+
- 19 -
Figure 4: Supposition of a separation of the ++ figure and of the L+ figure upon parents ‘genotype
- 20 -
Tables
Animal effects LS AI fert 30dLW Mort
Flock (flock, year, season) √ √ Flock √ √ Year √ Season √ Month √ √ √ Sex √ Genotype √ √ Birth type (1, 2, 3, 4, 5, 6, …) √ √ √ Birth type (1, 2, 3, 4+) √ Rearing mode (natural, fostering, artificial) √ √ Rearing type √ √ √ Interval last lambing √ LS previous suckling √ Age 1st lambing (3 classes) √ Lambing rank √ Oestrus type (natural ; hormonal treatment) √ Dam effects Dam genotype √ √ Physio status ( Rearing mode √ √ Rearing type √ √ Lambing rank √ √ Age 1st lambing √ √ LS previous lambing √ Interval last lambing ) √ Birth type √
- 21 - Genotype 1 2 3 4 5 6 Total ++ 1528 2176 322 39 5 1 4071 0.37 0.53 0.08 0.01 0.001 L+ 291 679 374 83 10 1437 0.20 0.47 0.26 0.06 0.01 LL 17 32 24 10 2 2 87 0.20 0.37 0.28 0.11 0.02 0.02
Table 2: Distribution of observed LS by genotype on the whole data set
Frequencies for ewes born in :
Genotype Number Total
frequencies 2011 (n=2064) 2012 (n=2033) 2013 (n=1678) ++ 4186 71.6 71.1 72.7 70.1 L+ 1548 26.4 26.8 25.3 27.9 LL 116 2.0 2.1 2.0 2.0
Table 3: Genotypic frequencies of the 5850 genotyped females, total and by campaign of birth (in percent).
Genotype Number of sires Total frequencies ++ 699 68.2 L+ 295 28.8 LL 31 3.0
- 22 - % of LS Genotype 1 2 3 4 and more Mean Prolificacy ++ Estim. Model_1 0.39 0.55 0.06 0 1.67 Obs. 0.39 0.54 0.06 0.01 1.69 L+ Estim. Model_1 0.20 0.50 0.25 0.05 2.14 Obs. 0.21 0.48 0.25 0.06 2.16
Table 5: Estimated percentage of LS for ++ and L+ ewes according to the threshold model with an interaction between the set of thresholds and the genotype. (Obs. = observed frequencies)
genotype µ ²e ²a h²
Model_2 with genotype effect on the mean and on the residual variance
++ 0 0.35 (0.01) 0.055 (0.009) 0.13 (0.02) L+ 0.50 0.66 (0.03) 0.08 (0.01) LL 0.85 1.20 (0.19) 0.05 (0.01) Mode_3 without genotype effect 0.46 (0.01) 0.084 (0.012) 0.15 (0.02)
Table 6: Results of the linear animal mixed models (precision of estimators are in bracket).