Texture of Alumina by neutron diffraction and SEM-EBSD
E. Guilmeau
1,a, C. Henrist
2,b, T.S. Suzuki
3, Y. Sakka
3,c, D. Chateigner
4, D.
Grossin
4and B. Ouladdiaf
51 Laboratory of Structural Inorganic Chemistry, University of Liège, Sart-Tilman, B4000 Liège,
Belgium
2Center for Applied Technology in Microscopy, University of Liège, Sart-Tilman, B4000 Liège,
Belgium
3 National Institute for Materials Science, Sengen 1-2-1, Tsukuba, Ibaragi 305-0047, Japan
4 CRISMAT-ENSICAEN Laboratory, UMR CNRS 6508, 6 Bd. Maréchal Juin, 14050 Caen Cedex,
France
5 ILL, BP 156, 38042 Grenoble, France
a [email protected], b [email protected], c [email protected]
Keywords: Alumina, texture, neutron, EBSD
Abstract.
The orientation distributions of α-Al2O3 textured ceramics are determined from neutron diffraction and SEM-EBSD. A curved position-sensitive detector coupled to a tilt angle (χ) scan allowed the whole neutron diffraction pattern treatment in the combined Rietveld-WIMV-Popa algorithm. Analyses from neutron and electron diffraction data gave similar results if EBSD data are smoothed to account for grain statistics. Four textured alumina ceramics were prepared by slip-casting under a high magnetic field and sintered at 800°C, 1300°C, 1400°C and 1600°C. The inverse pole figures and EBSD-mapping highlights the influence of the magnetic field and sintering temperature on the texture development. The inverse pole figures calculated for the fiber direction show a major (001) component for all the samples. With the increasing sintering temperature, the texture strength is enhanced and the c-axis distribution is sharper. The effectiveness of the combined approach for determining the crystallite size is also evident. As a global trend, the calculated crystallite size and observed grain size are similar and increase with the increasing sintering temperature. The mechanism of the texture development in the sintered specimens is certainly initiated from the preferred orientation of the green body after slip-casting under a high magnetic field. The basal texture is enhanced during sintering by selective anisotropic grain growth. We evidenced here the powerfulness of the Rietveld texture analysis correlated to SEM-EBSD calculation to provide a basis for the correlation of texture, microstructural parameters and anisotropic properties.
Introduction
The development of texture in α-Al2O3 ceramics is required to improve their anisotropic thermal conductivity, optical, electrical and mechanical properties.[1-3]. Due to the anisotropic grain growth, related to the rhombohedral crystal structure of α-Al2O3 with close-packed oxygen planes perpendicular to the c-axis, numerous suitable process methods, such as hot-forging [4], slip-casting [5], tape-slip-casting [6], template grain growth (TGG) [2], or electrophoretic deposition in a strong magnetic field [7], can produce preferred orientations in bulk materials. According to the processing treatment, different mechanisms have been reported during the last 55 years to explain the texture development, including recrystallisation [4], dislocation slip [4], grain boundary sliding All rights reserved. No part of contents of this paper may be reproduced or transmitted in any form or by any means without the
[8], and anisotropic grain growth [2,3,5]. However, correlating texture changes with processing parameters is complex. The particular type of texture often found in α-Al2O3 oriented materials is an axially symmetric fiber texture with c-axes as fiber direction usually produced by a radial symmetry process (uniaxial hot or cold pressing, slip casting) or developed by tape casting/extrusion deformations followed by sintering. This type of texture can be best characterized by the c-axis orientation distribution, but this latter, in the case of slightly oriented materials, is difficult to measure using X-rays because of the low structure factors of all the (00l) reflections. Only ODF calculation can overcome this problem. n that way, working within the framework that combines the classical Rietveld [9] analysis with texture [10] and grain size [11] analysis, as implemented in the MAUD software [12] (Materials Analysis Using Diffraction), permits a comprehensive approach to the crystal structure-texture-microstructure analysis. The increasing number of papers, based on this methodology, illustrates the interest of many researchers in materials science for Rietveld texture analysis [13-17]. In this communication we illustrate the advantages to jointly analyze the structure (Rietveld), texture (WIMV) and microstructure (Popa), of α-Al2O3 ceramics. In parallel, the Electron Back Scatter Diffraction (EBSD) method confirmed the neutron diffraction analysis. The mechanism of the texture development during the sintering treatment is discussed.
Materials
The materials were processed using the slip-casting method [5]. A high magnetic field of 10T, parallel to the slip casting direction, was applied to a suspension of fine α-Al2O3 spherical particles (∅∼150 nm) at room temperature. Due to the anisotropic magnetic susceptibility of the structure, the high magnetic field applied during the slip-casting is highly effective in rotating the particles and generating a (001) preferred orientation parallel to the magnetic field [5]. The green bodies obtained after filtration were further compacted by cold isostatic pressing (CIP) at 392 MPa for 10 minutes. Four samples were prepared by sintering at 800, 1300, 1400 and 1600°C.
Texture analysis
The specimens were first measured using the D1B neutron line at the Institut Laue Langevin, Grenoble, France. The neutron wavelength is monochromatised to λ=2.523 Å. Diffracted neutrons are collected by a curved position sensitive detector composed of 400 cells spread over 80° (resolution 0.2°) in 2θ. An Eulerian cradle allows the
χ
angle rotation. Scans were operated fromχ
= 0 to 90° (step 5°) using a fixed incidence angleω
of 35.6° ({006} Bragg position). Since the samples have an axially symmetric (fiber) texture, as expected by the processing radial symmetry and confirmed by azimuthal rotation (ϕ)
, the complete texture determination can be obtained by only tilting the sample (χ
rotation) with theϕ
rotation being unnecessary. From the nineteen 2θ scans measured for the different sample orientations, each sample was analyzed by the same procedure. First, the integrated intensities were extracted by the Le Bail algorithm [18], and used for a first refinement of the OD by the WIMV formalism. The OD obtained was then introduced in the cyclic Rietveld refinement. The new refined parameters were used for a new WIMV cycle to correct the OD, and so on. Several cycles of refinement were performed to converge towards a final characterization of the material. The refinement quality was assessed by the comparison of the experimental and recalculated diagrams and by the reliability factors: RP0 and RP1 for the OD refinement [17], and RB and Rw for the Rietveld refinement [19]. Theinstrumental profile has been calibrated using a standard calcite specimen (large crystallite sizes and no microstrains). The average volume of our samples is around 350 mm3, and the measuring time for a single spectrum is 20 min.
The same samples were analyzed by SEM-EBSD on a Philips FEG-ESEM XL 30 equiped with a OIM camera. The specimen was mounted on a 70° tilted sample stage in the evacuated SEM chamber. An area of 480×180 µm2 was measured with a step size of 2µm in both X and Y
directions obtained by beam scanning. This results in a total of around 12000 measured points, with a criteria of confidence index (CI>0.01) in order to optimize the accuracy of the orientation attribution.
Rietveld texture analysis of neutron data
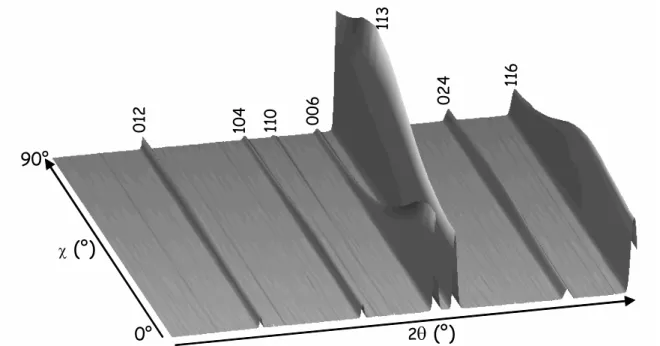
Figure 1 shows the typical neutron diffraction pattern obtained for our samples using a 0 to 90°
χ
-scan (sample sintered at 1300°C). This graph highlights without ambiguity the (001) texture of the α-alumina. In particular, we clearly observe the intensity decrease of the (006) peak whenχ
increases and the appearance of the (110) peak when
χ
tends to 90°.Figure 1: Neutron diffraction pattern for a 0 to 90°
χ
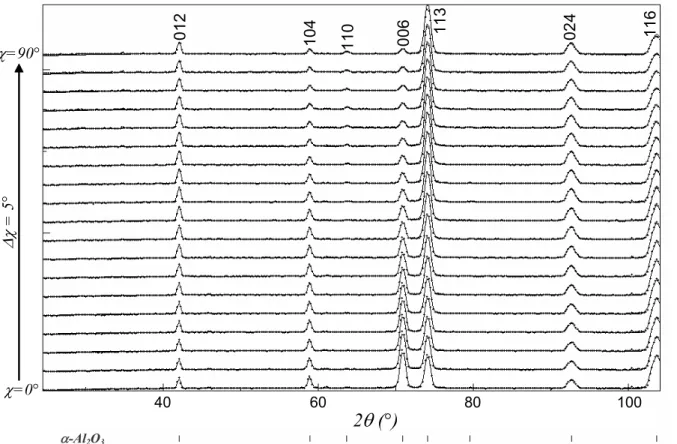
-scan. 1300°C sintered sample.On figure 2, we can also visually appreciate the agreement between the experimental (dots) and refined (lines) spectra for all the
χ
orientations. The refinement reliability is established by RP0, RP1, Rw and RB factors equal to 4.6%, 4.1%, 6.5%, and 4.8%, respectively.The full representation of the OD, which in the case of the fiber textures can be represented by the inverse pole figures (figure 3) calculated for the z fiber direction, parallel to the magnetic field illustrates (figure 3) two interesting points. First, it shows that the only component present in the four samples is with the (00l) crystallographic planes perpendicular to the slip-casting direction. Second, the degree of orientation is improved for the higher sintering temperatures: the maximum of the distribution density is increased and the c-axis distribution gets sharper.
EBSD data analysis
The 12000 individual orientation-points measured on each sample, were entered into 5×5×5° space cells and the resulting ODF was calculated in the Orinetation Imaging Microscopy (OIM) software by the discrete binning method. As mentioned above, the number of points results from a selection with a criteria of confidence index (CI>0.01), in order to optimize the accuracy of the indexing selection. However, while about 3×10⁹ grains were involved in the neutron analysis, EBSD measurements on the polished surface covered at most 10000 grains. Consequently, statistics are limited. Due to this limitation, the ODF was smoothed by applying a Gauss bell of 10° full width at half maximum and the resulting maximum of the ODF is artificially decreased compared to the neutron results. In figure 4, the inverse pole figures, calculated for the z fiber direction, present maximum almost 2-4 times lower compared to figure 3. The sample sintered at 800°C has not been analyzed in raison of the high porosity and the low crystallinity, which impedes suitable sample polishing. On the other hand, the evolution of the texture strength with increasing the sintering
01 2 10 4 11 0 006 11 3 02 4 116 2
θ (°)
χ(°)
0° 90°temperature follows the neutron data which tends to indicate that the results are correct. Further experiments must however be performed for increasing the number of points and improving the accuracy of the analysis.
Figure 2: Neutron diffraction patterns obtained for our samples using a 0 to 90°
χ
-scan (sample sintered at 1300°C). Diffracted peaks are indexed. Dotted lines represent measured diffractionintensities, solid lines represent fitted curves.
Figure 3: Inverse pole figures calculated for the z fiber direction (parallel to the magnetic field) for samples sintered at (a) 800°C, (b) 1300°C, (c) 1400°C and (d) 1600°C. Neutron diffraction data.
Major (001) component. Linear density scale, equal area projection.
Figure 4: Inverse pole figures calculated for the z fiber direction (parallel to the magnetic field) for samples sintered at (a) 1300°C, (b) 1400°C and (c) 1600°C. EBSD data. Major (001) component.
Linear density scale, equal area projection. α-Al2O3 01 2 10 4 110 00 6 113 02 4 116 χ=0° χ=90° ∆χ = 5° 40 60 80 100
2
θ
(°)
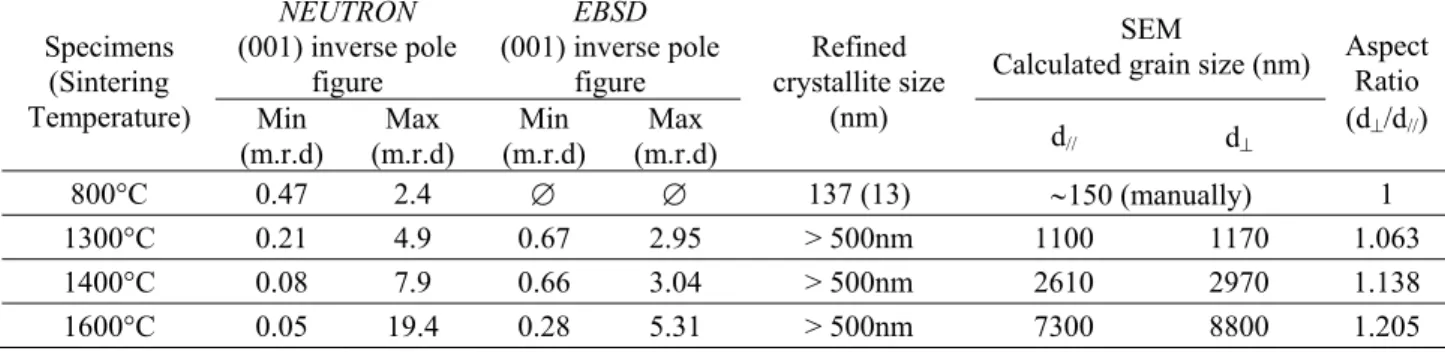
2.4 m.r.d 1 m.r.d 0.47 min 4.9 m.r.d 1 m.r.d 0.21 min 7.9 m.r.d 1 m.r.d 0.08 min 19.4 m.r.d 1 m.r.d 0.05 min 001 100 010 (a) (b) (c) (d) 3.04 m.r.d 2.95 m.r.d 1 m.r.d 1 m.r.d 0.67 min 0.66 min a) b) c) 001 100 010 5.31 m.r.d 1 m.r.d 0.28 minBased on the peak deconvolution (Popa formalism), the calculated crystallite sizes have been found to be equal to 140nm for the sample sintered at 800°C and larger than 500 nm for samples sintered at 1300, 1400 and 1600°C (crystallite sizes larger than 500 nm are not measurable under our resolution conditions). These sizes are well correlated to SEM analyses where we determined the grain sizes by the linear intercept method on the surface parallel to the magnetic field. The measurement was performed on this surface in two directions, i.e. parallel and perpendicular to the magnetic field. The values, reported in Table 1, evidenced the nearly spherical shape of the grains in the sample sintered at 800°C, whereas the grain size and the respective aspect ratio increase with increasing sintering time. Due to the low relative density (65%) of the sample sintered at 800°C, the polishing was quite difficult and did not allow the achievement of a clean and flat surface. The grain size has been manually determined in that case and not by the linear intercept method. As illustration, the figure 5 shows typical EBSD-SEM mapping of the surface parallel to the magnetic field of the sample sintered at 1600°C. We can clearly observe the texture signature with grains showing preferentially (001) planes perpendicular to the magnetic field.
Table 1: Minima and maxima of (001) inverse pole figures calculated from neutron and EBSD data. Refined crystallite size and grain size determined by line intercept method (SEM), parallel (d//) and
perpendicular (d⊥) to the magnetic field direction. Spherical grain size of the specimen sintered at
800°C was determined manually.
NEUTRON (001) inverse pole figure EBSD (001) inverse pole figure SEM
Calculated grain size (nm) Specimens
(Sintering
Temperature) Min
(m.r.d) (m.r.d) Max (m.r.d) Min (m.r.d) Max
Refined crystallite size (nm) d// d⊥ Aspect Ratio (d⊥/d//) 800°C 0.47 2.4 ∅ ∅ 137 (13) ∼150 (manually) 1 1300°C 0.21 4.9 0.67 2.95 > 500nm 1100 1170 1.063 1400°C 0.08 7.9 0.66 3.04 > 500nm 2610 2970 1.138 1600°C 0.05 19.4 0.28 5.31 > 500nm 7300 8800 1.205
Figure 5: a) EBSD-SEM mapping on the sample sintered at 1600°C and b) legend showing directions aligned with the magnetic field.
Finally, to resume the results, Table 1 offers a comparison between the texture analysis, crystallite size refinement and grain size calculation. It is first evidenced from the observation and calculation of the crystallite size that the sample sintered at 800°C did not engage the grain growth yet. It is then clear that the origin of the texture in this sample (Figure 4a) is related to the magnetic
001
100 010
B
field applied during the slip-casting process. It must be noticed that experiments without applied magnetic field during slip-casting lead to the absence of any significant texture in the body specimen as well as in the sintered samples [5]. We can then emphasize that the preferential orientation of the green body tends to favor the texture development via an anisotropic grain growth during firing. Finally the small particle size of the precursor powder (∅=150 nm) is also an important factor to provide the driving force for grain growth. Bocker et al. [6] clearly showed that small particles are necessary to develop a strong texture. Here, the specimen sintered at 1600°C exhibits a texture strength almost 8 times higher than the sample sintered at 800°C.
References
[1] T. Carisey, I. Levin, D. G. Brandon, J. Eur. Ceram. Soc. Vol. 15, 1995, p. 283. [2] E. Suvaci, G. L. Messing, J. Am. Ceram. Soc. Vol. 83, 2000, p. 2041.
[3] F. V. DiMarcello, P.L. Key, J. C. Williams, J. Am. Ceram. Soc. Vol. 55, 1972, p. 509. [4] A. H. Heuer, D. J. Sellers, W. H. Rhodes, J. Am. Ceram. Soc. Vol. 52, 1969, p. 468. [5]T. S. Suzuki, Y. Sakka, K. Kitazawa, Adv. Eng. Mat. Vol. 7, 2001, p. 490.
[6]A. Böcker, H. J. Bunge, J. Huber, W. Krahn, J. Ruska, Text. Microstr. Vol. 24, 1995, p. 167. [7] T. Uchikoshi, T. S. Suzuki, H. Okuyama, Y. Sakka, J. Mater. Res. Vol. 19, 2004, p. 1487. [8] A. H. Heuer, N. J. Tighe, R. M. Cannon, J. Am. Ceram. Soc. Vol. 63, 1980, p. 53.
[9] H. M. Rietveld, J. Appl. Cryst. Vol. 2, 1969, p. 65.
[10] S. Matthies, G. W. Vinel, Physica Status Solidi B Vol. 112, 1982, p. 111. [11] N. C. Popa, J. Appl. Cryst. Vol. 31, 1998, p. 176.
[12] L. Lutterotti, S. Matthies, H. R. Wenk, Proceedings of the 12th International Conference on Textures of Materials, Vol. 2, edited by J. A. Szpunar, 1999, p. 1599. Montreal: NRC Research Press., Freeware available at: http://www.ing.unitn.it/~luttero/maud/
[13] E. Guilmeau, D. Chateigner, J. Noudem, R. Funahashi, S. Horii, B. Ouladdiaf, Submitted to J. Appl. Cryst.
[14] H. R. Wenk, L. Cont, Y. Xie, L. Lutterotti, L. Ratschbacher, J. Richardson, J. Appl. Cryst. Vol. 34, 2001, p. 442.
[15] M. Morales, D. Chateigner, L. Lutterotti, J. Ricote. Mat. Sci. For. Vol. 408-412, 2002, p. 113. [16] Y. Xie, H.-R. Wenk, S. Matthies, Tectonophysics Vol. 370, 2003, p. 269.
[17] L. Lutterotti, S. Matthies, H.-R. Wenk, A. S. Schultz, J. W. Richardson, Jr., J. Appl. Phys. Vol. 81, 1997, p. 594.
[18] A. Le Bail, Mater. Res. Bull. Vol. 23, 1988, p. 447.