Contents lists available atScienceDirect
Dendrochronologia
journal homepage:www.elsevier.com/locate/dendro
ORIGINAL ARTICLE
Towards improving the assessment of rainforest carbon: Complementary
evidence from repeated diameter measurements and dated wood
Bhely Angoboy Ilondea
a,b,c,*
, Tom De Mil
b,c,d, Wannes Hubau
b, Joris Van Acker
c,
Jan Van den Bulcke
c, Adeline Fayolle
d, Nils Bourland
b,e,f, Olivier Kapalay
a, Arthur Chantrain
d,
Corneille Ewango
g, Hans Beeckman
baInstitut National pour l’Etude et la Recherche Agronomiques, Avenue des Cliniques 13, Kinshasha, Democratic Republic of the Congo bService of Wood Biology, Royal Museum for Central Africa (RMCA), Leuvensesteenweg 13, 3080 Tervuren, Belgium
cUGent-Woodlab, Ghent University, Laboratory of Wood Technology, Department of Forest and Water Management, Coupure Links 653, B-9000 Ghent, Belgium dForest is Life, TERRA Teaching and Research Centre, Gembloux Agro Bio-Tech, University of Liège, Belgium
eCentre for International Forestry Research, Indonesia fResources & Synergies Development Pte Ltd, Singapore
gUniversity of Kisangani, Faculty of Renewable Natural Resources Management, Democratic Republic of the Congo
A R T I C L E I N F O Keywords: Tree growth Forest inventory Dated wood Functional groups Tropical rainforest Congo Basin
Carbon stocks and sequestration
A B S T R A C T
We explore whether a growth-ring analysis can produce additional information about carbon budgets in tropical forests. Such forests are characterized by a high number of species and by trees that rarely have anatomically distinct annual growth rings, which hampers the application of dendrochronological tools in carbon balance assessments in the tropics. We use forest inventory data and archived annual diameter measurements from the Luki Biosphere Reserve in the southwestern margin of the Congo Basin forest massif. In addition, dated wood data are available from the same location thanks to tag nail traces that allow for the measurement of growth increments over a period of 66 years.
Wefind that precise increment measurements based on dated wood are advisable for small subsets of many less abundant species and for functional species groups characterized by slow growth. The dated wood approach shows that many understory trees with non-periodical rings remain in a steady state for long periods of time. These results suggest a dated wood approach is advisable for studies of growth trajectories of individual trees that might be of importance for carbon assessments in degraded forests.
1. Introduction
Stocks and sequestration of forest carbon are typically addressed through repeated tree-diameter measurements in permanent sample plots. Such measurements provide key information about tree recruit-ment and mortality. Tree growth can also be inferred by counting rings and measuring their width or, more generally expressed, distances be-tween two exactly dated positions of the cambium. The number of trees studied in such a dated wood approach is commonly low in comparison to those examined during a forest inventory, but the measurement series can be much longer.
Tropical rainforests are rich in carbon (Lewis et al., 2015) and di-verse in plant species (Huston and Marland, 2003;Pichancourt et al., 2014). More than 25 % of all global carbon and 96 % of the world's tree species are found in tropical forests (Poorter et al., 2015). The global
importance of tropical rainforests is at least partially a consequence of their enormous stocks of carbon. The world forest carbon stock is as high as 861 +/- 66 Pg; tropical forests represent 55 % of this carbon, especially in their aboveground living components (Pan et al., 2011). These quantities justify research into the carbon stock dynamics of rainforests, especially as many questions remain unanswered regarding the structure and functioning of these ecosystems (Kouadio et al., 2014). Forest dynamics depend on vital ecosystem rates, including re-generation, growth and mortality, which are to a large extent de-termined by carbon losses and sequestration. Uncertainty about vital rates hampers the establishment of sustainable forest management practices (Bayol and Borie, 2004).
Because most forest carbon is comprised of woody tissues, there is a particularly strong link between carbon sequestration and tree growth. Established methods of tree-growth analysis can therefore be used for
https://doi.org/10.1016/j.dendro.2020.125723
Received 15 February 2019; Received in revised form 26 May 2020; Accepted 18 June 2020
⁎Corresponding author at: Institut National pour l’Etude et la Recherche Agronomiques, Kinshasa, Democratic Republic of the Congo.
E-mail address:[email protected](B. Angoboy Ilondea).
Available online 22 June 2020
1125-7865/ © 2020 The Authors. Published by Elsevier GmbH. This is an open access article under the CC BY-NC-ND license (http://creativecommons.org/licenses/BY-NC-ND/4.0/).
carbon assessments. Although there is increasing interest in growth data for purposes of tropical forest management, earlier studies focused largely on commercial species that are relatively rare in the forest community (e.g.Détienne and Mariaux, 1977for the African Meliaceae, Dünisch et al., 2003for Swietenia macrophylla King and Cedrela odorata L. in the Central Amazon). However, data are lacking for the majority of species (Kouadio et al., 2014).
Discussions are ongoing about the most appropriate method for analyzing the growth of tropical rainforest trees. Many assessments are based on repeated diameter measurements. Condit (1995) and Clark et al. (1999, 2003) propose a multiannual interval of 5 years between DBH (diameter at breast height) measurements in permanent sample plots. This timeframe ensures more accurate growth data for individual trees and eventually for stem biomass increments in the forest stand. Tree-growth measurements are also possible through the so-called plotless sampling design, in which the dimensional changes of several individually selected trees are followed through time at high temporal resolution (Houllier and Gimaret-Carpentier, 1998; Richardson and King, 2013). In addition to repeated measurements of standing trees, tree growth can be assessed through the analysis of pith-to-bark growth patterns in the secondary xylem. This methodology often enables an in-depth analysis of the influence of environmental conditions on tree growth over a long period (Fritts and Swetnam, 1989;Dufour, 2006). A principal condition of this approach is that at least two past cambial positions can be exactly dated. Measurements of rings that are exactly dated to the calendar year provide the basic metrics in den-drochronology. Although dendrochronology has been applied re-peatedly in the tropics (e.g.De Ridder et al., 2013;Brienen et al., 2016; Worbes, 2002), it is less common in equatorial rainforests because of difficulties in dating wood. Many equatorial species do not form rings that are anatomically distinct and that can reliably be understood as annual.
Many forest research institutions have established permanent plots for the study of forest dynamics (Picard and Gourlet-Fleury, 2008; Lewis et al., 2015;Phillips et al., 2019). These plots are used to study floristic composition, forest structure and dynamics, recruitment, growth, and mortality of trees, often in relation to drought impacts (Ouédraogo et al., 2011). It has been shown repeatedly that growth, mortality, and recruitment depend on diameter, functional group, and social status (Díaz et al., 2013; Adler et al., 2014). Dominated and understory trees grow much slower than upper-story trees, but accurate information about their growth is sparse because of the high level of uncertainty related to diameter measurements, especially when the time intervals between censuses are small. A high degree of accuracy is important when phenomena such as zero growth (reported byDe Mil et al. (2017)for Corynanthe paniculata and Xylopia wilwhertii) are being addressed.
Repeated measurements of stem diameter at breast height (DBH) of standing trees are not complex but require long periods of follow-up. These measurements are prone to systematic errors, like divergent points of measurement in different censuses (Rondeux, 1999). If the time between censuses is short, measurement precision might not allow for the detection of small or zero growth increments. The precision of DBH growth measurements in a species-rich tropical rainforest is ex-pected to be critical when trees are being classified into separate species or species classes, like functional groups. Many species are not abun-dant in a typical plot of 1 ha, which hampers an accurate growth as-sessment. Studying individual species or subsets of species reduces substantially the number of individuals, implying a high level of un-certainty in growth data.
A dated wood approach, which is a retrospective analysis of growth and can date back to the seedling stage (Schweingruber, 1988; Dufour, 2005), is based on very precise measurements of radial increments. Highly accurate measurements of tropical tree growth are typically obtained through high-resolution dendrometers or through wood that is dated by artificially wounding the cambium (Couralet et al., 2010;
Krüger et al., 2014; Ehrlich et al., 2018). The question arises as to whether an investment in high-precision measurements could improve the assessment of rainforest carbon in certain cases, such as studies of small, slow-growing trees, which are sometimes the oldest elements of the rainforest (Hubau et al., 2019).
Observations from repeated diameter measurements have resulted in accurate assessments of plot-level carbon stocks and sequestration in tropical rainforests (Lewis et al., 2013;Hubau et al., 2019). The ques-tion arises whether measurement accuracy is affected when (i) time intervals between censuses are reduced, (ii) when growth rate is low or (iii) when plot-level data is used to study individual species or func-tional groups. It is essential to know whether an investment in a den-drochronological or a dated wood approach could produce accurate tree-growth information.
This study evaluates techniques for monitoring radial tree growth in the Central African rainforest. It compares errors linked to repeated diameter measurement methods, both in permanent plots and on in-dividual trees, with measurements based on dated wood over different time intervals, for individual species, and for subsets of understory specialists, non-specialists, and canopy specialists.
2. Material and methods
2.1. Study area
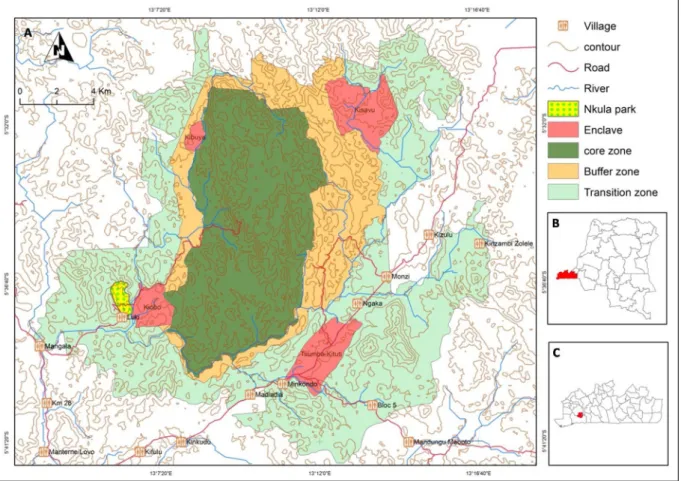
The Luki Reserve is located at the southwestern margin of the Congo within latitudes (05 124° 35′ and 05° 43′ S) and longitudes (13° 10′ and 13° 15′ E), in the Kongo Central province of the Democratic Republic of the Congo, 120 km from the Atlantic coast. The reserve is considered to be representative of the Mayombe forest (Lubini, 1997), which is part of the Lower Guinean forest biome and classified as “central African moist forest” (Fayolle et al., 2014). The climate is tropical wet Aw5 according to the classification of Köppen (Peel et al., 2007), and is influenced by the Benguela cold marine current, trade winds from the southeast (Olson et al., 2001), and the proximity to the Atlantic coast. The rainy season extends from October to May and the dry season is between June and August, in some years extending into September (Couralet et al., 2013). A small dry season is sometimes noticeable between December and February.
2.2. Diameter measurements
Repeated measurements of diameter at breast height (DBH) were made in permanent sample plots and in a plotless sampling design, both of which were established and are managed by the Institut National pour l’Etude et la Recherche Agronomiques (INERA), Luki Research Station (Fig. 1). In 2009, a total of seven 1-ha plots were installed to study tree dynamics. All trees with a DBH larger than 10 cm were measured. Each tree was labeled with a metal tag and the point of measurement (POM) was painted on the trunks. The DBH measurement was done with a metal tape at a height of 1.3 m; the height was adjusted higher or lower as needed to avoid high buttresses or other stem irre-gularities. The trees were re-measured in 2017 and 2018. These growth data represent annual DBH increments over a 7−8-year period for 6727 trees from 166 species with a DBH between 10 cm and 153 cm. Ar-chivedfield books allowed to include annual diameter measurements of individual trees outside of a plot context from 1948−1957. These trees were also monitored for phenology by INERA during the same period (Couralet et al., 2010,2013,Angoboy Ilondea et al., 2019). A redis-covered old map made it possible tofind the exact locations of 1117 of these trees along a 29.2 km path in the Nkula park, which is part of the Luki Biosphere Reserve (Fig. 1C). Information on mortality and annual diameter measurements have been digitized, resulting in a dataset of annual growth of 1117 trees between 1947 and 1957. Diameters varied between 3.5 cm for Microdesmis puberula, an understory species, and 208 cm for Entandrophragma utile, a long-lived, light-demanding tree
species.
2.3. Dated wood data
A total of 6,315 trees were tagged by the end of 1947 (INEAC, 1947; Couralet et al., 2013). Between 2014 and 2018, we rediscovered and re-measured 404 surviving tagged trees. Their DBH varied between 6.4 cm (Cola bruneelii) and 170 cm (Prioria balsamifera). The nail marks in the wood, originally from labeling of trees along a phenological trail, can be considered as cambial pinnings. These constitute a unique oppor-tunity to measure with relative precision the diameter growth of these trees over the past 66 years. In 2014, 123 individuals from the redis-covered collection with a DBH > 5 cm were sampled (89 sampled with cores and 34 with stem segments). A nail mark was clearly visible in the xylem of 59 samples, which showed no excessive wound tissue. Dis-colorations in the cells formed before the nail was inserted, dates the position of the cambium when it was nailed. The discolorations are due to oxidation processes between the wood and the iron nail. Water in vessels andfibers near the nail (especially those damaged by the nail) spread these oxides upwards and downwards. The discoloration in these cells is therefore also detectable in samples taken a few
centimeters above or below the nails. As such, the boundary of the discoloration accurately serves as a timestamp indicating the year in which the tree was nailed (1948). Furthermore, wound-induced irre-gularities in the wood that was formed after the nail was inserted are visible. This wound tissue is characterized by increased callus formation around the nail, resulting in a lump in the growth rings formed just after the nail was inserted (Hubau et al., 2019). The nail traces were used to determine the amount of wood formed between 1948 and 2014 (the date of sampling). We assume that thefirst wood formed after tagging developed during the wet season that started in October 1948. For each core, the wood increment between 1948 and 2014 was examined using aflatbed scanner and microscopes as described inDe Mil et al. (2017). The cores were surfaced with a core microtome (Gärtner and Nievergelt, 2010) and scanned using aflatbed scanner at 2400 dpi (EPSON Perfection 4990 PHOTO). The increment between 1948 and 2014 was measured using a LINTAB measuring stage in combination with TsapWin software (Rinntech, Germany) (Rinn, 2003; Seo et al., 2007; De Mil et al., 2017), and from scans with ImageJ (Schneider et al., 2012).
Fig. 2gives an overview of all data, the relevant observation per-iods, and the numbers of trees and species analyzed by each approach.
Fig. 1. Location of the Luki Biosphere Reserve: A) the reserve area with its core zone, buffer zone, transition zone, four enclaves with habitation and the Nkulapark, a disjunct part of the reserve core zone, where the trees have been monitored for phenology and growth,B) the location of the Kongo Central province in the Democratic Republic of the Congo,C) the location of the Luki Biosphere Reserve in the province of Kongo Central.
Fig. 2. Time frame, number of species and number of individual trees sampled using each of the tree-growth assessment approaches.
2.4. Data analyses
The radial increment data were grouped by tree-size classes to vi-sualize the probability distribution functions. Probability distribution functions were established for: (1) the annual DBH measurements of individual trees in the plotless sampling system between 1948 and 1957, (2) the DBH data related to the permanent plot censuses of 2009 and 2017/2018, and (3) the increments calculated from dated positions of the cambium. The calculation of the fractional uncertainty allowed a comparison between uncertainties resulting from single measurements like those of radial increments and those from repeated measurements in a statistical approach. The annual DBH growth of the trees in the plotless sampling system is calculated based on the tree’s performance from 1948 to 1957 and, for the rediscovered trees, from 2014 to 2017. When a reported value is determined by taking the average of a set of independent readings, the fractional uncertainty is given by the ratio of the uncertainty divided by the average value.
=Uncertainty
Average x
Fractional uncertainty 100
(1) When a set of several repeated readings has been taken, the meanx, and estimated standard deviation, s, can be calculated. From these, the uncertainty is the estimated standard deviation of the mean or standard error, u, and is given by:
=
u s
n (2)
where n is the number of measurements in the set. The fractional un-certainty is obtained by dividing the standard error by the average value and is expressed in %.
Descriptive statistics, including fractional uncertainties, were pro-duced for subsets of trees classified as understory specialists, non-spe-cialists, and canopy specialists. This classification is based on the Crown Illumination Index (CII) according toDawkins and Field (1978).Fig. 3 illustrates the three classes with a drawing modified from Synnott (1979). Each tree species was attributed to one of the CII classes based on published data (Hubau et al., 2019). Thefive CII were further re-duced to three groups that express the species’ light needs: understory specialists = CII-1, non-specialists = CII-2 and CII-3, canopy specia-lists = CII-4 and CII-5 (Fig. 3).
The DBH growth averages from the three different sampling ap-proaches were compared using the R package“ggpubr”: “stat_compar-e_means” function, (Kassambara, 2017). An ANOVA was performed and multiple two-to-one comparisons were made using Student's t-tests as the critical test statistic. All analyses were made in the R environment
(R Core Team, 2016).
3. Results
3.1. Pooled annual growth data
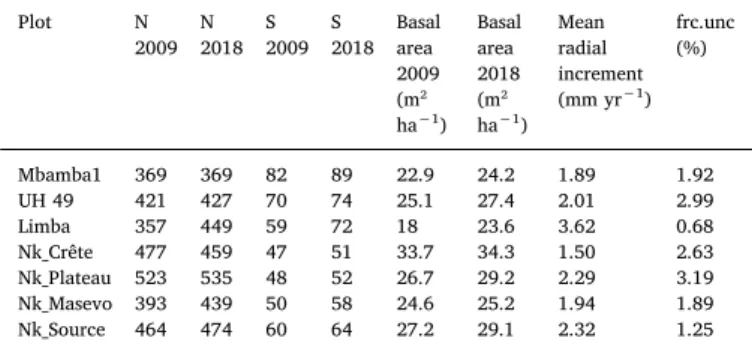
The census data from the permanent sample plots reveals baseline information about the forest communities in Nkulapark. Stem density in the Nkula plots is rising or constant between 2009 and 2018, with the exception of one plot. Tree-species richness varies between 50 and 90 species per ha (Table 1). The fractional uncertainty of the average an-nual increment for these pooled data is lower than 5% in each plot.
The probability distribution plots of the annual DBH growth show noteworthy differences between censuses (Fig. 4). The trees along the phenological monitoring trails that have been annually measured (the plotless sampling design) show more cases with small or negative va-lues (DBH growth shows a peak around zero). This is the case even when DBH measurements are averaged over the whole 1948−1957 period. For longer observation intervals (Fig. 4(g), (h), (i), and (j)), the maximum frequency is in class 1 (DBH growth of 1 mm per year). The frequencies of higher increments become gradually lower with in-creasing interval length. The 1948–2014 increment from the dated wood approach (Fig. 4) confirms a maximum DBH growth of 1 mm per year. Mean annual DBH growth changes with the length of the interval between measurements. The plotless sampling from 1948-1949 reveals that the fractional uncertainty of the full dataset is 2.49 % (Fig. 4(a)) and that the growth distribution data is still irregular. The fractional uncertainty for longer intervals stabilizes at a lower level (1.61 % for plotless sampling and for the intervals 1948–1956 and 1948−1957,
Fig. 3. Crown Illumination Index reduced to three groups as a function of light needs (adapted fromHubau et al., 2019). The yellow arrows to represent the amount of sunshine a certain class gets.
Table 1
Number of trees (N), basal area, number of species (S), mean radial increment, and fractional uncertainty (%) for 7 1-ha permanent forest plots.
Plot N 2009 N 2018 S 2009 S 2018 Basal area 2009 (m² ha−1) Basal area 2018 (m² ha−1) Mean radial increment (mm yr−1) frc.unc (%) Mbamba1 369 369 82 89 22.9 24.2 1.89 1.92 UH 49 421 427 70 74 25.1 27.4 2.01 2.99 Limba 357 449 59 72 18 23.6 3.62 0.68 Nk_Crête 477 459 47 51 33.7 34.3 1.50 2.63 Nk_Plateau 523 535 48 52 26.7 29.2 2.29 3.19 Nk_Masevo 393 439 50 58 24.6 25.2 1.94 1.89 Nk_Source 464 474 60 64 27.2 29.1 2.32 1.25
Fig. 4(g) and (h)). The time interval between diameter measurements is a key factor in reducing the uncertainty of the measurements (Strayer et al., 1986). Short intervals (1–4 year) between censuses result in some negative growth values that, logically, need to be corrected before
further analysis. Longer intervals (such as from 5 years) allow for good general growth estimations: there are only a small number of incidences of negative growth and the probability distribution shows a smooth inversed J-shape. Fractional uncertainty in this plotless experimental
Fig. 4. Probability distribution plots of DBH increments in plotless sampling: (a)-(j), dated wood: (k), and plot census approach 2009-2018: (l). The bars show the number of trees per DBH class, the red curve shows the density probability by DBH class, and the discontinuous black vertical line indicates the zero-increment point.
design varied according to the measurement intervals but remained high for long periods of time (Fig. 4i and j). The increments derived from the inventories in the 7 1-ha permanent sample plots (2009 and 2018 inventories;Fig. 4(l)) show a regular distribution of growth data with high frequencies in class 0, some cases with negative increments, and gradually lower frequencies of fast-growing trees.
The results of the different assessment approaches are compared with a Student's t-test, which highlights statistical differences between the means (supplementary Table 1).
3.2. Subsets: functional groups
Sub-setting the pooled dataset to classify the 196 species according to their CII classes provides information about the fractional un-certainty of the measurements associated with each functional group (Table 2).
DBH growth of the three functional groups according to the three different assessment approaches is shown inFig. 5. The three functional groups show stronger growth more often in plotless sampling (1948−1957) and plot census data (2009−2018) than they do in the dated wood approach. Understory specialists are represented by many trees with increments close to zero or even negative. Fig. 5 reveals important differences in the increment distribution according to the position in the canopy. The DBH growth distribution is continuous for direct increment measurements and for census data with high numbers of observations, such as for understory specialists. Several increment classes are lacking or show unexpectedly low frequencies compared to classes just below or above. This might be due to systematic measure-ment errors.
Plotless sampling (1948−1957) and plot data (2009−2018) show higher increments more frequently than ring-width measurements. Particularly in the case of non-specialists there seem to be instances of strong growth (especially for shorter observation periods in the per-manent sample plots). This is probably related to the nature of this class, which consists in part of trees growing higher into the canopy.
The plotless approach reveals for the 1948−1957 period an average increment for the three functional groups that is similar to those found in permanent sample plots. The fractional uncertainty is highest for the plotless approach, followed by the plot inventory and the direct mea-surements of increments between two dated positions of the cambium. The ANOVA and Student's t-test applied to DBH growth show sig-nificant differences between the three approaches (Fig. 5). Table 2
shows that the fractional uncertainty remains high for plotless sam-pling, followed by inventories in the permanent sample plots and as-sessments of dated wood. Mean increment values differ according to the approach. The highest values are found among the canopy specialists in the plotless approach. Understory trees show small increments, as re-vealed in the dated wood approach based on the increment covering the period 1948–2014. The fractional uncertainty is generally low for the dated wood approach and for each functional group. It is high for non-specialists, as revealed by the plotless approach: 7.95 % for the 1948−1957 period (Table 2).
The boxplots inFig. 5illustrate the degree of variability found in the computed increment values of the three functional groups according to the approach used. Plotless sampling 1948−1957 rarely produces ne-gative values for canopy specialists and non-specialists, but many anomalous values for understory specialists (CII 1). The same is true for the census data from the permanent sample plots. Ring-width mea-surements (Fig. 5) reveal a narrow distribution of growth data and significant differences between the different functional groups. As for the functional groups, canopy specialists (CII 4 and 5) have a wider distribution in the permanent sample plots compared to the dated wood approach. On the other hand, non-specialists (CII 2 and 3) have a broader DBH growth distribution by the plotless sampling approach. Understory specialists (CII 1) show a narrow distribution in all cases. The census approach and the plotless sampling show the same trend even if the absolute values are different (Fig. 5). A significant difference is observed between the three crown illumination classes (p-value < 0.05) and between the three growth measurement approaches (Fig. 5).
3.3. Subsets: individual species
The number of trees per species is rather low (between 1 for Ceiba pentandra, Isolona dewevrei, Lannea welwitschii, Microdesmis puberula, Prioria oxyphylla, and Pteleopsis hylodendron and 14 for Prioria balsami-fera), but the observation time in the dated wood approach is ex-ceptionally long compared to that of common cambial pinning experi-ments. The radial increment between the nail marks of 1948 and 2014 varies between 0.3 and 1.4 mm yr−1. The fractional uncertainty related to the measurements of each individual tree is also low and varies be-tween 0.01 % and 0.04 % for annual increments.
The DBH growth and the fractional uncertainty of the 16 species that are common in the three approaches are given in Table 3and Fig. 5. The plotless sampling showed the highest variability compared
Table 2
Comparison of mean, standard deviation (st.dev), standard error (st.err), and fractional uncertainty (frc.unc) of the DBH growth data for the three functional groups within each dataset. Census approach 2009-2018: the plot data are from a census in 2009 (installation of the plots) and a repeated census in 2018. The plotless sampling data (1948-1957) are from annual diameter measurements made between 1948 and 1957. The dated wood approach uses pith-to-bark ring-width mea-surements.
Functional groups Parameters Census approach: 2009−2018 Plotless sampling: 1948−1957 Dated wood approach: direct increment measurements
Canopy specialists N 3379 trees 321 trees 23 trees
(3555 rings)
mean (mm yr−1) 2.931 4.510 2.895
st.dev (mm yr−1) 2.087 3.390 1.939
st.err (mm yr−1) 0.036 0.189 0.034
frc.unc. (%) 1.23 4.2 1.17
Non-specialists N 579 trees 104 trees 5 trees
(560 rings)
mean (mm yr−1) 1.755 4.350 1.703
st.dev (mm yr−1) 1.403 3.530 1.286
st.err (mm yr−1) 0.058 0.346 0.054
frc.unc. (%) 3.30 7.95 3.17
Understory specialists N 2769 trees 692 trees 31 trees
(2594 rings)
mean (mm yr−1) 1.599 2.360 1.394
st.dev (mm yr−1) 1.942 2.470 0.877
st.err (mm yr−1) 0.037 0.094 0.018
frc.unc. (%) 2.31 3.98 1.29
with plot inventories and the pith-to-bark ring-width measurements. The average fractional uncertainty for the three datasets highlights a relatively high value for plotless sampling and for the plot censuses. Direct measurements of increments between dated positions of the cambium resulted in the lowest uncertainties. For each of the species, the increment in the permanent plots is the highest. The fractional uncertainty is highest in the plotless sampling, especially when the number of trees per species is low. It drops below 5% for the ring-width measurements of most species, except for Ceiba pentandra and Zan-thoxyllum gilletii, for which the number of individuals is very low. The number of nail-marked trees is too low to assure statistical certainty with regard to mean growth at the population level (Table 3).
The uncertainty of all growth measurements varies according to the approach used and the time between measurements (Fig. 4). The census approach results in a wider distribution of increment values for many of the species, whereas direct increment measurements give narrower distributions. Plotless sampling follows the same trend as the census approach but with a weaker frequency. Ceiba pentandra and Allan-blackiafloribunda had a wide distribution in the census approach; this was not the case for the plotless sampling and the measurement of wood increment between two dated positions of the cambium. This last ap-proach shows fewer outliers than the two other methods (supplemen-tary material, Table 2). The ANOVA and Student’s t-test for the 16 common species show significant differences between the three mea-surement approaches (p-value < 0.05; Supplementary material, Fig. 1).
4. Discussion
The assessment of carbon stocks and sequestration are typically estimated by repeated tree-diameter measurements in permanent sample plots (Alder and Synnott, 1992; Synnott, 1992;Talbot et al., 2014). Other estimations are based on tree-ring width measurements which are, more generally expressed as distance measurements
between two dated positions of the cambium. For every measurement there is always a margin of uncertainty, even when done carefully (Roebuck et al., 2009).Rondeux (1999)mentions the errors related to tree-diameter measurements, which he qualifies as instrumental errors linked to the quality of the measuring tape, the visibility and quality of the tape graduations, and other mechanical sources of error, such as inclination, point of measurement, and tension of the tape. However, the uncertainty of stand-level features like basal area might be accep-table given sufficient measurements. The plot censuses in 2009 and 2017/2018 showed that the basal area in Luki is 28.2 m² ha−1(mean fractional uncertainty of 0.57 %), which is lower than the average value for African rainforests (30.3 m² ha-1) and the Central African forests (31.5 m² ha-1) in particular. However, the basal area in Luki is higher than it is in the West African forests (26.4 m² ha-1) and the east African forests (27.4 m² ha-1) (Lewis et al., 2013). Luki forests are similar to those reported for the National Park of Odzala in Congo Brazzaville (Kouka, 2002) and those in the equatorial forests of the Democratic Republic of the Congo (Omatoko et al., 2015). The low values for basal area may be due to the environment of Luki. Located at the southern margin of the rainforest belt, Luki experiences less precipitation than elsewhere.Slik et al. (2010)mentions the negative correlation between rainfall and basal area, carbon stocks, and stand density. However, the Luki forest is characterized by a lot of fog and high relative humidity during the dry season (Lubini, 1997;Couralet et al., 2010;De Mil et al., 2017). Tree growth in Luki depends strongly on seasonal precipitation, contrary to Borneo’s tropical forests (Slik et al., 2010). The observed low basal area may also be characteristic of forest stands that are still accumulating biomass.
Systematic measurement errors may mask slow growth. Such errors are typically a consequence of technical measurement issues (Talbot et al., 2014), e.g influence of buttresses, periderm renewal, shrinkage or swelling of stems not related to growth, and tree bole shapes. Many incidences of negative increment in the datasets used in this study can
Fig. 5. DBH growth according to tree crown illumination index (CII) (Dawkins and Field, 1978). Boxplots show the distribution of growth values for each approach: plotless sampling (1948-1957), census data (2009-2018), and dated wood (1947-2014). P-values resulted from ANOVA and Student's t-test.
be understood as resulting from both the difficulty in measuring small diameters with a measuring tape and from systematic errors. Age esti-mates based on repeated DBH measurements will, as a consequence, likely be unrealistic for very small increments, and will be impossible for zero and negative increments. Some authors recommend longer time intervals between censuses (Biondi, 1999; Clark et al., 2007; Talbot et al., 2014). This study confirmed that long intervals between censuses are essential for good estimates of DBH growth (Clark et al., 1999,Clark et al., 2003) at the plot level.
Our comparative study also confirmed that the fractional un-certainty of growth measurement is highest for the plotless approach. However, these historical data (covering the period 1948−1957) were probably not collected following a standardized method, resulting in a high level of measurement errors. Fractional uncertainty is lowest for the measurements based on dated wood. For subsets of individual species, this dated wood approach is essential for obtaining an accep-tably low degree of fractional uncertainty.
The phenomenon of extremely slow growth is typical for the un-derstory of tropical dense moist forests, although unun-derstory growth has
been much less studied than canopy growth. The understory is often characterized by a stable microclimate (Senterre, 2005;Couralet et al., 2010) with few deciduous trees (Gourlet-Fleury et al., 2004). The un-derstory is believed to play a major role in forest regeneration (Alexandre, 1989) and has been shown to constitute a sizable, stable carbon stock, given the low mortality (Hubau et al., 2019). Understory specialists have developed a remarkable ability to establish and grow beneath a canopy (Landhäusser and Lieffers, 2001). Many of these species never reach the canopy and their growth is generally very slow (Couralet et al., 2010,Gourlet-Fleury et al., 2004;Hubau et al., 2019). The mean age of understory wood is as old as that of canopy and sub-canopy trees (Hubau et al., 2019). Our results show that slow growth rates are maintained for long periods, resulting in relatively small diameters at older ages. Understory trees show more prominent aper-iodic growth patterns with annual radial increments of 1.52 mm.
In this study, wefind that species can exhibit an extraordinary range of growth rates, from 0.29 mm yr−1(M. puberula) to 2.46 mm yr−1(C. petandra). Only the dated wood approach can provide accurate assess-ments of such slow growth rates. This is also true in cases in which the
Table 3
Annual DBH growth and fractional uncertainty of the growth data for the 16 species common to the three datasets. For the dated wood approach, N represents the number of rings in the pith-to-bark ring-width measurements.
Species Parameters Census approach 2009−2018 Plotless sampling 1948−1957 Dated wood approach
Allanblackiafloribunda N 351 39 339 DBH growth (mm yr-1) 5.16 1.63 0.9 Frc.unc. (%) 4.70 14.23 3.16 Ceiba pentandra N 113 2 107 DBH growth (mm yr-1) 9.69 6.08 1.34 Frc.unc. (%) 8.61 99.98 5.73 Celtis mildbraedii N 441 128 350 DBH growth (mm yr-1) 2.59 1.24 0.87 Frc.unc. (%) 7.604 8.11 3.171 Corynanthe paniculata N 629 103 476 DBH growth (mm yr-1) 1.96 1.55 1.18 Frc.unc. (%) 3.875 9.33 2.89 Funtumia elastica N 579 104 560 DBH growth (mm yr-1) 3.22 2.15 1.2 Frc.unc. (%) 3.322 7.97 3.187 Greenwayodendron suaveolens N 458 108 350 DBH growth (mm yr-1) 3.21 1.96 0.98 Frc.unc. (%) 5.911 9.13 3.449 Hexalobus crispiflorus N 368 62 360 DBH growth (mm yr-1) 4.41 1.21 0.94 Frc.unc. (%) 4.727 13.04 3.691 Hylodendron gabunense N 151 104 467 DBH growth (mm yr-1) 3.56 4.52 4.49 Frc.unc. (%) 13.35 7.09 3.3 Isolona dewevrei N 111 132 67 DBH growth (mm yr-1) 2.64 1.15 0.71 Frc.unc. (%) 14.588 12.19 3.342 Lannea welwitschii N 112 23 103 DBH growth (mm yr-1) 3.78 3.28 1.17 Frc.unc. (%) 10.90 25.37 4.48 Monodora angolensis N 233 44 219 DBH growth (mm yr-1) 2.12 1.48 0.74 Frc.unc. (%) 4.66 12.88 3.38 Prioria balsamifera N 2785 203 2696 DBH growth (mm yr-1) 3.66 2.65 1.13 Frc.unc. (%) 1.22 4.48 1.2 Pteleopsis hylodendron N 113 54 93 DBH growth (mm yr-1) 2.97 0.72 0.41 Frc.unc. (%) 9.61 11.96 9.2 Trichilia gilgiana N 339 75 305 DBH growth (mm yr-1) 3.16 2.21 0.75 Frc.unc. (%) 6.74 11.04 3.46 Vitex welwitschii N 95 40 84 DBH growth (mm yr-1) 0.18 0.3 0.86 Frc.unc. (%) 6.71 17.14 5.7 Zanthoxyllum gilletii N 28 62 116 DBH growth (mm yr-1) 4.05 1.63 1.87 Frc.unc. (%) 37.84 15.33 11.42
number of individuals in a subset is low or when the interval between measurements is short. Measurements of DBH in sample plots should be accurate enough to allow for reliable estimations of tree growth when all species are being pooled.
Intact forests typically have stem densities high enough for repeated diameter measurements over long inventory cycles. The influence of local disturbances on forest productivity can be more easily detected when the interval is long. In strongly degraded forests, the number of trees might not be sufficient for reliable growth estimates at the stand level. The lower stand density in such forests (ITTO, 2002) has a sub-stantial effect on carbon uptake capacity. This is an important con-sideration in the context of debates about reducing emissions from deforestation and forest degradation. Carbon storage and sequestration by forest ecosystems is an important policy option for climate change mitigation (Hubau et al., 2019). It is crucial to evaluate the different approaches for estimating tree growth and providing a reasonable quantification of forest carbon dynamics. Accurate assessments of carbon stocks and sequestration in degraded forests based on census data in permanent sample plots is difficult since the stand density has been substantially altered, impacting the growth of remaining trees. Given the low number of trees, the extra efforts are needed to produce accurate estimations. Growth-ring analysis offers an appealing ap-proach for reliable growth valuations. This confirms that systems of measuring, reporting, and verifying carbon sequestration in forests should work at different scales, and considering the tree species, the stand, and the region (Panzou et al., 2016).
5. Conclusion
Tree growth is an important parameter for forest management but precise information about many species is still lacking for dense tropical moist forests. Stand-level carbon dynamics can be accurately addressed when data for a large number of individuals covering many species are pooled. However, uncertainty issues are likely to arise when comparing functional groups or even individual species in a typical species-rich forest. In these cases, investments in higher measurement precision should be considered. Dated wood of standing trees provides key in-formation about the occurrence of extremely low growth rates or steady state conditions of certain ecosystem components, such as in understory trees.
When stand-level carbon assessments in the rainforest are needed, we recommend classical diameter measurements in permanent sample plots. This assessment gives a reliable estimation of the carbon stock. A repeat census in such plots after an interval of at leastfive years pro-vides consistent information about carbon sequestration by the forest community. This approach depends on rigorous data quality control and an error correction protocol, especially for slow-growing trees. Repeated diameter measurements of individual trees often result in good estimations of radial growth or carbon sequestration. Systematic repeated diameter measurements in plots or in a plotless design are resource-intensive and require long-term institutional support. Similarly, the length of time intervals between censuses exceeds that of typical research projects. In such cases, it may be necessary to invest in a retrospective analysis of tree growth. Moreover, many research pro-jects in the domain of forest ecology and management need subsets of community data, which often results in a very low number of in-dividuals. In these cases, an approach based on tree-ring measurements or cambial pinning is appropriate.
Declaration of Competing Interest
Authors declare no conflict of interest.
Acknowledgements
The authors thank the management andfield team of INERA-LUKI, the technical staff of the Royal Museum of Central Africa and the Laboratory of Wood Technology (Department of Forest and Water Management at Ghent University), Gembloux Agro-Bio Tech, and the University of Liege. Bhely ANGOBOY Ilondea is supported by the HERBAXYLAREDD project (BR/143/A3/HERBAXYLAREDD) and PilotMAB DGD-RMCA for his PhD. We thank Erin Gleeson, Victor Deklerck, the reviewers and the editors for substantial improvements of the manuscript.
Appendix A. Supplementary data
Supplementary material related to this article can be found, in the online version, at doi:https://doi.org/10.1016/j.dendro.2020.125723.
References
Adler, P.B., Salguero-Gómez, R., Compagnoni, A., Hsu, J.S., Ray-Mukherjee, J., Mbeau-Ache, C., Franco, M., 2014. Functional traits explain variation in plant life history strategies. PNAS 111, 740–745.https://doi.org/10.1073/pnas.1315179111.
Alder, D., Synnott, T.J., 1992. Permanent Sample Plot Techniques for Mixed Tropical Forest. Oxford Forestry Institute, University of Oxford.
Alexandre, D.Y., 1989. Dynamique de la régénération naturelle en forêt dense de Côte d’Ivoire: stratégies écologiques des arbres de de la voute et potentiels floristiques. Angoboy Ilondea, B., Beeckman, H., Ouédraogo, D.-Y., Bourland, N., De Mil, T., Van Den
Bulcke, J., Van Acker, J., Couralet, C., Ewango, C., Hubau, W., Toirambe, B., Doucet, J.-L., Fayolle, A., 2019. Une forte saisonnalité du climat et de la phénologie re-productive dans la forêt du Mayombe : l’apport des données historiques de la Réserve de Luki en République démocratique du Congo. Bois et Forêts des Tropiques 341, 39–53.https://doi.org/10.19182/bft2019.341.a31753.
Bayol, N., Borie, J.-M., 2004. Itinéraires techniques d’aménagement des forêts de pro-duction en Afrique centrale. Bois & Forets des Tropiques 281, 35–49.https://doi.org/ 10.19182/bft2004.281.a20225.
Biondi, F., 1999. Comparing tree-ring chronologies and repeated timber inventories as forest monitoring tools. Ecol. Appl. 9, 12.https://doi.org/10.1890/1051-0761(1999) 009[0216:CTRCAR]2.0.CO;2.
Brienen, R.J.W., Schöngart, J., Zuidema, P.A., 2016. Tree rings in the tropics: insights into the ecology and climate sensitivity of tropical trees. In: Goldstein, G., Santiago, L.S. (Eds.), Tropical Tree Physiology: Adaptations and Responses in a Changing Environment, Tree Physiology. Springer International Publishing, Cham, pp. 439–461.https://doi.org/10.1007/978-3-319-27422-5_20.
Clark, D.A., Piper, S.C., Keeling, C.D., Clark, D.B., 2003. Tropical rain forest tree growth and atmospheric carbon dynamics linked to interannual temperature variation during 1984–2000. PNAS 100, 5852–5857.https://doi.org/10.1073/pnas.0935903100. Clark, J.S., Wolosin, M., Dietze, M., Ibáñez, I., LaDeau, S., Welsh, M., Kloeppel, B., 2007.
Tree growth inference and prediction from diameter censuses and ring widths. Ecol. Appl. 17, 1942–1953.https://doi.org/10.1890/06-1039.1.
Condit, R., 1995. Research in large, long-term tropical forest plots. Trends Ecol. Evol. 10, 18–22.
Couralet, C., Sterck, F.J., Sass-Klaassen, U., Van Acker, J., Beeckman, H., 2010. Species-specific growth responses to climate variations in understory trees of a Central African rain forest. Biotropica 42, 503–511.https://doi.org/10.1111/j.1744-7429. 2009.00613.x.
Couralet, C., Van den Bulcke, J., Ngoma, L.M., Van Acker, J., Beeckman, H., 2013. Phenology in functional groups of central African rainforest trees. J. Trop. For. Sci. 361–374.www.jstor.org/stable/23617238.
Dawkins, H.C., Field, D.R.B., 1978. A Long-term Surveillance System for British Woodland Vegetation. Commonwealth Forestry Institute, Oxford (RU).http://www. ox.ac.uk/.
De Mil, T., Angoboy Ilondea, B., Maginet, S., Duvillier, J., Van Acker, J., Beeckman, H., Van den Bulcke, J., 2017. Cambial activity in the understory of the Mayombe forest, DR Congo. Trees Struct. Funct. 31, 49–61. https://doi.org/10.1007/s00468-016-1454-x.
De Ridder, M., Van den Bulcke, J., Van Acker, J., Beeckman, H., 2013. Tree-ring analysis of an African long-lived pioneer species as a tool for sustainable forest management. For. Ecol. Manage. 304, 417–426.https://doi.org/10.1016/j.foreco.2013.05.007.
Détienne, P., Mariaux, A., 1977. Nature et périodicité des cernes dans les bois rouges de méliacées africaines. Bois et forets des tropiques. pp. 52–61.
Díaz, S., Purvis, A., Cornelissen, J.H.C., Mace, G.M., Donoghue, M.J., Ewers, R.M., Jordano, P., Pearse, W.D., 2013. Functional traits, the phylogeny of function, and ecosystem service vulnerability. Ecol. Evol. 3, 2958–2975.https://doi.org/10.1002/ ece3.601.
Dufour, 2006. Plant species richness and environmental heterogeneity in a mountain landscape: effects of variability and spatial conFigureuration. Ecography.https://doi. org/10.1111/j.0906-7590.2006.04605.x.(accessed 1.10.20).
Dünisch, O., Montóia, V.R., Bauch, J., 2003. Dendroecological investigations on Swietenia macrophylla King and Cedrela odorata L. (Meliaceae) in the central Amazon. Trees 17, 244–250.https://doi.org/10.1007/s00468-002-0230-2.
Ehrlich, Y., Regev, L., Boaretto, E., 2018. Radiocarbon analysis of modern olive wood raises doubts concerning a crucial piece of evidence in dating the Santorini eruption. Sci. Rep. 8.https://doi.org/10.1038/s41598-018-29392-9.
Fayolle, A., Swaine, M.D., Bastin, J.-F., Bourland, N., Comiskey, J.A., Dauby, G., Doucet, J.-L., Gillet, J.-F., Gourlet-Fleury, S., Hardy, O.J., 2014. Patterns of tree species composition across tropical African forests. J. Biogeogr. 41, 2320–2331.https://doi. org/10.1111/jbi.12382.
Fritts, H.C., Swetnam, T.W., 1989. Dendroecology: a tool for evaluating variations in past and present forest environments. Advances in Ecological Research. Elsevier, pp. 111–188.
Gärtner, H., Nievergelt, D., 2010. The core-microtome: a new tool for surface preparation on cores and time series analysis of varying cell parameters. Dendrochronologia 28, 85–92.https://doi.org/10.1016/j.dendro.2009.09.002.
Gourlet-Fleury, S., Guehl, J.-M., Laroussinie, O., 2004. Ecology and Management of a Neotropical Rainforest: Lessons Drawn From Paracou, a Long-term Experimental Research Site in French Guiana. Elsevier, Paris. https://agritrop.cirad.fr/522004/.
Houllier, F., Gimaret-Carpentier, C., 1998. Assessing species richness and diversity at the community level: methodological background. Pondy Papers in Ecology. pp. 38. Hubau, W., De Mil, T., Van den Bulcke, J., Phillips, O.L., Angoboy Ilondea, B., Van Acker,
J., Sullivan, M.J.P., Nsenga, L., Toirambe, B., Couralet, C., Banin, L.F., Begne, S.K., Baker, T.R., Bourland, N., Chezeaux, E., Clark, C.J., Collins, M., Comiskey, J.A., Cuni-Sanchez, A., Deklerck, V., Dierickx, S., Doucet, J.-L., Ewango, C.E.N., Feldpausch, T.R., Gilpin, M., Gonmadje, C., Hall, J.S., Harris, D.J., Hardy, O.J., Kamdem, M.-N., Kasongo Yakusu, E., Lopez Gonzalez, G., Makana, J.-R., Malhi, Y., Mbayu, F.M., Moore, S., Mukinzi, J., Pickavance, G., Poulsen, J.R., Reitsma, J., Rousseau, M., Sonké, B., Sunderland, T., Taedoumg, H., Talbot, J., Tshibamba Mukendi, J., Umunay, P.M., Vleminckx, J., White, L.J.T., Zemagho, L., Lewis, S.L., Beeckman, H., 2019. The persistence of carbon in the African forest understory. Nat. Plants.https:// doi.org/10.1038/s41477-018-0316-5.
Huston, M.A., Marland, G., 2003. Carbon management and biodiversity. J. Environ. Manage. Maintaining For. Biodivers. 67, 77–86. https://doi.org/10.1016/S0301-4797(02)00190-00191.
INEAC, 1947. Rapport Annuel INEAC-Luki.
ITTO, 2002. ITTO Guidelines for the Restoration, Management and Rehabilitation of Degraded and Secondary Tropical Forests. ITTO Policy Development Series.. Kassambara, A., 2017. ggpubr:’ ggplot2’ Based Publication Ready Plots. R Package
Version 0.1.5. https://rdrr.io/cran/ggpubr/.
Kouadio, Y.L., Neuba, D.F., Koné, M., Bourland, N., Doucet, J., 2014. Étude de la crois-sance diamétrique de quatre essences de bois d’oeuvre exploitées à l’Est du Cameroun. J. Appl. Biosci. 77, 6444–6455.
Kouka, L.A., 2002. Recherches sur laflore, la structure et la dynamique des forêts du Parc national d’Odzala (Congo-Brazzaville). Acta Bot. Gall. 149, 225–235.https://doi.org/ 10.1080/12538078.2002.10515956.
Krüger, I., Muhr, J., Hartl-Meier, C., Schulz, C., Borken, W., 2014. Age determination of coarse woody debris with radiocarbon analysis and dendrochronological cross-dating. Eur. J. For. Res. 133, 931–939.https://doi.org/10.1007/s10342-014-0810-x. Landhäusser, S.M., Lieffers, V.J., 2001. Photosynthesis and carbon allocation of six boreal tree species grown in understory and open conditions. Tree Physiol. 21, 243–250.
https://doi.org/10.1093/treephys/21.4.243.
Lewis, S.L., Sonké, B., Sunderland, T., Begne, S.K., Lopez-Gonzalez, G., Van Der Heijden, G.M., Phillips, O.L., Affum-Baffoe, K., Baker, T.R., Banin, L., 2013. Above-ground biomass and structure of 260 African tropical forests. Philos. Trans. R. Soc. B: Biol. Sci. 368, 20120295.
Lewis, S.L., Edwards, D.P., Galbraith, D., 2015. Increasing human dominance of tropical forests. Science 349, 827–832.https://doi.org/10.1126/science.aaa9932.
Lubini, A., 1997. La végétation de la Réserve de Biosphère de Luki au Mayombe (Zaïre). 155 p. Jard. Bot. Nat. Belg. Opera Meise 10..
Olson, D.M., Dinerstein, E., Wikramanayake, E.D., Burgess, N.D., Powell, G.V., Underwood, E.C., D’amico, J.A., Itoua, I., Strand, H.E., Morrison, J.C., 2001. Terrestrial Ecoregions of the World: a New Map of Life on EarthA new global map of terrestrial ecoregions provides an innovative tool for conserving biodiversity. BioScience 51, 933–938.
Omatoko, J., Nshimba, H., Bogaert, J., Lejoly, J., Shutsha, R., Shaumba, J.P., Asimonyio, J., Ngbolua, K.N., 2015. Floristic and Structural Studies of the Settlements on Clay Soils With Pericopsis elata and Sandy With Julbernardia Seretii in the UMA Plain Forest in Democratic Republic of the Congo. 13. pp. 12.
Ouédraogo, D.-Y., Beina, D., Picard, N., Mortier, F., Baya, F., Gourlet-Fleury, S., 2011.
Thinning after selective logging facilitatesfloristic composition recovery in a tropical rain forest of Central Africa. For. Ecol. Manage. 262, 2176–2186.https://doi.org/10. 1016/j.foreco.2011.08.009.
Pan, Y., Birdsey, R.A., Fang, J., Houghton, R., Kauppi, P.E., Kurz, W.A., Phillips, O.L., Shvidenko, A., Lewis, S.L., Canadell, J.G., Ciais, P., Jackson, R.B., Pacala, S.W., McGuire, A.D., Piao, S., Rautiainen, A., Sitch, S., Hayes, D., 2011. A large and per-sistent carbon sink in the world’s forests. Science 333, 988–993.https://doi.org/10. 1126/science.1201609.
Panzou, G.L., Doucet, J.-L., Loumeto, J.-J., Biwole, A., Bauwens, S., Fayolle, A., 2016. Biomasse et stocks de carbone des forêts tropicales africaines (synthèse biblio-graphique). Biotechnologie, Agronomie, Société et Environnement 20, 508–522.
Peel, M.C., Finlayson, B.L., McMahon, T.A., 2007. Updated world map of the Köppen-Geiger climate classification. Hydrol. Earth Syst. Sci. Discuss. 4, 439–473. Phillips, O.L., Sullivan, M.J.P., Baker, T.R., Monteagudo Mendoza, A., Vargas, P.N.,
Vásquez, R., 2019. Species matter: wood density influences tropical forest biomass at multiple scales. Surv. Geophys. 40, 913–935. https://doi.org/10.1007/s10712-019-09540-0.
Picard, N., Gourlet-Fleury, S., 2008. Manuel de référence pour l’installation de dispositifs permanents en forêt de production dans le Bassin du Congo. COMIFAC.
Pichancourt, J., Firn, J., Chadès, I., Martin, T.G., 2014. Growing biodiverse carbon‐rich forests. Glob. Change Biol. 20, 382–393.https://doi.org/10.1111/gcb.12345. Poorter, L., Sande, M.T., Thompson, J., Arets, E.J., Alarcón, A., Álvarez‐Sánchez, J.,
Ascarrunz, N., Balvanera, P., Barajas‐Guzmán, G., Boit, A., Bongers, F., Carvalho, F.A., Casanoves, F., Cornejo‐Tenorio, G., Costa, F.R., Castilho, C.V., Duivenvoorden, J.F., Dutrieux, L.P., Enquist, B.J., Fernández‐Méndez, F., Finegan, B., Gormley, L.H., Healey, J.R., Hoosbeek, M.R., Ibarra‐Manríquez, G., Junqueira, A.B., Levis, C., Licona, J.C., Lisboa, L.S., Magnusson, W.E., Martínez‐Ramos, M., Martínez‐Yrizar, A., Martorano, L.G., Maskell, L.C., Mazzei, L., Meave, J.A., Mora, F., Muñoz, R., Nytch, C., Pansonato, M.P., Parr, T.W., Paz, H., Pérez‐García, E.A., Rentería, L.Y., Rodríguez‐Velazquez, J., Rozendaal, D.M., Ruschel, A.R., Sakschewski, B., Salgado‐Negret, B., Schietti, J., Simões, M., Sinclair, F.L., Souza, P.F., Souza, F.C., Stropp, J., Steege, H., Swenson, N.G., Thonicke, K., Toledo, M., Uriarte, M., Hout, P., Walker, P., Zamora, N., Peña‐Claros, M., 2015. Carbon storage in tropical forests. Glob. Ecol. Biogeogr. 24, 1314–1328.https://doi.org/10.1111/geb.12364. Richardson, C.J., King, R.S., 2013. A primer on sampling plant communities in wetlands.
Methods in Biogeochemistry of Wetlands Sssabookseries. pp. 197–223.https://doi. org/10.2136/sssabookser10.c12.
Rinn, F., 2003. TSAP-Win, Software for Tree-ring Measurement, Analysis and Presentation. Rinntech URL: http://www.rinntech.com.
Roebuck, B., Gee, M., Bennett, E.G., Morrell, R., 2009. Measurement Good Practice Guide No. 20 Mechanical Tests for Hardmetals. n.d.. pp. 84.
Rondeux, J., 1999. La mesure des arbres et des peuplements forestiers. Les presses agronomiques de Gembloux.
Schneider, C.A., Rasband, W.S., Eliceiri, K.W., 2012. NIH Image to ImageJ: 25 years of image analysis. Nat. Methods 9, 671–675.https://doi.org/10.1038/nmeth.2089.
Schweingruber, F.H., 1988. Applied dendrochronology. Tree Rings. Springer, pp. 143–254.
Senterre, B., 2005. Recherches méthodologiques pour la typologie de la végétation et la phytogéographie des forêts denses d’Afrique tropicale. Acta Botanica Gallica 152, 409–419.https://doi.org/10.1080/12538078.2005.10515499.
Seo, J.-W., Eckstein, D., Schmitt, U., 2007. The pinning method: from pinning to data preparation. Dendrochronologia 25, 79–86.https://doi.org/10.1016/j.dendro.2007. 04.001.
Slik, J.W.F., Aiba, S.-I., Brearley, F.Q., Cannon, C.H., Forshed, O., Kitayama, K., Nagamasu, H., Nilus, R., Payne, J., Paoli, G., 2010. Environmental correlates of tree biomass, basal area, wood specific gravity and stem density gradients in Borneo’s tropical forests. Glob. Ecol. Biogeogr. 19, 50–60.
Synnott, T.J., 1979. A Manual of Permanent Plot Procedures for Tropical Rainforests. Commonwealth Forestry Institute, University of Oxford.
Synnott, T., 1992. Permanent Sample Plot Techniques for Mixed Tropical Forest.
Talbot, J., Lewis, S.L., Lopez-Gonzalez, G., Brienen, R.J., Monteagudo, A., Baker, T.R., Feldpausch, T.R., Malhi, Y., Vanderwel, M., Murakami, A.A., 2014. Methods to es-timate aboveground wood productivity from long-term forest inventory plots. For. Ecol. Manage. 320, 30–38.
Worbes, M., 2002. One hundred years of tree-ring research in the tropics–a brief history and an outlook to future challenges. Dendrochronologia 20, 217–231.